Auditory Brainstem Response Latency in
Noise as a Marker of Cochlear Synaptopathy
The MIT Faculty has made this article openly available. Please share
how this access benefits you. Your story matters.
Citation
Mehraei, GGolbarg, Ann E. Hickox, Hari M. Bharadwaj, Hannah
Goldberg, Sarah Verhulst, M. Charles Liberman, and Barbara G.
Shinn-Cunningham. “Auditory Brainstem Response Latency in Noise
as a Marker of Cochlear Synaptopathy.” Journal of Neuroscience 36,
no. 13 (March 30, 2016): 3755–3764.
As Published
http://dx.doi.org/10.1523/JNEUROSCI.4460-15.2016
Publisher
Society for Neuroscience
Version
Final published version
Citable link
http://hdl.handle.net/1721.1/105258
Terms of Use
Creative Commons Attribution 4.0 International License
Systems/Circuits
Auditory Brainstem Response Latency in Noise as a Marker
of Cochlear Synaptopathy
X
Golbarg Mehraei,
1,2X
Ann E. Hickox,
1,4X
Hari M. Bharadwaj,
2,7Hannah Goldberg,
1Sarah Verhulst,
2,6M. Charles Liberman,
1,4,5and
X
Barbara G. Shinn-Cunningham
2,31Program in Speech and Hearing Bioscience and Technology, Harvard University/Massachusetts Institute of Technology, Cambridge, Massachusetts 02139, 2Center for Computational Neuroscience and Neural Technology, Boston University, Boston, Massachusetts 02215,3Department of Biomedical
Engineering, Boston University, Boston, Massachusetts 02215,4Eaton-Peabody Laboratory, Massachusetts Eye and Ear Infirmary, Boston, Massachusetts
02114,5Department of Otology and Laryngology, Harvard Medical School, Boston, Massachusetts 02114,6Cluster of Excellence Hearing4All and Medical
Physics, Department of Medical Physics and Acoustics, Oldenburg University, 26129 Oldenburg, Germany,7Martinos Center for Biomedical Imaging,
Department of Neurology, Massachusetts General Hospital/Harvard Medical School, Charlestown, Massachusetts 02129
Evidence from animal and human studies suggests that moderate acoustic exposure, causing only transient threshold elevation, can
nonetheless cause “hidden hearing loss” that interferes with coding of suprathreshold sound. Such noise exposure destroys synaptic
connections between cochlear hair cells and auditory nerve fibers; however, there is no clinical test of this synaptopathy in humans. In
animals, synaptopathy reduces the amplitude of auditory brainstem response (ABR) wave-I. Unfortunately, ABR wave-I is difficult to
measure in humans, limiting its clinical use. Here, using analogous measurements in humans and mice, we show that the effect of
masking noise on the latency of the more robust ABR wave-V mirrors changes in ABR wave-I amplitude. Furthermore, in our human
cohort, the effect of noise on wave-V latency predicts perceptual temporal sensitivity. Our results suggest that measures of the effects of
noise on ABR wave-V latency can be used to diagnose cochlear synaptopathy in humans.
Key words: auditory brainstem response; auditory nerve loss; cochlear synaptopathy; hidden hearing loss; temporal coding
Introduction
Of adult patients seeking audiological help for hearing
difficul-ties, 5–15% have normal hearing thresholds (NHTs;
Kumar et al.,
2007
;
Hind et al., 2011
). Such listeners are often diagnosed with
“central auditory processing disorders” (
Chermak and Musiek,
1997
), suggesting that a normal audiogram means that sounds
are robustly represented in auditory nerve fibers (ANFs).
How-ever, recent animal studies reveal that noise exposure causing
only temporary threshold shifts can produce permanent
“co-chlear synaptopathy,” i.e., loss of synapses and co“co-chlear-nerve
terminals innervating inner hair cells (
Kujawa and Liberman,
2009
;
Furman et al., 2013
;
Liberman and Liberman, 2015
). Aging
also destroys synaptic connections, independent of hair cell loss
(
Schmiedt et al., 1996
;
Makary et al., 2011
;
Sergeyenko et al.,
2013
). Still, losses of up to 80% of synapses do not affect
audio-metric thresholds in quiet (
Lobarinas et al., 2013
), rendering such
loss invisible to traditional clinical tests.
Models and recent human data suggest that cochlear
synaptopa-thy degrades the coding of temporal cues in suprathreshold sound
(
Lopez-Poveda and Barrios, 2013
;
Bharadwaj et al., 2014
,
2015
).
In-deed, in NHT listeners, there are large individual differences in
be-Received Dec. 14, 2015; revised Feb. 17, 2016; accepted Feb. 19, 2016.
Author contributions: G.M., A.E.H., H.M.B., S.V., M.C.L., and B.G.S.-C. designed research; G.M., A.E.H., and H.M.G. performed research; G.M. analyzed data; G.M., A.E.H., H.B., S.V., M.C.L., and B.G.S.-C. wrote the paper.
This work was supported by a fellowship from the Office of Assistant Secretary of Defense for Research and Engineering (B.G.S.-C.), National Institute on Deafness and Other Communication Disorders Grant T32 DC-00038 (G.M., A.E.H.), National Institute on Deafness and Other Communication Disorders Grants R01 DC-00188 (M.C.L.) and P30 DC-05029 (M.C.L.), and the Amelia Peabody Charitable Fund (A.E.H.). We thank K. Hancock for assistance in implementing mouse-specific masking noise and L. D. Liberman for expert assistance in cochlear histological processing.
The authors declare that they have no competing financial interests.
Correspondence should be addressed to Golbarg Mehraei, 677 Beacon Street, Boston, MA 02215. E-mail:
DOI:10.1523/JNEUROSCI.4460-15.2016
Copyright © 2016 the authors 0270-6474/16/363755-10$15.00/0
Significance Statement
Although there are suspicions that cochlear synaptopathy affects humans with normal hearing thresholds, no one has yet reported
a clinical measure that is a reliable marker of such loss. By combining human and animal data, we demonstrate that the latency of
auditory brainstem response wave-V in noise reflects auditory nerve loss. This is the first study of human listeners with normal
hearing thresholds that links individual differences observed in behavior and auditory brainstem response timing to cochlear
synaptopathy. These results can guide development of a clinical test to reveal this previously unknown form of noise-induced
hearing loss in humans.
havioral measures of temporal coding that correlate with
physiological brainstem measures affected by ANF loss (
Plack et al.,
2014
;
Bharadwaj et al., 2015
;
Shaheen et al., 2015
). Greater noise
exposure corresponds to smaller amplitude of the ANF-generated
ABR wave-I (
Stamper and Johnson, 2015
), consistent with the
ef-fects of cochlear synaptopathy on ABR wave-I in animals.
ANFs with low-spontaneous discharge rates (low-SR; SR
⬍ 20
spikes/s) are particularly susceptible to neurodegeneration caused by
noise and aging (
Schmiedt et al., 1996
;
Furman et al., 2013
;
Bourien
et al., 2014
;
Liberman and Liberman, 2015
). These fibers, which have
higher thresholds than high-SR fibers (
Liberman, 1978
), may be
important for hearing in noisy environments, because they are more
resistant to masking by background noise (
Costalupes, 1985
;
Young
and Barta, 1986
). Thus, low-SR synaptopathy could reveal itself
through difficulties processing suprathreshold sound, although it
has no discernible effect on thresholds.
We hypothesized that variation in low-SR ANF populations
underlies the variations in hearing ability among NHT listeners.
A test that reveals the fidelity of the peripheral representation of
suprathreshold sound and quantifies ANF loss could help
diag-nose communication disorders in NHT listeners.
Although ABR wave-I amplitude provides an objective
mea-sure of ANF loss in animals, it is difficult to meamea-sure robustly in
the clinic. However, ABR wave-V, generated in the lateral
lem-niscus and inferior colliculus (
Møller and Jannetta, 1985
), is
ro-bust in humans and can be recorded at low stimulus levels and in
background noise. Unfortunately, ABR wave-V amplitude is not
reduced by cochlear synaptopathy (
Sergeyenko et al., 2013
).
Here, we concentrate on the shift in ABR wave-V latency in
in-creasing levels of background noise (
Burkard and Hecox, 1983
,
1987
;
Burkard and Sims, 2002
). This shift could reflect activity of
low-SR fibers, because relative to high-SR fibers, they have a
de-layed onset response (
Rhode and Smith, 1985
;
Bourien et al.,
2014
) and are more resistant to background noise (
Costalupes,
1985
;
Young and Barta, 1986
). Selective loss of low-SR fibers
should yield smaller ABR latency shifts as noise level increases.
Furthermore, this latency shift should correlate with perceptual
measures of fine temporal encoding, which may rely on low-SR
responses (
Bharadwaj et al., 2015
).
In a cohort of young NHT listeners, we measured ABRs in
quiet and noise, as well as fine temporal coding precision, i.e.,
envelope interaural timing difference (ITD) sensitivity.
Comple-menting the human data, masked ABRs were measured in mice
with and without noise-induced ANF loss. We find a significant
relationship between ABR wave-V latency shifts and the
sensitiv-ity to envelope ITD: human subjects with the worst temporal
sensitivity showed the smallest slope relating wave-V latency to
noise level. Correspondingly, the slope relating ABR wave-IV
(analogous to human wave-V) latency to masker level was
smaller in mice with noise-induced synaptopathy than in
unex-posed controls.
Materials and Methods
Human measurements
All measures were obtained with the participants seated in an acoustically and electrically shielded booth (single-walled Eckel C-14 booth; Eckel Industries). For passive ABR measures, participants watched a silent, captioned movie of their choice, ignoring the acoustic stimuli. A personal desktop computer controlled all aspects of the experiment, including sound delivery and storing data. Special-purpose sound-control hard-ware (System 3 real-time signal processing systems, including digital-to-analog conversion and amplification; Tucker Davis Technologies) presented sound through insert phones coupled to foam ear tips. ER-1 insert phones (Etymotic) were used for ABR wave-I and behavioral ITD
measures. ER-10C earphones were used for the ABR in noise measure-ments to simultaneously record click-evoked otoacoustic emissions (CEOAEs). All sounds were digitized at a sampling rate of 48.828 kHz. For the behavioral experiments, subjects responded by button presses.
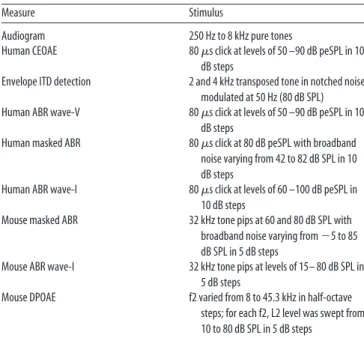
Table 1summarizes the stimuli used for each experiment.
Participants. Thirty-two (15 females) subjects, aged 20 – 40 years, were recruited from the Boston University and Massachusetts Institute of Technology community. Of the 32 subjects, four had uninterpretable ABRs as a result of signal-to-noise issues, equipment, and/or muscle artifact, one listener had tinnitus, two had elevated hearing thresholds, and two were unable to perform the ITD task at above-chance levels. The remaining 23 eligible subjects (nine females; mean age, 26.95 years) had pure-tone hearing thresholds better than 15 dB hearing level in both ears at octave frequencies between 250 Hz and 8 kHz; all had recorded ABRs in noise and in quiet. Subjects provided informed consent in accordance with protocols established at Boston University. Subject availability pre-cluded some subjects from completing some measures. The number of subjects who completed a task is noted when appropriate.
Correlate of cochlear mechanics. To obtain an objective correlate of cochlear-mechanical compression, CEOAEs were measured simultane-ously with the ABR measurements using 80s clicks at levels of 50–90 dB peak equivalent SPL (peSPL) in 10 dB increments. Each click level was presented 3000 times. CEOAEs were filtered using a 250 – 6000 Hz bandpass filter because they are most reliable from 1000 to 3000 Hz (Franklin et al., 1992). To obtain robust estimates despite artifacts, trials were combined by calculating the sample by sample median amplitude instead of the mean. The spectrum of the CEOAEs was computed, and the magnitude was compared with the spectrum of the noise floor, de-fined as the difference between the odd and even trials.
To provide more frequency-specific information, CEOAE responses were band filtered, in octave bands centered at 1000, 2000, and 4000 Hz, and the signal power for each band was calculated. The CEOAE growth function at each band is defined as the difference between the CEOAEs power (in decibels) and the input level. Across listeners, reliable CEOAEs were obtained at least in one octave-band at click levels⬎60 dB peSPL. As such, the amount of compression in each frequency band, defined as the slope of the CEOAE growth function using a linear fit on log-scale, was determined using CEOAEs at click levels of 70, 80, and 90 dB peSPL.
Behavioral measure of temporal sensitivity. To obtain a binaural measure of temporal coding, detection of ongoing envelope ITD was measured using a “transposed” tone with a carrier at either 2 or 4 kHz and an envelope modulation frequency of 50 Hz (Bernstein and Trahiotis, 2002).Figure 1
illustrates the stimuli and the trial setup in this task. The carrier phase was identical in the two ears; the ITD was applied only to the 50 Hz envelope. The
Table 1. A summary of the measures and the corresponding stimuli used
Measure Stimulus
Audiogram 250 Hz to 8 kHz pure tones
Human CEOAE 80s click at levels of 50–90 dB peSPL in 10
dB steps
Envelope ITD detection 2 and 4 kHz transposed tone in notched noise modulated at 50 Hz (80 dB SPL) Human ABR wave-V 80s click at levels of 50–90 dB peSPL in 10
dB steps
Human masked ABR 80s click at 80 dB peSPL with broadband noise varying from 42 to 82 dB SPL in 10 dB steps
Human ABR wave-I 80s click at levels of 60–100 dB peSPL in 10 dB steps
Mouse masked ABR 32 kHz tone pips at 60 and 80 dB SPL with broadband noise varying from⫺5 to 85 dB SPL in 5 dB steps
Mouse ABR wave-I 32 kHz tone pips at levels of 15– 80 dB SPL in 5 dB steps
Mouse DPOAE f2 varied from 8 to 45.3 kHz in half-octave
steps; for each f2, L2 level was swept from 10 to 80 dB SPL in 5 dB steps
450 ms stimulus was ramped with a 20 ms cos2rise decay (simultaneously in
the two ears) to minimize the use of onset cues. The stimulus level was set to 80 dB SPL. Off-frequency notched-noise maskers, realized independently in each trial, were presented at a signal-to-noise ratio of 10 dB (broadband rms) as shown inFigure 1C. The off-frequency masker extended to 20 Hz on the low-frequency side and 20 kHz on the high-frequency side and served to attenuate off-frequency listening cues, including cues from distortion prod-ucts. The bandwidth of the notch was set to the equivalent rectangular band-width (ERB) of the respective carrier frequency (i.e., ERB at 2 kHz⫽ 240.58 Hz and at 4 kHz⫽ 456.46 Hz;Glasberg and Moore, 1990). To determine whether limiting listeners to use of within-channel timing information en-hances individual differences in temporal coding, we tested an additional noise condition for the 2 kHz carrier (Fig. 1B). A diotic noise, low-pass filtered at 1.3 kHz, was presented with the stimulus to preclude the listeners’ use of any information at low frequencies, such as distortion products ( Bern-stein and Trahiotis, 2002). Conditions were presented in alternating blocks. All noises were gated on 400 ms before the first stimulus interval and gated off 200 ms after the third interval on each trial.
Threshold ITDs were determined using a three-cue, two-alternative forced-choice adaptive task as shown inFigure 1A. Each interval, marked visually by a computer monitor, occurred at intervals of 800 ms. The first interval always contained the stimulus with an ITD of 0 and served as a reference interval. The listener’s task was to detect and identify the presence of an ITD (right ear leading) that was presented with equal probability in the second or third interval. A combination of nonparametric, two-up one-down, and parametric, maximum likelihood procedure (MLP) was used to determine the ITD threshold. The two-up one-down procedure (Levitt, 1971) was used initially for seven reversals. The listener was presented with a starting ITD of 900s. The initial step size was 100 s. After two reversals, the step size was reduced to 50s and 25 s after four reversals.
The threshold estimation was then switched to the MLP (Grassi and Soranzo, 2009). In this procedure, a set of psychometric functions with the
same slope, attentional lapse rate, and chance level but different midpoints was hypothesized. After each trial, the subject’s responses up to that trial were used to calculate the likelihood of each hypothesis (i.e., each psychometric function). The ITD of the next presented trial was chosen based on the 80.9% correct point on the psycho-metric function with the highest likelihood. This procedure is repeated until the ITD estimates of the last four trials are within an 80s range of each other.
Each condition was repeated twice for a total of four blocks in each session. Additional blocks were presented if any of the runs for a condition were off by more than 1 SD from the mean. The final ITD threshold was defined as the mean of the thresholds, discarding outliers.
ABR measures. Click-evoked ABRs were mea-sured dichotically using a 32-channel EEG system (Biosemi Active II system). The better ear was chosen for testing based on the subject’s audio-gram. If there was no difference between the ears audiometrically, the left ear was chosen. ABRs were collected using a 80s click presented at a rate of 10 Hz via ER-10C insert earphones. A 20 ms interclick jitter was introduced to avoid the accumulation of any stationary interference in-cluding the 60 Hz power-line noise.
ABR wave-V measures were recorded for five different click levels varying from 50 to 90 dB peSPL in 10 dB steps. Masked ABRs were measured using a click presented at 80 dB peSPL in broadband background noise varying from 42 to 82 dB SPL in 10 dB steps. The band-width of the noise was limited by the sampling rate used to generate the stimuli and the fre-quency response of the earphones. Each condi-tion had 3000 repeticondi-tions and was presented in randomly ordered blocks. The 32 channels were referenced to the average of the mastoid channels. This measurement took⬃1 h for both the in-quiet and in-noise ABR conditions.
To obtain ABR wave-I, an ER-1 insert earphone electrode was used in addition to the 32 channels. Click levels for the wave-I measurements varied from 60 to 100 dB peSPL in 10 dB steps. The polarity of the click stimulus was alternated to prevent the interference of the cochlear mi-crophonic with the ABR. ER-1 electrodes were referenced to the mean of the Cz and Fz channels.
Recorded data sampled at 16.384 kHz were pass-band filtered between 100 and 2000 Hz. Power-line noise (60 Hz and harmonics) was removed by applying Thomson’s regression method for detecting sinusoids in signals as implemented in the Chronux toolbox (Bokil et al., 2010). The filtered data were then time epoched from⫺5 to 10 ms relative to the onset of the stimulus. Bad channels and trials were removed by analyzing the distribution of the overall amplitude across channels and trials. Spe-cifically, a channel or trial was removed if its cumulative amplitude was 2 SDs away from the mean of the distribution. Number of channels and trials were equalized across conditions for each subject. Averaged epoched responses from all good channels were combined to yield the ABR.
The averaged across-channel ABR peak-to-baseline amplitude and peak latency of waves-I and -V, respectively, were identified using visual overlay cursors on a computer screen. We verified our picks by using a denoising method that produced clear wave-V peaks that preserved the timing of the ABR (de Cheveigne´ and Simon, 2008). We found that, for those subjects for whom this analysis was performed, the wave-V laten-cies derived from the denoised responses agreed with the latenlaten-cies we found from the raw ABR, even at higher noise levels. The slope of the wave-I amplitude with stimulus level and of wave-V latency shift with noise and with stimulus level was computed by fitting a straight line
Figure 1. Experiment design of envelope ITD task. A, Each trial consists of three intervals. The ITD shift is imposed on the envelope of the transposed tone in either the second or third trial, and the listener is asked to identify this shift. In this example, the ITD shift occurs in the third interval as depicted by the arrow. The background noise turns on 400 ms before the first interval and halts 200 ms after the last interval. B, The spectrum of the transposed tone presented simultaneously with a low-pass noise. This condition was implemented for the 2 kHz carrier. C, Spectrum schematic of transposed tone presented simultaneously with notched noise. This condition was used for both 2 and 4 kHz carriers.
across the conditions in which the waveforms were identifiable. A mini-mum of three conditions in which the ABR waves-I and -V were clear was required for the linear fits.
Statistical tests. Unless otherwise specified, statistical inference was performed by fitting mixed-effects models to the data and adopting a model comparison approach (Baayen et al., 2008). Fixed-effects terms were included for the various experimental factors, whereas subject-related effects were treated as random. To not over-parameterize the random effects, models were compared with and without each term us-ing the Akaike information criterion (Pinheiro and Bates, 2000). All model coefficients and covariance parameters were estimated using re-stricted maximum likelihood as implemented in the lme4 library in R. An F approximation for the type II scaled Wald statistic was used to make inferences about the fixed effects (Kenward and Roger, 1997): this ap-proximation is more conservative in estimating type I error in contrast to the2approximation and performs well even with complex
random-effects covariance structures (Schaalje et al., 2002). The p values and F statistics based on this approximation are reported.
Animal measurements
Animal subjects and methods have been described previously in detail by
Hickox and Liberman (2014). In brief, 63 CBA/CaJ male mice (The Jackson Laboratory) were used in this study, divided evenly into three groups: two noise-exposed groups and one control group. Of the 63 animals, 54 (18 from each group) were used for physiological testing, and nine (three from each group) were used for histological analysis. Mice were exposed in groups to moderate-level noise at 16 –18 weeks of age, and cage mates served as unex-posed age- and sex-matched controls. Measures of both cochlear and audi-tory neural function were recorded to assess degree of recovery from noise exposure. Counts of synaptic ribbons per inner hair cell confirmed noise-induced loss of cochlear synapses. An additional assay, the masked ABR, was recorded to investigate new physiological indicators of noise-induced co-chlear synaptopathy, reported for the first time here. All procedures were approved by the Institutional Animal Care and Use Committee of the Mas-sachusetts Eye and Ear Infirmary.
Noise exposure. Mice were exposed for 2 h to octave-band noise (8 –16 kHz) at one of two levels: 100 or 94 dB SPL. The 100 dB “neuropathic” exposure, in these mice, causes only transient threshold elevation and extensive cochlear synaptopathy and neural loss in the basal half of the cochlea (Kujawa and Liberman, 2009). The 94 dB “non-neuropathic” exposure was designed to cause similar transient threshold elevation and no ANF loss (Hickox and Liberman, 2014), providing a control group for nonspecific exposure-related effects. Mice were placed, awake and unre-strained, in an acoustically transparent cage within a small reverberant chamber. The noise waveform was generated digitally (fifth-order But-terworth filter), amplified (Crown Power Amplifier D75A; Crown Au-dio), and presented with a compression driver (JBL model 2446H) through an exponential horn in the roof of the chamber.
Physiology: ABR and distortion product otoacoustic emission. ABRs and distortion product otoacoustic emissions (DPOAEs) were measured in the left ear of each mouse 6 –10 weeks after exposure, under ketamine/ xylazine anesthesia (100 and 20 mg/kg, respectively, i.p.). A custom acoustic assembly containing two miniature dynamic speakers and an electret condenser microphone (Knowles FG-23329-P07) was placed within millimeters of the tympanic membrane for delivery of all stimuli and recording of DPOAEs. The assembly was calibrated using a1⁄4-inch
condenser microphone (Bru¨el and Kjær), and each recording session began with in-ear calibrations. Stimulus generation and data acquisition were controlled by custom LabVIEW software on a National Instruments PXI system (16- or 24-bit soundcards).
To assess outer hair cell-based cochlear function, DPOAEs were re-corded using primary frequencies f1 and f2 (f2/f1⫽ 1.2), where f2 ⫽ 8 – 45.3 kHz in half-octave steps. For each set of primaries, levels L1 and L2 (L1–L2⫽ 10 dB) were swept from L2 ⫽ 10–80 dB SPL in 5 dB steps. Amplitude of the cubic distortion product 2f1–f2 was extracted from averaged ear canal spectra. DPOAE threshold was interpolated from am-plitude input/output functions at 2f1–f2⫽ 5 dB SPL.
To assess auditory brainstem function in quiet, ABRs were recorded using 4 ms tone pips (0.5 ms cos2rise–fall, alternating polarity, 40/s) at 32
kHz. Levels were swept from 15 to 80 dB SPL in 5 dB steps, and, at each level, average waveforms were generated from 1024 presentations (512 stimulus pairs), amplified 10,000⫻, bandpass filtered from 0.3 to 3 kHz, and stored for offline analysis. Responses were differentially recorded from subdermal needle electrodes at the vertex and ventral edge of left pinna, with ground at the base of the tail. ABR wave-I growth functions were constructed using peak 1 amplitude at each level, defined as the difference between a 1 ms average of the pre-response baseline and the wave-I peak (with additional high-pass filtering to remove low-frequency baseline shifts).
Masked ABRs were recorded as for ABRs in quiet, using 32 kHz tone-pips at 60 and 80 dB SPL. Broadband masking noise, extending from 4 to 64 kHz, was generated and played with each tone-pip presentation. The magnitude spectrum of the masking noise compensated for the CBA/CaJ mouse audiogram constructed from single-unit ANF thresholds, such that a particular noise level would have a similar masking effect across ANFs of different characteristic frequencies (CFs) regardless of their ab-solute thresholds. This method was implemented using average ANF threshold data binned according to CF in half-octave bands centered at 4 – 45.3 kHz in half-octave steps (with linear interpolation between points). Masking noise was swept from⫺5 to 85 dB SPL in 5 dB steps. Wave-IV peak latency was defined through visual analysis by two judges, and wave-IV latency slope was calculated as for human data.
Histology: synaptic ribbon counts. Left inner ears were extracted from three mice for each group (100 dB neuropathic exposure, 94 dB non-neuropathic exposure, unexposed controls), selected as representative ears based on ABR wave-I amplitude. Ears were extracted after intracardiac per-fusion (4% paraformaldehyde) while deeply anesthetized and were postfixed for 2 h at room temperature. After decalcification in EDTA for 2–3 d, the cochlear spiral was microdissected into six whole-mount pieces that were immunostained with the following: primary antibodies overnight at 37°C (mouse CtBP2 at 1:200 from BD Transduction Labs; rabbit anti-Myosin VIIa at 1:200, no. 25-6790, from Proteus Biosciences) and secondary antibodies for 1 h at 37°C (biotinylated donkey anti-mouse at 1:200, fol-lowed by streptavidin-conjugated Alexa Fluor 568 at 1:1000; Alexa Fluor 647-coupled donkey anti-rabbit at 1:200).
Whole-mount pieces were imaged using confocal microscopy (Leica TCS SP2) at specific cochlear frequency locations that were identified using a reconstruction of the cochlear frequency map across pieces (cus-tom ImageJ plug-in). For a given location, two adjacent regions were captured as z-stacks using an oil-immersion 100⫻ objective (1.4 numer-ical aperture) with 2⫻ digital zoom and a z-step of 0.25m. Z-stacks of the inner hair cell base area were analyzed offline as 3D reconstructions in Amira (Visage Imaging). Individual ribbons (anti-CtBP2 puncta) were quantified and expressed as synaptic ribbons per number of inner hair cells in the stack (anti-Myosin VIIa cytoplasmic label).
Results
The purpose of this study was twofold: to determine (1) whether
noise-induced cochlear synaptopathy in animals influences how
ABR wave-V latency shifts with increasing background noise
level and (2) whether ABR wave-V latency shifts are related to
individual differences in suprathreshold temporal coding in
young NHT listeners.
Methods and measures were designed to reveal the
contribu-tions of low-SR fibers, shown to be vulnerable to noise exposure
(
Schmiedt et al., 1996
;
Furman et al., 2013
;
Liberman and
Liber-man, 2015
), and may be important for coding in acoustic scenes
with competing sound sources (
Bharadwaj et al., 2014
,
2015
).
Specifically, we used the following: (1) high sound levels, in which
the contribution of low-SR fibers to the overall population
re-sponse is greater, in contrast to low sound intensities in which
high-SR fibers dominate (
Liberman, 1978
); (2) broadband noise
maskers for our ABR measures, to highlight the resistance of
low-SR fibers to background noise (
Costalupes, 1985
;
Young and
Barta, 1986
); and (3) off-frequency maskers for our
psychophys-ical measures, to reduce the contribution of off-frequency fibers
to encoding of the target stimulus.
Envelope ITD sensitivity was chosen as the target task because
sound localization based on timing information relies on the
time-locked synchronous response of ANFs (
Bernstein and
Tra-hiotis, 2002
). We studied sensitivity to envelope ITD with carrier
frequencies of 2 and 4 kHz because noise-induced threshold
shifts often present as notches
⬃4 kHz, and ABR wave-V has
contributions from mid to high cochlear frequency regions (
Ab-dala and Folsom, 1995
). Additionally, to test whether differences
in cochlear amplifier function affect the ABR latency and ITD
sensitivity, we measured CEOAEs as a function of click level.
Wave-V latency, wave-I amplitude, and temporal acuity
in humans
Click-evoked ABRs recorded with scalp electrodes showed a
ro-bust wave-V in both quiet and noise conditions. Responses to
stimuli in quiet showed a clear decrease in wave-V latency with
increasing stimulus level (data not shown), consistent with
pre-vious reports (
Dau, 2003
). This latency decrease can be explained
by the broadening of peripheral auditory filters with level,
yield-ing shorter impulse responses and an excitation pattern that
peaks more basally along the basilar membrane (
Neely et al.,
1988
;
Harte et al., 2009
). Conversely, masked ABRs showed
evidence of increasing wave-V latency with background noise
level (
Fig. 2
A). Measuring the slope of this latency versus
masker-level function, as calculated by a linear fit, helps
nor-malize for intersubject differences in the timing of this wave
attributable to gender, age, and head geometry (
Mitchell et al.,
1989
). As seen in
Figure 2
B–D, wave-V latency shift varied
over a wide range for our NHT subjects from 0.0018 to 0.0464
ms/dB. From here on, we will refer to this slope as the “wave-V
latency shift.”
A
B
C
D
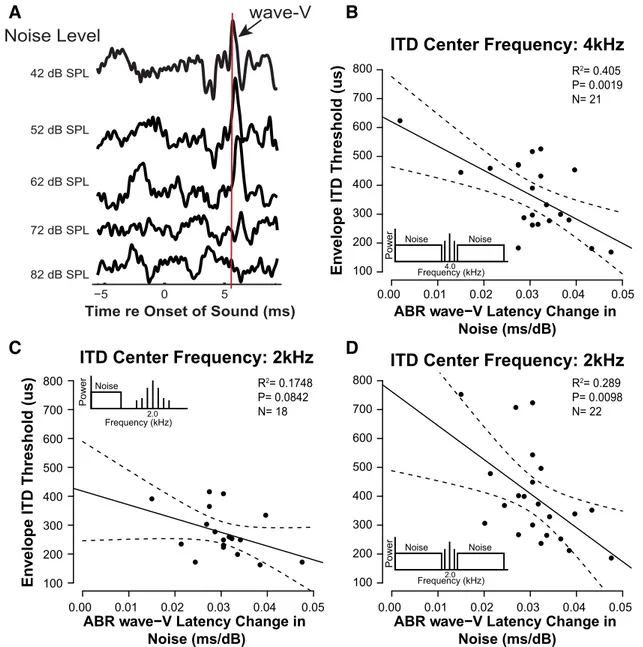
Figure 2. ABR wave-V latency shift in noise correlates with perceptual performance on temporal-cue tasks. A, Sample masked human ABRs using a 80 dB peSPL click at different background noise levels. Note how wave-V latency shifts with increasing noise level. At each noise level, peak ABR wave-V latency was defined and a linear regression was fitted to all noise level conditions in which ABR wave-V was identifiable for each listener. The slope of each fit was compared with envelope ITD sensitivity measured using a transposed tone with center frequency of 4 kHz (B) and 2 kHz (D) presented with notched noise. Notch width was equivalent to the ERB of the used center frequency. x-Axis in plots depicts the slope of each fit. There is a significant correlation between sensitivity to envelope ITD and the slope describing ABR wave-V latency shift with noise level when the ITD sensitivity is measured using notched noise. When the transposed tone was presented with a low-pass noise, allowing off-frequency listening (C), the envelope ITD sensitivity did not correlate with the masked ABR wave-V latency shift. Dashed lines in B–D depict the 90% confidence interval. Mehraei et al.• ABR Latency in Noise as a Marker of Synaptopathy J. Neurosci., March 30, 2016•36(13):3755–3764 • 3759
Concomitantly, we also found individual differences in the
bin-aural measure of temporal coding fidelity, as observed in previous
work (
Bharadwaj et al., 2015
). As shown in
Figure 2
, envelope ITD
sensitivity for carrier frequencies of 2 and 4 kHz varies widely across
our NHT listeners, from
⬃200 to 800
s when an off-frequency
masker was used (
Figure 2
B,D). This range is greater, and threshold
values are higher, than past work (
Dreyer and Oxenham, 2008
);
these differences may arise because, unlike previous studies, we (1)
presented our stimuli at a relatively high intensity, (2) introduced
off-frequency maskers, and (3) tested a lower envelope modulation
rate. When the stimulus is presented with only a low-pass noise (
Fig.
2
C), the envelope ITD thresholds improve and the range of
variabil-ity decreases, suggesting that listeners benefit from recruitment of
off-frequency fibers in this task.
To evaluate the relative contributions of different factors to
en-velope ITD detection, we used a linear mixed-effects regression
model. The model included fixed-effect terms for age, pure-tone
thresholds at 2 and 4 kHz, gender, carrier frequency, and wave-V
latency shift. Because the 2 and 4 kHz pure-tone thresholds were
correlated with envelope ITD threshold, their respective
contribu-tions cannot be disentangled from each other. However, because
neither is correlated with the wave-V latency shift, including them
does not affect inferences about how the wave-V latency shift is
related to envelope ITD coding. The main effect of the wave-V
la-tency shift was significant for predicting the envelope ITD thresholds
(F
(1,14.671)⫽ 15.16, p ⫽ 0.0015). Age was not a significant factor;
however, this is not surprising given the limited age range of our
subjects (all but two were younger than 30 years).
Post hoc analysis revealed that the smaller the wave-V latency
shift, the poorer the listener was at detecting changes in envelope
ITD when off-frequency listening was limited (
Fig. 2
B, D). This
correlation was significant for both the 2 (r
⫽ ⫺0.538, p ⫽
0.0098) and 4 (r
⫽ ⫺0.636, p ⫽ 0.0019) kHz carrier frequencies.
However, when off-frequency cues were not masked, the strength
of the relationship was reduced and failed to reach significance
(two-tailed Pearson’s correlation: r
⫽ ⫺0.418, p ⫽ 0.0842;
Fig.
2
C). This is consistent with the interpretation that the individual
differences in envelope ITD sensitivity in notched noise (
Fig.
2
B, D) is driven primarily by the contribution of on-frequency
ANFs and may mostly reflect the temporal encoding of low-SR
fibers. At higher stimulus levels, as tested here, the low-SR fibers
are relatively more synchronized to the envelope modulation of
the acoustic signal than high-SR fibers (
Bharadwaj et al., 2014
).
Thus, the timing difference in the envelope of our stimulus may
primarily but not entirely be encoded by the low-SR fibers.
To better understand the underlying mechanisms of the
wave-V latency shift in noise, we compared these values with the
wave-V latency shifts with stimulus level in quiet. The wave-V
latency shift with stimulus level reflects changes attributable to
cochlear excitation levels. If this were an important factor
affect-ing ABRs in noise, the latency shift in noise should correlate with
the wave-V latency shift in quiet, yet these two measures were
unrelated (r
⫽ ⫺0.3192, p ⫽ 0.1376), suggesting that changes in
the cochlear excitation pattern do not cause the wave-V latency shift
in noise. Furthermore, no significant relationship was found
be-tween wave-V latency shift and how wave-V amplitude changes with
either the stimulus level (r
⫽ ⫺0.0059, p ⫽ 0.9816) or the noise level
(r
⫽ 0.2043, p ⫽ 0.4016). The results are consistent with our
hypoth-esis and suggest that a loss of low-SR fibers yields sound coding
deficits that affect both hearing in background noise and in coding
temporal information at suprathreshold levels.
Because wave-V is generated in the brainstem and midbrain
(
Møller and Jannetta, 1985
), it is unclear whether the differences
in the latency shifts are a direct consequence of differences in
auditory nerve response or from a later stage of processing. To
investigate this, in a subset of our subjects (n
⫽ 10), we measured
ABR wave-I to high-level clicks (60 –100 dB peSPL) using
ear-canal electrodes (“tiptrodes”), positioned closer to the auditory
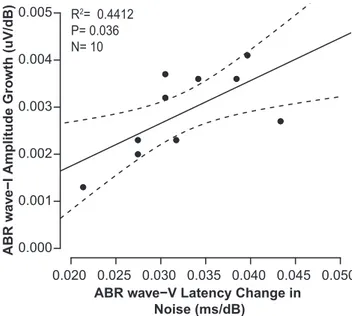
nerve generators. As shown in
Figure 3
, there was a significant
relationship between wave-I growth and wave-V latency shift
(r
⫽ 0.66, p ⫽ 0.036): listeners with a steeper wave-I growth curve
had larger wave-V latency shifts. This is consistent with our
hy-Figure 3. Human ABR wave-I amplitude growth correlates with ABR wave-V latency shift with noise level in 10 NHT listeners. ABR wave-I amplitude was defined by peak amplitude relative to 5 ms baseline. ABR wave-I amplitude growth slope with click level was calculated using a linear regression. Dashed lines depict the 90% confidence interval.
Figure 4. Mean CEOAE spectral power growth rate with increasing stimulus level for each frequency band. Growth rate is the slope of the normalized CEOAE spectral power as a function of the stimulus level. CEOAE spectral power is normalized to the stimulus level. The growth function was fitted on a log scale; thus, a slope of 0 would mean that the CEOAE spectral power grew linearly with increasing stimulus level, and a negative slope depicts a compressive growth. Error bars depict standard error. Notice that the number of subjects varies for each frequency band because not all subjects had reliable CEOAEs in each frequency band.
pothesis that differences in latency shift arise from changes in the
ANF response. In contrast, there was no correlation between
wave-I amplitude growth and wave-V amplitude growth in quiet
(r
⫽ ⫺0.1801, p ⫽ 0.5962), in agreement with the idea that, after
cochlear damage, there is compensatory gain in the central
audi-tory pathway that maintains wave-V amplitude (
Schaette and
McAlpine, 2011
;
Sergeyenko et al., 2013
).
Cochlear amplifier function
Figure 4
shows the mean CEOAEs spectral power growth rate in
each frequency band. The growth rate, defined as the slope of the
CEOAEs spectral power, is a measure of cochlear amplifier
func-tion linked to the outer hair cells (
Shera, 2004
). Abnormal
co-chlear mechanics would result in a more linear than compressive
CEOAE growth with click level. Although there are some
individ-ual differences depicted by the standard error, we found no
sig-nificant correlation between these differences and that of the
envelope ITD thresholds or the wave-V latency shifts as
summa-rized in
Table 2
. Thus, the differences we observe in the ABR and
ITD measures are not significantly affected by changes in
co-chlear mechanics, as expected if the underlying cause is related to
cochlear synaptopathy.
Wave-IV latency, wave-I amplitude, and cochlear
synaptopathy in mice
Although our human data suggest that individual differences in
the wave-V latency shift in NHT listeners arise from changes in
the auditory nerve response, studying masked ABRs in mice with
noise-induced cochlear synaptopathy allows a more direct test of
the hypothesis. Sixty-three mice were divided evenly into three
groups: (1) unexposed (controls); (2) exposed to octave-band
noise (8 –16 kHz) at 94 dB SPL designed to cause only transient
threshold elevation and no ANF loss (non-neuropathic); and (3)
exposed to the same noise at 100 dB SPL, causing transient
threshold elevation, and no hair cell loss, yet marked
degenera-tion of auditory nerve synapses (neuropathic). Cochlear
synap-topathy was assessed in representative
ears by immunostaining with an antibody
to a major protein in the presynaptic
rib-bon, present at each synaptic contact
be-tween an ANF and the hair cell it contacts
(
Hickox and Liberman, 2014
). The mean
ribbon count per hair cell was 15.95,
15.24, and 13.55 at the 11.3 kHz location
and 16.48, 14.79, and 9.22 at 32 kHz for
the
control,
non-neuropathic,
and
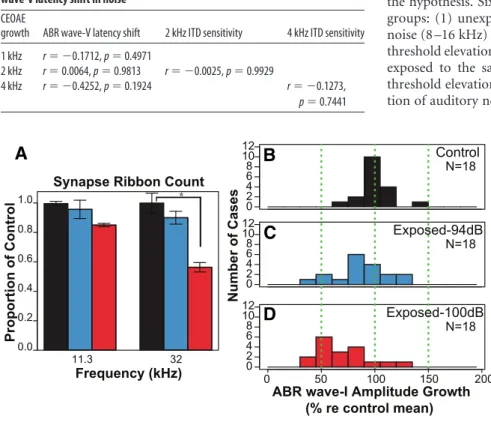
neuropathic groups, respectively. The
neuropathic group showed a significant
reduction in ribbons per hair cell
com-pared with unexposed controls (44%)
and with the non-neuropathic mice at 32
kHz, whereas the non-neuropathic group
showed ribbon counts statistically
indis-tinguishable from control (
Fig. 5
A).
Pre-vious work has shown that the loss of
synaptic connections is associated with a
corresponding decrease (36%) in the
su-prathreshold amplitude of ABR wave-I
(
Hickox and Liberman, 2014
). The wave-I
amplitude growth was further reduced
in the neuropathic group by 50%
rela-tive to the control, whereas the
non-neuropathic mice showed a reduction
that was statistically indistinguishable from control (
Fig. 5
B).
To evaluate ABR latency shifts in noise, we examined wave-IV
in mice because it is robust (
Hickox and Liberman, 2014
) and
because wave-I to wave-IV in animals are approximately
equiva-lent to wave-I to wave-V, respectively, in humans (
Møller and
Jannetta, 1985
;
Markand, 1994
). As with the human data, the
ABR wave-IV latency in mice increased with noise level. The
mean slope of the latency versus noise level functions was
smal-ler in the neuropathic group relative to control and
non-neuropathic animals (
Fig. 6
). A linear model with group and
probe level as predictors yielded significant main effects of group
(F
(2,51)⫽ 4.2, p ⫽ 0.02) and probe level (F
(1,51)⫽ 12.09, p ⫽
0.001) on wave-IV latency shift with noise level. Post hoc
one-tailed t tests revealed significant differences between the
neuro-pathic and control mice at both probe levels (60 dB, p
⫽ 0.0045;
80 dB, p
⫽ 0.0365). There was also a significant difference
be-tween the non-neuropathic and neuropathic groups at 80 dB SPL
( p
⫽ 0.0328). In contrast, no significant differences were found
in the wave-IV latency shift between the control and
non-neuropathic groups at either probe level (
Fig. 6
A, B).
To evaluate outer hair cell function, we measured DPOAEs.
Mean thresholds were similar between the control ears and the
neuropathic group, with a hint of threshold elevation at the
high-est thigh-est frequency (
Fig. 7
), suggesting mild outer hair cell damage.
To examine whether the differences in ABR latency shift are
as-cribable to slight differences in cochlear thresholds, we designed a
linear model including group, probe level, DPOAE thresholds at
32 kHz (where ABRs were measured), DPOAE thresholds at 45
A
B
C
D
Figure 5. Reduced synaptic ribbon counts and ABR wave-I amplitude growth is observed in mice after neuropathic noise exposure. A, Mean presynaptic ribbon counts per inner hair cell across exposure groups, expressed as proportion of unexposed control means. The Exposed-100 dB group (red) showed a significant reduction (*p⬍0.01)inribboncountsatthe32kHzcochlear frequency location relative to the other groups. Error bars depict standard error. Histograms of ABR wave-I amplitude growth with stimulus level for Control (B), Exposed-94 dB (C; non-neuropathic) and Exposed-100 dB (D; neuropathic) groups. Abscissa depicts percentage of wave-I growth relative to the control mean.
Table 2. Correlations for CEOAE versus ITD sensitivity in notched noise and ABR wave-V latency shift in noise
CEOAE
growth ABR wave-V latency shift 2 kHz ITD sensitivity 4 kHz ITD sensitivity 1 kHz r⫽ ⫺0.1712, p ⫽ 0.4971
2 kHz r⫽ 0.0064, p ⫽ 0.9813 r⫽ ⫺0.0025, p ⫽ 0.9929
4 kHz r⫽ ⫺0.4252, p ⫽ 0.1924 r⫽ ⫺0.1273,
p⫽ 0.7441
kHz, and their interactions as predictor
variables of wave-IV latency shift. This
model revealed only main effects of probe
level (F
(1,48)⫽ 12.14, p ⫽ 0.0011) and
group (F
(2,48)⫽ 3.26, p ⫽ 0.04); the
DPOAE thresholds were not a significant
predictor (F
(1,48)⫽ 0.49, p ⫽ 0.58). These
results support the idea that the
differ-ences between the neuropathic and
con-trol mice wave-IV latency shift arise from
the loss of ANFs rather than changes in
cochlear mechanics.
Similar to the human data, wave-IV
la-tency shifts were correlated with wave-I
amplitude growth. To compare the
wave-I amplitude growth and wave-IV
la-tency shift, we pooled across all animals
(n
⫽ 54). The animals form a continuum
of noise-exposure phenotypes (
Fig. 5
B)
without large differences in thresholds
(
Fig. 7
), similar to the human subjects in the current study who all
had thresholds within the “normal” audiometric range (⬍15 dB
hearing level). Using a mixed-effects linear model with wave-I
amplitude growth, probe level, DPOAE thresholds at both 32 and
45 kHz, and their interactions, we find significant main effects of
wave-I amplitude growth (F
(1,50)⫽ 5.187, p ⫽ 0.027) and probe
level (F
(1,50)⫽ 11.75, p ⫽ 0.0011). This analysis further supports
the idea that cochlear synaptopathy, reflected in ABR wave-I
am-plitude growth, underlies the ABR wave-IV latency shift
differ-ences between the groups of mice.
Discussion
Recent animal studies have shown that both moderate noise
ex-posure and aging can produce significant degeneration of the
synaptic connections between ANFs and hair cells without
changes to the hair cells themselves (
Kujawa and Liberman, 2009
;
Makary et al., 2011
;
Furman et al., 2013
;
Sergeyenko et al., 2013
).
This synaptopathy, which can occur immediately after a noise
exposure, is followed by a slow degeneration of the cell body and
central axon. However, once the synapse is lost, each ANF is silent
whether or not its cell body survives. This diffuse neural loss likely
degrades aspects of suprathreshold auditory processing, because
it appears to be selective for the low-SR ANFs (
Furman et al.,
2013
;
Liberman and Liberman, 2015
), but it does not elevate
thresholds as measured by conventional audiometry. Given these
characteristics, this damage has been called “hidden hearing
loss”(
Schaette and McAlpine, 2011
).
Motivated by the animal studies, we and others have looked
for correlates of hidden hearing loss in humans. A growing
num-ber of studies suggest that intersubject differences in humans
with NHTs measured both behaviorally and
electrophysiologi-cally can be explained by ANF loss (
Bharadwaj et al., 2015
;
Stamper and Johnson, 2015
). Here, we showed that, compared
with those with small wave-V latency shifts, NHT listeners
showing large wave-V latency shifts with increasing masker level
perform better on a sound localization task that requires
discrim-ination of ITDs in sound envelopes. In mice, we showed that
cochlear synaptopathy reduced an analogous measure of wave-V
latency shift in noise. In both mice and humans, the
masking-noise latency shift correlates with the growth of ABR wave-I
am-plitude with stimulus level but not with measures of cochlear
mechanics. Together, the data suggest that the latency shift in
masked ABRs could be a useful metric of hidden hearing loss in
humans.
Although we do not demonstrate a preferential loss of low-SR
fibers in our mice, there is evidence that low-SR ANFs are more
susceptible to noise exposure and aging. In aged gerbils, low- and
med-SR fibers in the high CF regions declined from 57 to 29% of
the population (
Schmiedt et al., 1996
). Similarly, after a 2 h
ex-posure,
Furman et al. (2013)
observed low-SR population drop
from 47 to 29% in guinea pigs (
Furman et al., 2013
). Therefore,
we interpret the reduction in the wave-IV latency shift in our
neuropathic mice as a result of loss of low-SR fibers.
It is difficult to compare our human results with previous
studies because (1) until recently, effects typically have been
in-A
B
Figure 6. In mice, ABR wave-IV latency shift with noise level is reduced after neuropathic noise exposure. Similar to the human ABR wave-V latency slopes, wave-IV latency was defined as peak latency, and the change in latency was fitted with a linear regression model. ABR measurements were recorded with a 60 dB SPL (A) and 80 dB SPL (B) tone pip at 32 kHz. The neuropathic mice (Exposed-100 dB) showed a significant reduction in mean wave-IV latency rate of change relative to the control and non-neuropathic groups. *P⬍ 0.5; **P ⬍ 0.005.
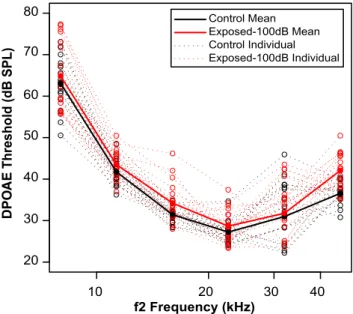
DPO
A
E
Figure 7. Like the range of thresholds encountered in the NHT listener subject group (⬍15 dB hearing level), noise-exposed mice with cochlear synaptopathy show cochlear thresholds within a normal-hearing range (within 15 dB of controls). Mice exposed to neuropathic (100 dB) noise (red) showed a modest mean elevation in cochlear thresholds in the 45 kHz region com-pared with unexposed controls (black). Analysis with a statistical linear model suggests that noise-induced differences in DPOAE thresholds, and thus cochlear mechanics, do not account for ABR wave-IV latency shifts with background noise level (see Results). Data for individual mice are shown with dotted lines and open symbols; data for group means are shown with solid lines and filled symbols.
vestigated on a group rather than individual level and (2) there
has been more focus on absolute rather than relative measures.
Nonetheless, evidence of a reduced latency shift in humans has
been seen previously in older NHT human listeners (
Burkard and
Sims, 2002
); however, this effect was only seen when the older
listeners were divided into “better” and “worse” listeners based
on audiometric thresholds and was quite small. Generally, there
is a delayed ABR wave-V latency with age (
Burkard and Sims,
2002
). This is in contrast to what we observed in the couple of
listeners we tested who were over the age of 35 years: their
abso-lute masked ABR latencies were shorter relative to the ABR
laten-cies in our other listeners, who were all younger than the age of 30
years (data not shown). Furthermore, little difference was found
in the ABR wave-V latency in quiet at the tested click levels.
The results here corroborate previous findings that implicate a
neural rather than cochlear place mechanism underlying wave-V
latency shifts in masked ABRs. Using a high-pass subtractive
masking technique and varying broadband noise level,
Burkard
and Hecox (1987)
showed that wave-V latency shifts were greater
than could be explained on the basis of shifts in cochlear region of
excitation (
Burkard and Hecox, 1987
). Additionally, there is an
interaction between stimulus repetition rate and noise level on
wave-V latency (
Burkard and Hecox, 1983
,
1987
). This
interac-tion results in a decrease in rate-induced ABR peak latency shift
in the presence of masking noise, suggesting an overlap in the
synaptic/neural mechanisms underlying masking-induced and
rate-induced latency shifts.
Studies suggest that the ABR wave-V latency shift with noise
level is linked to neural desynchronization, originating from
ei-ther presynaptic events involving the synaptic vesicle cycle or
decreased probability of discharge in postsynaptic events.
Build-ing on this neural hypothesis, we note that the degree to which
noise desynchronizes ANFs is greater in high-SR than low-SR
fibers because high-SR fibers have a low response threshold and
smaller dynamic range (
Liberman, 1978
;
Rhode et al., 1978
). In
contrast, low-SR fibers, with their higher thresholds, are more
resistant to masking by background noise (
Costalupes, 1985
;
Young and Barta, 1986
), and, as such, their relative contribution
to the total neural responses increases as noise level increases.
Although cochlear synaptopathy likely affects ABR wave-V
latency shift with noise level, alterations in brainstem/central
au-ditory activity may also influence the ABR latency. Hyperactivity
in central pathways is seen in mice with synaptic loss induced by
noise exposure (
Hickox and Liberman, 2014
) and may explain
why ABR wave-V/I amplitude ratio is increased in tinnitus
pa-tients with normal audiograms in which hidden synaptic loss
putatively induced by previous noise exposure may also be
pres-ent (
Schaette and McAlpine, 2011
). In the inferior colliculus,
older mice have a smaller response latency to
amplitude-modulated sounds, perhaps attributable to a decrease in
inhibi-tion strength with aging (
Simon et al., 2004
). Furthermore, after
carboplatin administration, the absolute wave-V latency
in-creases, without any change in slope of the latency versus
noise-level curve (
Burkard et al., 1997
). Carboplatin causes selective
inner hair cell loss at low doses. The loss of inner hair cells reduces
the strength of both low- and high-SR ANF input to higher
au-ditory centers. Correspondingly, differences in the slope of the
wave-V latency versus noise level were not observed in the study
by
Burkard et al. (1997)
. Nevertheless, this reduced input may
not only lead to delayed responses but also degraded coding of
temporal information (
Lopez-Poveda and Barrios, 2013
). Thus,
it is unclear whether and how central changes affect the ABR
wave-V latency shift with noise level and how those effects are
related to cochlear synaptopathy; more systematic investigation
is necessary.
To disambiguate the effects of central versus peripheral
changes on later waves of the ABR, we investigated the wave-IV
latency shift with noise level in mice with two types of noise
exposure. Both caused significant temporary threshold shifts;
neither caused significant loss of sensory cells; and only one
caused significant loss of ANFs (
Hickox and Liberman, 2014
).
Consistent with our hypothesis, only the neuropathic exposure
led to a significant reduction in the wave-IV shift. These results
provide empirical evidence that the reduction in wave-IV latency
shift with noise level after acoustic injury is due to the loss of
ANFs rather than a direct effect of noise exposure on the central
auditory system.
We conclude here that differences among NHT listeners, both
perceptual abilities and wave-V latency shift with noise level,
re-flect different degrees of ANF loss. Unlike absolute ABR peak
amplitude and latency analyses, in which intersubject variability
is large and dependent on numerous factors independent from
coding fidelity, we show that the relative change in latency in
noise is a robust measure of hidden hearing loss. These testing
conditions stress good temporal coding of sound that is clearly
audible, mimicking some of the challenges experienced in
every-day settings, in which many middle-aged listeners report
com-munication difficulties. It is important to note that this ABR
measure should be coupled with a measure of cochlear function,
because we do not yet know how any cochlear dysfunction affects
ABR wave-V latency in noise. Future studies should investigate
the precision of this measure in noise-exposed human cohorts
and in listeners with cochlear dysfunction.
References
Abdala C, Folsom RC (1995) The development of frequency resolution in humans as revealed by the auditory brainstem response recorded with notched noise masking. J Acoust Soc Am 98:921–930.CrossRef Medline
Baayen RH, Davidson DJ, Bates DM (2008) Mixed-effects modeling with crossed random effects for subjects and items. J Mem Lang 59:390 – 412.
CrossRef
Bernstein LR, Trahiotis C (2002) Enhancing sensitivity to interaural delays at high frequencies by using “transposed stimuli.” J Acoust Soc Am 112: 1026 –1036.CrossRef Medline
Bharadwaj HM, Verhulst S, Shaheen L, Liberman MC, Shinn-Cunningham BG (2014) Cochlear neuropathy and the coding of supra-threshold sound. Front Syst Neurosci 8:26.CrossRef Medline
Bharadwaj HM, Masud S, Mehraei G, Verhulst S, Shinn-Cunningham BG (2015) Individual differences reveal correlates of hidden hearing deficits. J Neurosci 35:2161–2172.CrossRef Medline
Bokil H, Andrews P, Kulkarni JE, Mehta S, Mitra PP (2010) Chronux: a platform for analyzing neural signals. J Neurosci Methods 192:146 –151.
CrossRef Medline
Bourien J, Tang Y, Batrel C, Huet A, Lenoir M, Ladrech S, Desmadryl G, Nouvian R, Puel JL, Wang J (2014) Contribution of auditory nerve fi-bers to compound action potential of the auditory nerve. J Neurophysiol 112:1025–1039.CrossRef Medline
Burkard R, Hecox K (1983) The effect of broadband noise on the human brain-stem evoked response. I. Rate and intensity effects. J Acoust Soc Am 74:1204 –1213.CrossRef Medline
Burkard R, Hecox KE (1987) The effect of broadband noise on the human brain-stem auditory evoked response. III. Anatomic locus. J Acoust Soc Am 81:1050 –1063.CrossRef Medline
Burkard RF, Sims D (2002) A comparison of the effects of broadband mask-ing noise on the auditory brainstem response in young and older adults. Am J Audiol 11:13–22.CrossRef Medline
Burkard R, Trautwein P, Salvi R (1997) The effects of click level, click rate, and level of background masking noise on the inferior colliculus potential (ICP) in the normal and carboplatin-treated chinchilla. J Acoust Soc Am 102:3620 –3627.CrossRef Medline
Chermak GD, Musiek FE (1997) Central auditory processing disorders: new perspectives. San Diego: Singular Publishing Group.
Costalupes JA (1985) Representation of tones in noise in the responses of auditory nerve fibers in cats. I. Comparison with detection thresholds. J Neurosci 5:3261–3269.Medline
Dau T (2003) The importance of cochlear processing for the formation of auditory brainstem and frequency following responses. J Acoust Soc Am 113:936 –950.CrossRef Medline
de Cheveigne´ A, Simon JZ (2008) Denoising based on spatial filtering. J Neurosci Methods 171:331–339.CrossRef Medline
Dreyer AA, Oxenham AJ (2008) Effects of level and background noise on interaural time difference discrimination for transposed stimuli. J Acoust Soc Am 123:EL1–EL7.CrossRef Medline
Franklin DJ, McCoy MJ, Martin GK, Lonsbury-Martin BL (1992) Test/re-test reliability of distortion product and transiently evoked otoacoustic emissions. Ear Hear 13:417– 429.CrossRef Medline
Furman AC, Kujawa SG, Liberman MC (2013) Noise-induced cochlear neuropathy is selective for fibers with low spontaneous rates. J Neuro-physiol 110:577–586.CrossRef Medline
Glasberg BR, Moore BC (1990) Derivation of auditory filter shapes from notched-noise data. Hear Res 47:103–138.CrossRef Medline
Grassi M, Soranzo A (2009) MLP: a MATLAB toolbox for rapid and reliable auditory threshold estimations. Behav Res Methods 41:20 –28.CrossRef Medline
Harte JM, Pigasse G, Dau T (2009) Comparison of cochlear delay estimates using otoacoustic emissions and auditory brainstem responses. J Acoust Soc Am 126:1291–1301.CrossRef Medline
Hickox AE, Liberman MC (2014) Is noise-induced cochlear neuropathy key to the generation of hyperacusis or tinnitus? J Neurophysiol 111:552–564.
CrossRef Medline
Hind SE, Haines-Bazrafshan R, Benton CL, Brassington W, Towle B, Moore DR (2011) Prevalence of clinical referrals having hearing thresholds within normal limits. Int J Audiol 50:708 –716.CrossRef Medline
Kenward MG, Roger JH (1997) Small sample inference for fixed effects from restricted maximum likelihood. Biometrics 53:983–997.CrossRef Medline
Kujawa SG, Liberman MC (2009) Adding insult to injury: Cochlear nerve degeneration after “temporary” noise-induced hearing loss. J Neurosci 29:14077–14085.CrossRef Medline
Kumar G, Amen F, Roy D (2007) Normal hearing tests: is a further appoint-ment really necessary? J R Soc Med 100:66.CrossRef Medline
Levitt H (1971) Transformed up-down methods in psychoacoustics. J Acoust Soc Am 49:Suppl 2:467⫹.CrossRef Medline
Liberman MC (1978) Auditory-nerve response from cats raised in a low-noise chamber. J Acoust Soc Am 63:442– 455.CrossRef Medline
Liberman LD, Suzuki J, Liberman MC (2015) Dynamics of cochlear synap-topathy after acoustic overexposure. J Assoc Res Otolaryngol 16:205–219.
CrossRef Medline
Lobarinas E, Salvi R, Ding D (2013) Insensitivity of the audiogram to car-boplatin induced inner hair cell loss in chinchillas. Hear Res 302:113–120.
CrossRef Medline
Lopez-Poveda EA, Barrios P (2013) Perception of stochastically
under-sampled sound waveforms: a model of auditory deafferentation. Front Neurosci 7:124.CrossRef Medline
Makary CA, Shin J, Kujawa SG, Liberman MC, Merchant SN (2011) Age-related primary cochlear neuronal degeneration in human temporal bones. J Assoc Res Otolaryngol 12:711–717.CrossRef Medline
Markand ON (1994) Brainstem auditory evoked potentials. J Clin Neuro-physiol 11:319 –342.CrossRef Medline
Mitchell C, Phillips DS, Trune DR (1989) Variables affecting the auditory brainstem response: audiogram, age, gender and head size. Hear Res 40: 75– 85.CrossRef Medline
Møller AR, Jannetta PJ (1985) Neural generators of the auditory brainstem response. In: The auditory brainstem response (Jacobson JT, ed), pp 13– 31. San Diego: College Hill.
Neely ST, Norton SJ, Gorga MP, Jesteadt W (1988) Latency of auditory brain-stem responses and otoacoustic emissions using tone-burst stimuli. J Acoust Soc Am 83:652– 656.CrossRef Medline
Pinheiro J, Bates D (2000) Mixed-effects models in S and S-PLUS. New York: Springer.
Plack C, Baker D, Prendergast G (2014) Perceptual consequences of “hid-den” hearing loss. Trends Hear 18:1–11.CrossRef
Rhode W, Smith P (1985) Characteristics of tone-pip response patterns in relationship to spontaneous rate in cat auditory nerve fibers. Hear Res 114:159 –168.
Rhode W, Geisler CD, Kennedy DT (1978) Auditory nerve fiber response to wide-band noise and tone combinations. J Neurophysiol 41:692–704.
Medline
Schaalje BG, Mcbride JB, Fellingham GW (2002) Adequacy of approxima-tions to distribuapproxima-tions of test statistics in complex mixed linear models. J Agricult Biol Environ Stats 7:512–524.CrossRef
Schaette R, McAlpine D (2011) Tinnitus with a normal audiogram: physio-logical evidence for hidden hearing loss and computational model. J Neu-rosci 31:13452–13457.CrossRef Medline
Schmiedt RA, Mills JH, Boettcher FA (1996) Age-related loss of activity of auditory-nerve fibers. J Neurophysiol 76:2799 –2803.Medline
Sergeyenko Y, Lall K, Liberman MC, Kujawa SG (2013) Age-related co-chlear synaptopathy: an early-onset contributor to auditory functional decline. J Neurosci 33:13686 –13694.CrossRef Medline
Shaheen LA, Valero MD, Liberman MC (2015) Towards a diagnosis of co-chlear neuropathy with envelope following responses. J Assoc Res Otolar-yngol 16:727–745.CrossRef Medline
Shera CA (2004) Mechanisms of mammalian otoacoustic emission and their implications for the clinical utility of otoacoustic emissions. Ear Hear 25:86 –97.CrossRef Medline
Simon H, Frisina RD, Walton JP (2004) Age reduces response latency of mouse inferior colliculus neurons to AM sounds. J Acoust Soc Am 116: 469 – 477.CrossRef Medline
Stamper GC, Johnson TA (2015) Auditory function in normal-hearing, noise-exposed human ears. Ear Hear 36:172–184.CrossRef Medline
Young ED, Barta PE (1986) Rate responses of auditory nerve fibers to tones in noise near masked threshold. J Acoust Soc Am 79:426 – 442.CrossRef Medline