Publisher’s version / Version de l'éditeur:
IEEE Sensors Journal, 12, 6, pp. 1987-1992, 2012-06-01
READ THESE TERMS AND CONDITIONS CAREFULLY BEFORE USING THIS WEBSITE. https://nrc-publications.canada.ca/eng/copyright
Vous avez des questions? Nous pouvons vous aider. Pour communiquer directement avec un auteur, consultez la première page de la revue dans laquelle son article a été publié afin de trouver ses coordonnées. Si vous n’arrivez pas à les repérer, communiquez avec nous à PublicationsArchive-ArchivesPublications@nrc-cnrc.gc.ca.
Questions? Contact the NRC Publications Archive team at
PublicationsArchive-ArchivesPublications@nrc-cnrc.gc.ca. If you wish to email the authors directly, please see the first page of the publication for their contact information.
NRC Publications Archive
Archives des publications du CNRC
This publication could be one of several versions: author’s original, accepted manuscript or the publisher’s version. / La version de cette publication peut être l’une des suivantes : la version prépublication de l’auteur, la version acceptée du manuscrit ou la version de l’éditeur.
For the publisher’s version, please access the DOI link below./ Pour consulter la version de l’éditeur, utilisez le lien DOI ci-dessous.
https://doi.org/10.1109/JSEN.2011.2181161
Access and use of this website and the material on it are subject to the Terms and Conditions set forth at
State of the art review of technologies for pipe structural health
monitoring
Liu, Z.; Kleiner, Y.
https://publications-cnrc.canada.ca/fra/droits
L’accès à ce site Web et l’utilisation de son contenu sont assujettis aux conditions présentées dans le site LISEZ CES CONDITIONS ATTENTIVEMENT AVANT D’UTILISER CE SITE WEB.
NRC Publications Record / Notice d'Archives des publications de CNRC:
https://nrc-publications.canada.ca/eng/view/object/?id=391b5d78-8f9f-4e23-8bd2-398ef1995d01 https://publications-cnrc.canada.ca/fra/voir/objet/?id=391b5d78-8f9f-4e23-8bd2-398ef1995d01
State of the art review of
technologies for pipe structural
health monitoring
Liu, Z.; Kleiner, Y.
NRCC-54585
A version of this document is published in IEEE Sensors Journal, 12, (6), pp. 1987-1992, June-01-12,
10.1109/JSEN.2011.2181161
The material in this document is covered by the provisions of the Copyright Act, by Canadian laws, policies, regulations and international agreements. Such provisions serve to identify the information source and, in specific instances, to prohibit reproduction of materials without written permission. For more information visit http://laws.justice.gc.ca/en/showtdm/cs/C-42
Les renseignements dans ce document sont protégés par la Loi sur le droit d’auteur, par les lois, les politiques et les règlements du Canada et des accords internationaux. Ces dispositions permettent d’identifier la source de l’information et, dans certains cas, d’interdire la copie de documents sans permission écrite. Pour obtenir de plus amples renseignements : http://lois.justice.gc.ca/fr/showtdm/cs/C-42
State of the Art Review of Technologies for Pipe
Structural Health Monitoring
Zheng Liu, Senior Member, IEEE, and Yehuda Kleiner
Abstract
Advances in electronics, sensor technology, information science, electrical and computer engineering give rise to emerging technologies, some of which could be applied to the inspection, monitoring, and condition assessment of buried water mains. This paper presents a state of the review of sensor technologies used for monitoring indicators pointing to pipe structural deterioration. The potential for multi-sensor system and sensor data fusion for condition-based maintenance are also discussed.
Index Terms
Pipe condition assessment, sensor, structural health monitoring, sensor data fusion.
I. INTRODUCTION
C
ONDITION assessment is critical to the management and maintenance of water transmission and distribution systems,which are typically buried and out of sight. A companion paper provided an introduction to the essence of condition assessment of buried pipes. It also provided a state-of-the-art review of pipe inspection technologies. In this paper we continue the state-of-the-art review focusing on pipe monitoring technologies and techniques, which provide a continuous stream of data to support awareness of pipe performance and health state. Sensor data are typically available in two forms: state awareness and usage [1]. State awareness sensors provide information about the current state of the material and the structural health from initial indications of defects. Usage sensors directly or indirectly measure external impacts that lead to damage, such as local stresses and environmental parameters (temperature, humidity, local chemistry, etc.). Section II of this paper will focus on the state awareness sensors.The use of sensor for continuous monitoring is relevant to the concept of structural health monitoring (SHM), which is defined as a process to implement a damage identification strategy for varied infrastructures [2]. Herein, “health” refers to the ability of the structure to continue to perform its intended function in light of the inevitable aging and damage accumulation resulting from the operational environments. According to the description in [2], [3], the SHM process involves the observation of a structure or mechanical system over time with periodical measurements, the extraction of damage-sensitive features from these measurements, and the statistical analysis of these features to determine the current state of system health.
Fig. 1. The role of monitoring for pipe life extension and replacement.
The role of monitoring is illustrated in Fig. 1. Sensor monitoring data are used for condition assessment and estimation of deterioration rate for pipes, and eventually contribute to the prediction of residual useful life leading to actionable decisions.
The rest of the paper is organized as follows: a detailed review of sensor techniques is presented in section II; wireless sensor network and multi-sensor system are described in section III and IV respectively. Section V summarizes this paper.
The authors are with the Institute for Research in Construction, National Research Council Canada, Ottawa, Ontario K1A 0R6 Canada (E-mail: zheng.liu@nrc-cnrc.gc.ca).
II. SENSORTECHNIQUES FORMONITORINGWATERPIPECONDITION
A. Corrosion Rate Sensor
Corrosion rate sensor uses the electrical resistance (ER) technique, which is one of the most widely used methods to measure metal loss due to corrosion [4]. An exposed ferric element in the ground will experience metal loss due to corrosion and consequently see a change (increase) in its electrical resistivity. The ER method compares this change to a sealed reference element [5]. The probe is typically placed in close proximity to the exposed element of interest so that this element is subjected to exactly the same temperature as the reference element (metal resistivity is affected by temperature).
Fig. 2. Corrosion rate sensor made from pipe coupon.
It is not practical to use an entire pipe as the exposed element. Consequently, a coupon from the pipe of interest (or a coupon of the same type of material) is used (Fig. 2). This type of probe can also measure the effectiveness of pipe cathodic protection by measuring the metal loss (in terms of electrical resistivity) of a coupon that is cathodically protected. The exposed element doesn’t need to be a metal coupon. When the soil resistivity relative to reference element is concerned, the coupon can also use the soil in the vicinity of a structure (pipe) of interest. It should be noted, however, that pipes rarely corrode in a uniform manner due to material heterogeneity and soil variability. Therefore, a single sensor is not likely to provide a good representation for the condition of long pipes.
B. Acoustic Emission Sensor
Acoustic emission testing is based on the detection of sound waves generated from within the material itself (e.g., when a crack propagates). The monitoring sensors are placed in or on the pipe to monitor acoustic activity. Signals obtained by the monitors are typically compared to a library of acoustic signatures of known events (e.g., a wire break in PCCP) to identify activities. The sensors used for acoustic monitoring include [6]:
• Hydrophone arrays: multiple hydrophones are mounted on a cable with specific spacing.
• Hydrophone station: single hydrophones are inserted into the water flow at convenient locations.
• Surface mounted sensor: piezoelectric sensors are placed on the surface of the pipe or appurtenances along the pipe.
• Fiber optic sensor: long jacketed cable containing glass fiber sensor is inserted into the pipe.
• MEMS (Micro-Electro-Mechanical Systems) acoustic emission sensor: four resonant sensors of frequency range 100 to
500kHz are integrated on a 5 mm square chip [7].
• Wire-guided transducer: wire-guided transducer uses a steel wire to acoustically couple a piezoceramic wafer to a test
structure [8].
The two important variables for acoustic monitoring are sensor spacing and monitoring duration. The acoustic sensor should be spaced close enough to ensure two sensors detect the acoustic event and have sufficient acoustic information to identify the source. Short-term monitoring entails placement of temporary acoustic sensors while the long-term monitoring involves permanent installation.
C. Magnetostrictive Sensor
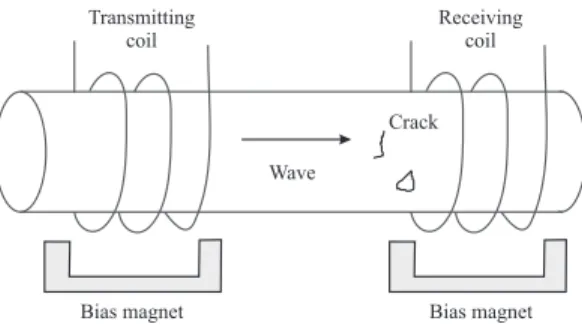
Magnetostrictive sensor (MsS) is based on the principles of magnetostrictive (Joule) and inverse-magnetostrictive (Villari) effects [9], [10], [11]. The magnetostrictive effect refers to a small change in the physical dimension of ferromagnetic materials caused by an externally applied magnetic field. The inverse-magnetostrictive effect refers to the change in the magnetic induction of ferromagnetic material caused by mechanical stress or strain. The generation and detection of guided waves are based on the Joule and Villari effect, respectively.
MsS typically consists of a coil and bias magnet (Fig. 3). A short-duration pulse is sent to the transmitting coil. The coil applies a time-varying magnetic field to the strand pipe that generates an elastic wave pulse [12]. The generated waves propagate along the pipe in both directions. When the wave passes by the receiving coil, the magnetic induction changes and
Fig. 3. Principle of magnetostrictive sensor.
an electric voltage signal is induced. This signal is then amplified, filtered, and digitized. The pipe under testing needs to be in a magnetized state, achieved by applying either a direct current electromagnet or a permanent magnet, which is different from the bias magnet in Fig. 3.
The MsS can be implemented in two modes: survey mode and monitoring mode. With the survey mode, the MsS strips are temporarily attached to a de-insulated pipe. Both inside diameter/outside diameter (ID/OD) defects and circumferential cracks (> 2% cross-sectional area) can be detected. Once complete, the strips are removed and the pipe section is reinsulated. With the monitoring mode, the MsS strips are permanently bonded to the pipe OD using epoxy-based compounds and protected by a sealed clamshell cover. The survey mode is suitable for aboveground pipes while monitoring mode is primarily for underground pipes. The MsR probe can be permanently installed on a pipe for long-term monitoring of condition changes [13]. However, the application of MsS to monitor bitumen-coat pipe and buried pipe is currently limited due to the high signal magnitude attenuation caused by the coating or surrounding soil. Thus, the MsS-based monitoring can be applied in benign, relatively low-attenuation sections of pipelines [13].
D. Conformable & Flexible Eddy Current Array
The principle of the conformable eddy current sensor array is the same as that of traditional eddy current-based devices, i.e., the change of coil impedance (phase and magnitude) reflects the properties of the conducting object under test. For pipe pitting measurement, the displacement between the eddy current probe and bottom of the pit can be detected by the probe [14]. The conformable array was designed to transform discrete measurements into a two-dimensional scan (image). A similar technology was reported by [15]. The conformable array can be easily adapted to the surface curvature of pipes, however, this entails excavation and cleaning to expose the bare pipe.
E. Flexible Ultrasonic Transducer (FUT)
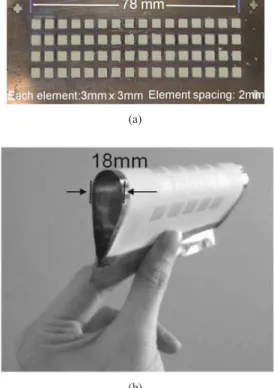
The FUT consists of a metal foil, a piezoelectric ceramic film, and a top electrode. The porosity of piezoelectric film and the thickness of metal foil provide this sensor with sufficient flexibility for application to curved and irregular surfaces (Fig. 4). Such FUT can be easily formed into an array by spraying many electrodes into a desired configuration.
This type of transducer operates in the pulse-echo (i.e., the subject of interest needs to be excited by an external source of energy) transmission and pitch-catch modes. It can be used in a phased array configuration for fast electronic scanning and imaging.
F. Guided Wave Sensor
Guided wave ultrasonic testing (GWUT) has been widely applied for rapid screening of long lengths of pipework for corrosion and other defects [16]. The GWUT employs mechanical stress waves that propagate along an elongated structure
while guided by object’s boundaries. The GWUT is operated at a low frequency (between 10− 100kH z) and uses a removable
transducer ring to gain temporary access to the pipe[17]. To reduce the re-excavation costs, transducer ring can be installed permanently for continuous monitoring so that only one time access is needed [18], [19].This is known as guided wave permanently installed monitoring system (gPIMS) [18], [17]. The transducer is produced as a low profile flexible array, which can be bonded and clamped in place on the pipe surface [17]. Then, the transducer is sealed in a polyurethane jacket to provide complete protection [17]. gPIMS enables tracking and trending signal change and allows the baseline subtraction [18]. The stability and sensitivity studies of the gPIMS demonstrates the capabilities of the system to detect circumferential distribution of wall loss, high probability of detection (POD) over a wide frequency range, and low probability of false indication [17].
G. Damage Sensor
The damage sensor uses a combination of distributed electrochemical impedance spectroscopy (EIS) and time domain reflectometry (TDR). The EIS measurement provides information about the effectiveness of a coating over a relatively small
(a)
(b)
Fig. 4. The Flexible Ultrasound Transducer Array (Reprinted with permission from NRC IMI).
area. An alternating voltage is applied between corroding material and a reference electrode. The impedance measurement reflects the condition of the pipe coating. Modeling of the EIS system can provide the location and status of flaws in the pipe. The TDR measurement sends an electromagnetic or sharp direct current pulse and analyzes the reflected signal from discontinuities. Discontinuities include pipe failure and accidental impact damage. The TDR technique can identify fault locations with high precision.
The combination of the EIS and TDR sensors takes advantage of each sensor to obtain maximum information regarding defect location and characterization. This sensor unit is still in development and has not been fully implemented yet.
H. Microwave Back-Scattering Sensor
Microwave back-scattering (MBS) sensor is based on the principle of transmitting continuous electromagnetic microwaves at a frequency of 2.45 GHz and receiving back-scattered signals [20]. It detects nonhomogeneities in terms of dielectricity, such as holes caused by erosion and humidity changes due to leaking water. The inspection with a MBS sensor needs to be carried out from the inside of the pipe [20].
The MBS sensor consists of four transmission patch antennae and four staggered receiving patch antennae. The whole inner surface of the pipe is covered. The absolute amplitude and relative phase for each signal channel are processed to characterize the detected anomalies.
I. Fiber Optic Sensor
1) Fiber Optic Sensor for Corrosion Monitoring: Changes in pipe wall thickness lead to change of the outer surface strain
(for a given stress level). The fiber optic sensor monitors and records changes in strain. The wall thickness is then derived from this measurement.
Three fiber optic sensors are needed to calculate pipe wall thickness. One is used to measure the strain due to wall thinning that depends on the internal pressure. The other two sensors compensate for the operational variation in temperature and pressure. The sensitivity of the system depends on wall thickness, pressure, and pipe materials, but can be as high as 50.8 microns as reported in [21]. Up to eight fiber optic sensors can work simultaneously with one monitoring unit. Monitoring units can also be networked together, making remote access possible. The client can access real-time data over a web-based application. Portable instrumentation that is battery powered is also available.
These fiber optic sensors can also be designed to measure pipe bending due to ground movement [22]. Linear and coiled fiber optic sensors were designed and used for monitoring gas transmission pipes.
2) Fiber Optic Acoustic Monitoring Sensor: Acoustic fiber optic (AFO) cable is installed inside a PCCP main and is
connected to a laser light source as a data acquisition system. Light is projected through the AFO cable. When there is only ambient noise in the pipe, the reflected light is relatively constant and the resulting signal does not have a significant dynamic component. When a wire break occurs in the pipe, the sudden strain energy release generates pressure waves that act on the AFO cable. A dynamic pattern of light is obtained and can be used to evaluate the acoustic properties of the event. Frequency, acoustic magnitude, attenuation characteristics, and other acoustic variables are analyzed to determine when and where the wire break occurred [6].
The AFO cable may consist of four or more long continuous glass fibers. These fibers, together with a strength fiber that provides strength to resist tension, are encased in a protective jacket. The monitoring results for each pipe section are available on a secure Web site, where the pipes are mapped on Google Earth for easy identification [6].
III. WIRELESSSENSORNETWORK FORPIPECONDITIONMONITORING
When multiple wireless sensors are grouped to monitor large physical environments cooperatively, these sensors form a wireless sensor network (WSN) [23]. In the WSN, sensors can communicate with each other as well as the base station, to disseminate sensory data for processing, visualization, analysis, and storage. In [24], micro-electro-Mechanical Systems (MEMS) sensors were connected through a wireless network to measure the acceleration change at the pipe surface. The basic principle is that a sharp transient change in hydraulic (water) head in the pipe flow induces a correspondingly sharp change in the acceleration of pipe vibration on the pipe surface. The inverse analysis can locate the damage in a pipe segment between two neighboring sensors. Accelerometers H34C and SD-1221 made with MEMS technology were integrated with two sensor units respectively [24]. Three-axial vibration data were collected. The change in the water pressure due to pipe damage could be identified by the change in acceleration on the pipe surface. However, the algorithm to locate the damage through the captured transient signal has not been completely developed yet.
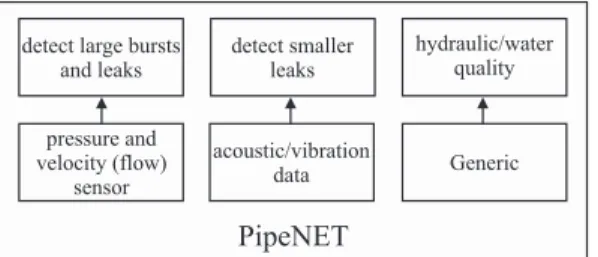
Fig. 5. The system architecture of PipeNET.
A prototype WSN system named PipeNET was described in [25]. The architecture of this system is illustrated in Fig. 5. Piezoresistive silicon sensors were used to measure the pressure. Acoustic/vibration data were collected by accelerometers installed along the pipe. The third function block included a different set of applications such as monitoring water quality in transmission and distribution water systems, or monitoring the water level in sewer collection systems. The WSN can increase the spatial and temporal resolution of operational data from pipeline infrastructure and implement near real-time monitoring and control.
IV. MULTI-SENSORTECHNIQUES
A. Multi-Sensor System
Any individual non-destructive inspection technique may not be able to fully characterize the condition of pipes. Multi-sensor technologies incorporate multiple sensors for a comprehensive pipe inspection and assessment. This approach encompasses two aspects. One is the sensor selection; the other is the sensor data fusion. The choice of sensors depends on the particular requirements of an application. Sensor data fusion algorithms exist (or sometimes need to be developed) to process the signals acquired by heterogeneous sensors. A multi-sensor experimental platform called sewer assessment with multi-sensors was developed with the support of the German Research Foundation and include [26]:
• Optical triangulation sensor: optical 3D measurement of a sewer pipe;
• Microwave sensor: inspect the soil state behind sewerage pipes;
• Geoelectrical sensor: detect leak points;
• Hydrochemical sensor: detect groundwater infiltration;
• Radioactive sensor (neutron and gamma ray probes): investigate soil density and soil moisture content;
• Acoustic systems: detect leaks, cracks and determine the state of connections and pipe bedding.
The basic steps included sensor data acquisition, signal processing, feature extraction, data fusion and diagnosis. A fuzzy logic based sensor fusion algorithm was implemented. However, the report on the overall performance is not available.
Fig. 6. The implementation of sensor data fusion.
The modern closed-circuit television (CCTV) system may employ digital camera, laser, and sonar profiling techniques for pipe and sewer wall inspection. These inspections may provide complementary, competitive, and/or cooperative information. How to take advantage of the multi-modal inspection still remains a topic for future research and development work.
B. Sensor Data Fusion
The data acquired by multiple sensors need to be synchronized or registered so that the correspondences between the data type can be established. This is the first step in processing multi-sensor data. Data fusion can be implemented at three levels, i.e. sensor level, feature level, and decision level as illustrated in Fig. 6. At the lowest (sensor) level, the fusion operation combines information from multiple sensors to validate signals and create features. At a higher level, fusion operation combines derived features to obtain the diagnostic information. At the highest level, fusion incorporates experience-based information or physical model predictions with signal-based information to facilitate the decision making process. Fusion architectures vary among different applications.
As shown in Fig. 6, fused features are interpreted to provide health status of the monitored objects. The extracted sensor information is subsequently used as input to data-driven and/or physics-based models. Model parameters can be updated and tuned using this sensor information. Furthermore, as both models and sensors are imperfect, it is necessary to use the information from models and sensors to dynamically adjust predictions, which is expressed in terms of the health condition at a future point, or a time to reach a specified health condition [1]. The fusion of information from sensors and models is presented as the probability of failure as a function of time and usage. However, the application of sensor fusion to pipe condition assessment has not been fully exploited yet and not much literature is available.
V. SUMMARY
Currently, most structural and mechanical system maintenance is carried out in a time-based mode. The time-based mainte-nance philosophy is now evolving to a more cost effective condition-based maintemainte-nance (CBM) philosophy. Sensor technologies play an important role in CBM. Varied sensors have been applied to all kinds of civil applications, such as bridges and buildings. However, the use of sensor for water pipes is still limited. The applicability of the technologies to buried pipes described in this paper has not yet been fully verified. Currently, acquisition of high-cost data is justified only for major transmission water mains, where the consequences of failure are significant. Pipes with low cost of failure do not justify expensive data acquisition campaigns. Another issue that requires attention is the lack of full understanding of sensor reliability. Low cost and reliability are the most important factors in development and adaptation of sensors to buried pipes.
ACKNOWLEDGMENT
This work was supported by National Research Council (NRC) Canada and US EPA (Environmental Protection Agency) through Battelle. The authors are grateful to the valuable discussions with Dr. Balvant Rajani, Dr. Osama Hunaidi and Mr. Alex Wang from NRC.
REFERENCES
[1] J. M. Papazian, E. L. Anagnostou, S. J. Engel, D. Hoitsma, J. Madsen, R. P. Silberstein, G. Welsh, and J. B. Whiteside, “A structural integrity prognosis system,” Engineering Fracture Mechanics, vol. 76, no. 5, pp. 620–632, March 2009.
[2] C. R. Farrar, S. W. Doebling, and D. A. Nix, “Vibrationbased structural damage identification,” Philosophical Transactions of the Royal Society of
London. Series A: Mathematical, Physical and Engineering Sciences, vol. 359, no. 1778, pp. 131–149, January 2001.
[3] C. R. Farrar and K. Worden, “An introduction to structural health monitoring,” Royal Society of London Transactions Series A, vol. 365, no. 1851, pp. 303–315, February 2007.
[4] G. E. C. Bell and C. G. Moore, “Development and application of ductile iron pipe electrical resistance probes for monitoring underground external pipeline corrosion,” in Recent Development and Field Experience in Corrosion and Erosion Monitoring. NACE International, 2007.
[5] H. A. Khan, “Using coupons and er soil corrosion probes in applying pipeline cp criteria,” Materials Performance, pp. 26–30, 2007, using Coupons and ER Soil Corrosion Probes in Applying Pipeline CP Criteria.
[6] M. S. Higgins and P. Paulson, “Fiber optic sensor for acoustic monitoring of pccp,” in Proceedings of the Pipeline Division Specialty Conference: Service
to the Owner, Chicago, Illinois, USA, 2006.
[7] D. W. Grevea, I. J. Oppenheim, A. P. Wright, and W. Wua, “Design and testing of a mems acoustic emission sensor system,” in SPIE Smart Structures/NDE
Joint Conference, San Diego, USA, 2008.
[8] I. T. Neilla, I. J. Oppenheima, and D. W. Greveb, “A wire-guided transducer for acoustic emission sensing,” in SPIE Smart Structures/NDE Joint
Conference, San Diego, USA, 2007.
[9] H. Kwun, “Back in style: Magnetostrictive sensors,” 1991, http://www.swri.org/3pubs/brochure/d17/magneto/magneto.htm. [10] ——, “Technical background on mss,” Southweat Research Institute, Tech. Rep., 2000.
[11] H. Kwun, S. Kim, and G. M. Light, “The magnetrostrictive sensor technology for long range guided wave testing and monitoring of structures,” Materials
Evaluation, vol. 61, pp. 80–84, 2003, the Magnetrostrictive Sensor Technology for Long Range Guided Wave Testing and Monitoring of Structures.
[12] K. A. Bartels, C. Dynes, Y. Lu, and H. Kwun, “Evaluation of concrete reinforcements using magnetostrictive sensors,” in SPIE Conference on
Nondestructive Evaluation of Bridges and Highways III. Newport Beach, CA, USA: SPIE, 1999.
[13] G. M. Light, S. Y. Kim, R. L. Spinks, H. Kwun, and P. C. Porter, “Monitoring technology for early detection of internal corrosion for pipeline integrity,” Southwest Research Institute, San Antonio, TX, USA, Final Technical Report DE-FC26-02NT41319, September 2003, prepared for US Department of Energy, National Energy Technology Laboratory.
[14] A. E. Crouch and T. H. Goyen, “Defect assessment using conformable array data,” Southwest Research Institute, San Antonio, USA, Tech. Rep., 2003. [15] X. Chen and T. Ding, “Flexible eddy current sensor array for proximity sensing,” Sensors and Actuators, vol. 135, pp. 126–130, 2007, flexible Eddy
Current Sensor Array for Proximity Sensing.
[16] M. J. S. Lowe and P. Cawley, “Long range guided wave inspection usage current commercial capabilities and research directions,” Department of Mechanical Engineering, Imperial College London, Technical Report, March 2006.
[17] M. Evans and K. Vine, “Permanently installed transducers for guided wave monitoring of pipelines,” in 10th
European Conference on Non-Destructive Testing, Moscow, Russia, June 2010, pp. 1–6.
[18] A. Galvagni and P. Cawley, “Guided wave permanently installed pipeline monitoring system,” in Review of Progress in Quantitative NDE, D. O. Thompson and D. E. Chimenti, Eds., vol. 31, Burlington, Vermont, USA, July 2011.
[19] S. Lebsack, “Monitoring buried pipe with permanently installed guided wave system,” in DoD Corrosion Conference, Ka Quinta, CA, USA, August 2011, pp. 1–8.
[20] R. Munser, M. RoBner, M. Hartrumpf, and H. B. Kuntze, “Microwave back-scattering sensor for the detection of hidden material inhomogeneities e.g. pipe leakages,” in 9th
International Trade Fair and Conference for Sensors, Transducers and Systems, Nuremberg, Germany, 1999.
[21] D. Morison, “Fiber-optic sensors for corrosion monitoring,” 2007, http://process.sensorsmag.com/sensorsprocess/Feature+Articles/Fiber-Optic-Sensors-for-Corrosion-Monitoring/ArticleStandard/Article/detail/466160.
[22] S. Cauchi, T. Cherpillod, D. Morison, and E. McClarty, “Fiber-optic sensors for monitoring pipe bending due to ground movement,” Pipeline & Gas
Journal, vol. January, pp. 36–40, 2007, fiber-Optic Sensors for Monitoring Pipe Bending due to Ground Movement.
[23] W. Dargie and C. Poellabauer, Fundamentals of Wireless Sensor Networks: Theory and Practice, ser. Wiley Series on Wireless Communications and Mobile Computing, X. Shen and Y. Pan, Eds. United Kingdom: John Wiley and Sons Inc., 2010.
[24] M. Shinozuka, M. Feng, and A. Mosallam, “Wireless MEMS-sensor networks for monitoring and condition assessment of lifeline systems,” in Urban
Remote Sensing Joint Event, Paris, France, April 2007.
[25] I. Stoianov, L. Nachman, and S. Madden, “Pipenet: A wireless sensor network for pipeline monitoring,” in The 6th
International Conference on Information Processing in Sensor Networks, Cambridge, Massachusetts, USA, 2007.
[26] M. Eiswirth, C. Frey, J. Herbst, A. Jacubasch, I. Held, C. Heske, H. Hotzl, H. B. Kuntze, J. Kramp, R. Munser, and L. Wolf, “Sewer assessment by multi-sensor systems,” in Proceedings of World Water Congress, Berlin, Germany, October 2001.
Zheng Liu received a doctorate in engineering from Kyoto University, Japan, in 2000. From 2000 to 2001, he was a research
fellow with the control and instrumentation division of Nanyang Technological University, Singapore. He then joined the Institute for Aerospace Research (IAR), National Research Council (NRC) Canada, Ottawa, as a governmental laboratory visiting fellow in 2001. After being with IAR for five years, he transferred to the NRC Institute for Research in Construction, where he currently holds a research officer position. He also holds an adjunct professorship at the University of Ottawa. His research interests include image/data fusion, computer vision, pattern recognition, sensor/sensor network, structural health monitoring, and nondestructive inspection and evaluation. He co-chairs the IEEE IMS TC-36. He is a senior member of the IEEE and a member of SPIE.
8
PLACE PHOTO HERE
Yehuda Kleineris the group leader of the buried utilities research group and principal research officer at National Research Council
Canada. Dr. Kleiner has been involved in developing methodologies for analysis and decision optimisation of water distribution and sewer systems rehabilitation and renewal. He has authored and co-authored many papers and reports related to these subjects, some of which evolved into public/commercial computer applications.
Prior to his current research position he has gained substantial international experience in the design, planning and analysis of urban, rural and agricultural water supply, sewage, drainage and irrigation systems, working for engineering consulting firms and equipment manufacturers. He earned his B.Sc. and M.Sc. from the Technion - Israel Institute of Technology, and his Ph.D. from University of Toronto.