HAL Id: hal-02119785
https://hal-amu.archives-ouvertes.fr/hal-02119785
Submitted on 4 Jan 2021
HAL is a multi-disciplinary open access archive for the deposit and dissemination of sci-entific research documents, whether they are pub-lished or not. The documents may come from teaching and research institutions in France or abroad, or from public or private research centers.
L’archive ouverte pluridisciplinaire HAL, est destinée au dépôt et à la diffusion de documents scientifiques de niveau recherche, publiés ou non, émanant des établissements d’enseignement et de recherche français ou étrangers, des laboratoires publics ou privés.
Distributed under a Creative Commons Attribution - NonCommercial - NoDerivatives| 4.0 International License
Hydrodynamic evaluation of gas testing chamber:
Simulation, experiment
Fatima-Ezahra Annanouch, Gilles Bouchet, Pierre Perrier, Nicolas Morati,
Christelle Reynard-Carette, Khalifa Aguir, Virginie Martini-Laithier, Marc
Bendahan
To cite this version:
Fatima-Ezahra Annanouch, Gilles Bouchet, Pierre Perrier, Nicolas Morati, Christelle Reynard-Carette, et al.. Hydrodynamic evaluation of gas testing chamber: Simulation, experiment. Sensors and Actu-ators B: Chemical, Elsevier, 2019, 290, pp.598-606. �10.1016/j.snb.2019.04.023�. �hal-02119785�
Hydrodynamic evaluation of gas testing chamber : Simulation, Experiment
Fatima-Ezahra Annanouch1, Gilles Bouchet2, Pierre Perrier2, Nicolas Morati1, Christelle Reynard-Carette1, Khalifa Aguir1, Virginie Martini-Laithier1, Marc Bendahan1,*
1
Aix Marseille Univ, Université de Toulon, CNRS, IM2NP, Marseille, France; [email protected], [email protected], [email protected]; [email protected], [email protected], [email protected]
2
Aix Marseille Univ, CNRS, IUSTI, Marseille, France; [email protected], [email protected]
* Correspondence: [email protected]; Tel.: + 33 (0)4 91 28 89 73
Abstract:
Gas concentration measurements by means of metal oxide microsensors represent a promising issue due to several advantages (size, low cost, power consumption, reliability…). However, improvements are required to increase performances of complete experimental systems including microsensor and testing chamber at least. This paper deals with the study of different size and shape configurations of gas testing chamber, by coupling 3D unsteady modelling and experiments in the case of a SnO2 sensor with ethanol gas flow. The
influence of the testing-chamber design on the gas flow hydrodynamics and on the system response is shown. A new 3D-printed prototype chamber (boat-shape design), as compared to the commonly used testing chamber (cross-shape design), leads to an increase of the dynamics, an enhancement of the gas concentration homogeneity and a significant reduction of flow recirculation and dead volumes. In this work we have shown that the optimization of the test chamber (volume and shape) makes it possible to get as close as possible to the real electrical characteristics of the sensor. Consequently thanks to these new achieved characteristics, the performances of the whole system are improved.
Keywords: Gas sensor; Gas testing chamber; Metal oxides; Tin oxide; Mathematical
modeling; gas flow simulation. *Revised Manuscript
1. Introduction
In the last few years, gas sensors attracted a great attention in numerous application fields such as environmental monitoring, industrial production and safety, medical diagnosis, military and aerospace [1–4]. These electronic devices offer a wide variety of advantages over traditional analytical instruments such as small size, easy manipulation, low costs and low power consuming [5, 6]. Metal oxides represent a very promising material for such kind of applications; they possess a broad range of electronic, chemical, and physical properties that allow them to be widely used and investigated in the detection of volatiles and other gases [7–9]. In this context, one of the most interesting metal oxide is tin oxide (SnO2), an
n-type semiconductor with a direct wide band gap 3.62 eV at 300 K [10–12], and a variety of potential applications such as transparent conducting electrodes, solar cells and most importantly in gas sensing technology [13–17]. The detection mechanism of these sensors relies on the change of the metal oxide resistance induced by absorption or desorption of gas molecules [18, 22].
Most of the published works focused on the enhancement of a sensor response by using nanostructures, catalyst nanoparticles or by the miniaturization of the transducers [20–22]. However, to develop a performing metal-oxide gas-sensor, it is essential to ensure a qualified sensor response measurement.
In addition, note that most of the chemical/physical processes (i.e. mentioned above) occurring at the sensor surface are all influenced by the testing chamber and so it influences the behavior of the sensor in terms of stability, sensitivity and reliability.
Lezzi et al. have studied the influence of gaseous species transport on the CO gas sensor responses [25]. They simulated the filling of the test chamber with CO diluted in air, and the time evolution of the CO concentration at any point inside the chamber. More recently,
Viccione et al. have modeled the fluid dynamic behavior of a sensor chamber in order to guarantee homogeneous flow conditions. The average volume fraction of the inflow gas sample nearby the sensor, the stagnant or recirculating zones were discussed as function of the chamber geometry and the injected flow rate [26].
Little efforts have been devoted to the development of optimized testing chambers. Thus, there is a need and a great demand to develop an optimized testing chamber before starting the measurements in order to improve the gas sensor responses (dynamic, amplitude and sensitivity).
In view of the complexity of the transport mechanism as well as the gas concentration diffusion inside the chambers, it is likely that a mathematical modeling will provide an important support for the design optimization studies. This design should remove dead volumes, offer a homogenous gas concentration around the sensor and reduce the gas flow velocity as well as the developments of recirculations. Moreover, the suggested model has to be confronted with experiments in order to determine the discrepancy and to validate the applied model.
This paper reports the fabrication, modeling, simulation and experiments of a new chamber design, which is compared to a classical one, used in our laboratory. Experimental studies involving the measurements by means of SnO2 sensor with ethanol gas, were performed.
2. Experimental
2.1 Gas sensors
SnO2 sensing layers (50 nm in thickness) were directly deposited by reactive radio frequency
(RF) magnetron sputtering over the microsensors platform realized at IM2NP laboratory. The substrates were cleaned with acetone and then with ethanol, dried with air, and then placed
inside the shadow mask. A metal target of 99.99% purity with a diameter of 76.2 mm and thickness of 3.18 mm was used. The temperature of the substrate was kept constant during film deposition at room temperature. The sputtering atmosphere consisted of argon (Ar) and oxygen (O2) gas mixture and the RF sputtering power was fixed to 200 W.
The morphology and structure of the obtained SnO2 films were determined by the
deposition conditions parameters and the annealing temperature. More details are found in [27].
Figure 1 depicts the microelectromechanical systems (MEMS) based microsensor platform used in this work. It was patented (patent FR 13 59494, 2013 – US20160238548A1, 2016) by our laboratory [28] and fabricated using clean room facilities and various micro-fabrication steps including photolithography, metallization and backside etching (DRIE) of the substrate to define the membrane. This latter has a size of 400 μm × 400 μm. It carries interdigitated electrodes and two heaters. The gap between the electrodes is 4 μm, the resistance of each heater is 100 Ω and the temperature coefficient is 3 10-3/K.
2.2 Testing chambers
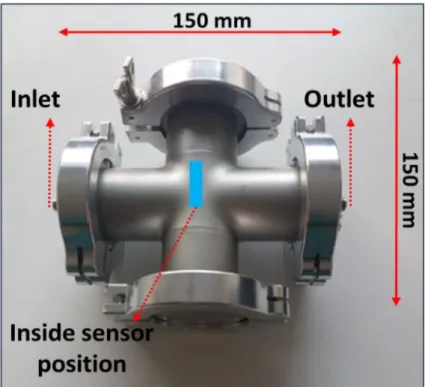
Gas-sensing tests were carried out in two different chambers. The first one called cross-shape chamber (Figure 2) was made of stainless steel with a total volume of 0.3 L and gas flow range between 0.1 L/min and 1.5 L/min. Besides, it has an inlet and an outlet, and the sensor optimal position is at the center, in front of the gas flow direction.
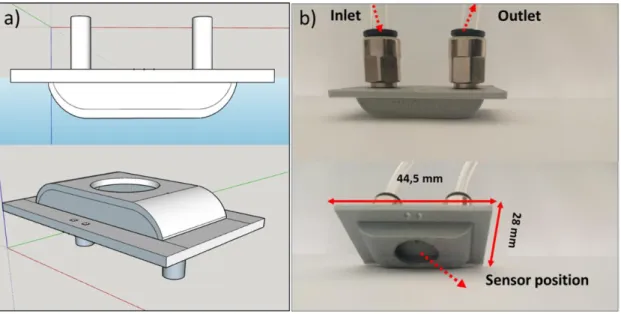
The second chamber (the new one), called boat-shape chamber, is illustrated on Figure 3. It was designed via Sketchup software (Figure 3.a) and fabricated from polylactic acid (PLA) using a 3D printing machine. The total volume was around 2.35 10-3L and the gas flow range between 0.01 L/min and 0.5 L/min. It has a boat shape (Figure 3.b) with planar inlet and
outlet. Additionally, the optimal sensor position is at the center of the boat back-side, in the same plane as the gas flow direction.
2.3 Gas sensing tests
Gas sensing tests were carried out in both testing chambers, using a continuous flow rate of 100 sccm. The sensors were exposed to different concentrations of ethanol vapor, delivered by an autonomous mass flow system, during 1 min and subsequently the chamber purged with air until the initial baseline of the resistance was recovered. The power consumption of each sensor-heater was maintained to 53 mW leading to an optimal working temperature equal to 300 °C. A Keithley 2450 source meter was used to measure the electrical resistance of the sensors. The measuring system (sensor + testing chamber) was kept inside a thermos-regulated chamber, in order to control the ambient temperature of the whole system. The sensor response was defined as R=Ra/Rg, where Ra is the sensor resistance in air at the steady state and Rg represents the sensor resistance after 1 min of the gas mixture exposure [29].
The response time was defined as the time required for the sensor to reach 90% of the sensor response, and the recovery time as the time needed to reach 10% of the initial resistance baseline after the analyte was purged [20].
3. Results and discussion
3.1 Modeling and simulation results
Modeling and simulations are essential steps to be considered during the design and optimization of the testing chamber. Due to the complexity of the gas transport mechanism, it is compulsory to determine its dynamics inside the testing chamber. This study allows us to determine what is happening at the sensor surface level, in term of gas flow velocity, gas
flow direction, gas concentration diffusion, etc. For as followed, we assume that the sensor dynamic range is very large compared to that of the flow (i. e. in relation to the temporal and spatial evolutions of the flow transporting the target gas). Additionally, we assume that the sensor does not have any influence on the nature of the gas flow. To know the velocity as well as the path of the gas flow inside the two chambers, we used the multidisciplinary STAR-CCM+ software [30], which is able to simulate complex industrial problems or physical phenomena. The flow is modeled by a finite volume method solving the 3D unsteady Navier-Stokes equations of a laminar incompressible flow, with no-slip boundary conditions everywhere, except on the inlet and outlet. The Navier-Stokes equations are expressed as the following system of equations (1,2):
(1)
(2)
where u stands for the flow velocity, p the pressure, the kinematic viscosity, the density and t the time.
The boundary conditions were fixed as an inflow in the upstream direction, and an outflow in the downstream limit of the domain. The inflow boundary condition consisted of a uniform velocity profile while the outflow condition lead to set both of the pressure and viscous stresses to zero. This outflow condition, imposed in a weak sense, authorized the disturbances to leave the domain.
The choice of the laminar flow model can be justified by the evaluation of the Reynolds number (3), which is equal to Re= 35 (for a flow rate of 100 sccm, the inlet velocity is equal to 0.13 m/s for a pipe diameter of 4 mm) and consequently much lower than the critical Reynolds number of the order of 2000 [31].
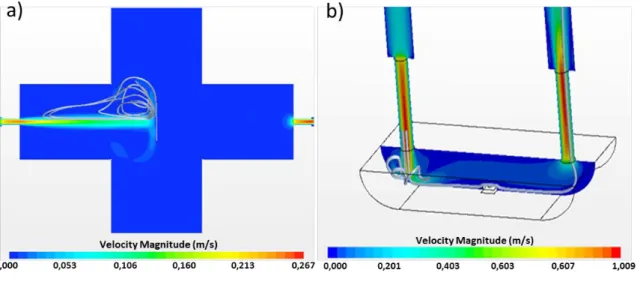
Figure 4 depicts the obtained results. In the cross chamber, the gas flow jet is introduced by the left, through a 4 mm diameter inlet pipe, and then impacted the support of the sensor (perpendicular to the gas flow direction), leading to the occurrence of a recirculation torus around the jet flow (as shown by the streamlines in Figure 4.a). The gas ejected from the torus continued flowing through the entire chamber with trajectories and/or residence times very long (due to the design and the big volume of the chamber). At the end, the gas exited from the outlet in the right side. Because of this geometry, the jet impacted the sensor surface with a high velocity around 0.1 m/s, the induced recirculations had long residence times and the presence of dead volumes limited the dynamics of the flow.
To overcome these drawbacks, the dynamics of the testing chamber must be decreased and the gas residence time should be increased. For this purpose, we suggested the boat chamber, which was already described in section 2.2. Figure 4.b shows the velocity simulation results. The velocity at the sensor surface is almost zero. There were no recirculations around the sensor except small ones produced from the sudden expansion of the flow at the entrance of the chamber (unavoidable due to encumbering). Moreover, the dead volumes and the residence times were highly reduced compared to the cross chamber. Another parameter which is important during the testing chamber conception: is the gas concentration diffusion. It allows us to know the temporal evolution of the target gas concentration at the sensor surface. Based on this information, we can get an idea about the true gas concentration detected by the sensor and its real experimental response.
For this matter, the target gas concentration was simulated by a passive scalar injected at the upstream of the test chamber. Its value can vary between 0 and 1 (in our case, the value 1 correspond to 50 ppm of ethanol). The passive scalar transport is modeled by solving a convection – diffusion equation (4).
(4) where c is the value of the passive scalar and D is the diffusion constant of ethanol in air. The resolution of the coupled Navier-Stokes and convection-diffusion equations permits us to know the ethanol concentration at any time and whatever point inside the test chamber. Therefore, the gas concentration will be followed at a point located in the center of the sensor surface.
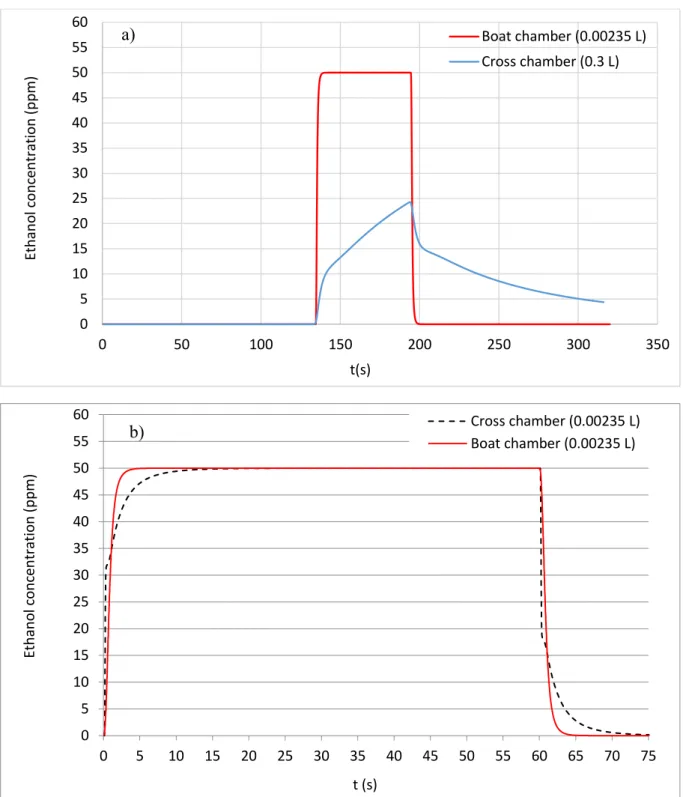
The target gas (experimentally air with 50 ppm of ethanol, numerically modeled by a passive scalar of value 1) was injected at the entrance of the computational domain (a few centimeters upstream of the entrance in the test chambers) at t = 134 s, which we can considered as the beginning of gas exposure (t = 0 s). Figure 5.a shows the evolution of the gas concentration in both chambers as a function of time.
For the cross chamber, after a short delay of 5 s due to the arrival in the test chamber and the crossing through the upstream pipe of the cross chamber, a sharp slope between t = 5 s and t = 10 s was formed, which corresponds to the convection of the passive scalar by the flow.
In this first step, the gas concentration was about 10 ppm, which can be explained by the establishment of the Poiseuille velocity profile in the circular pipe, and also by the widening of the flow inside the enormous dead volume of the chamber (sudden expansion). Beyond t = 10 s, a slower increase of the curve, towards 25 ppm of ethanol, was noticed, due to the convection of the passive scalar induced by the recirculation torus and the slow progressive filling of the cross chamber. After 60 s, we stopped the injection of the passive scalar (no more injection of ethanol): we observed then a decrease of the curve with two different slops. The first one (sharp slope), corresponds to the extinction of the passive scalar and the second one (slower slope), results from the emptying of the cross chamber (big volume and
a lot of dead volumes). For the new design model, the behavior of the passive scalar value on the sensor surface was very different from that of the cross chamber. As shown in Figure 5a, from the beginning of the injection (after the delay similar to that of the cross chamber), the ethanol concentration reached rapidly the set point value (50 ppm) in less than 2 s and remained stable throughout the injection time (60 s). After that, when the injection was stopped, the gas concentration dropped instantaneously to zero (due to the emptying of the weak volume of the boat chamber with nearly without dead volume). Thus, the new design has highly enhanced the dynamics of the filling and emptying of the chamber. Besides, the set point concentration can be attained rapidly.
As mentioned in section 2.2, the cross-chamber volume is about 100 times larger than that of the boat one. In order to verify whether chambers with equal volumes and different shapes would contribute greater to find out the dynamics of the gas flow and the optimal setups for testing sensors, we modeled the flow in a small cross-chamber (volume equal to 0.00235 L). Figure 5b depicts the obtained results. The shape effect was always present, the slope was initially greater in the case of the small cross-chamber, while the maximum concentration (50 ppm) was rapidly obtained in the case of the boat-chamber (about four times faster).
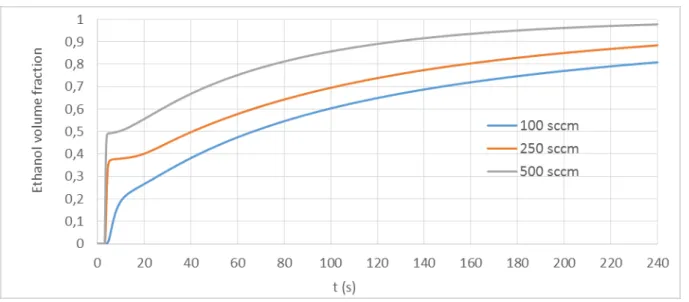
In order to achieve 50 ppm of ethanol using the cross chamber, we have increased the exposure time to 4 min and we have tested three different flow rates: 100, 250 and 500 sccm. The obtained simulation results are depicted in Figure 6. As we can observe, we need more than 4 min to reach 50 ppm of ethanol. In contrast, this time can be reduced by increasing the flow rate.
3.2 Experimental results (validation)
SnO2 thin film has been successfully deposited onto the sensor transducer, via RF magnetron
the previous section 2.1. It is worth noting that all the experimental measurements were realized by using these fabricated sensors.
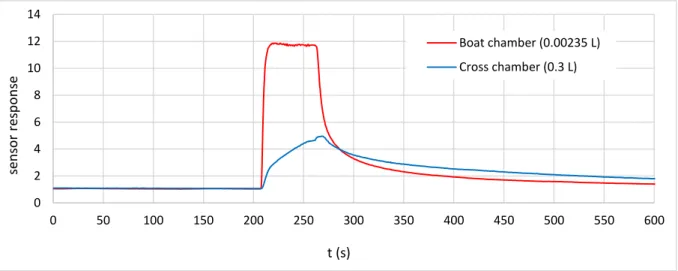
Herein, we exposed our sensor to 50 ppm of ethanol, during 60 s, using only the best and the worst configurations, respectively Boat chamber (0.00235 L) and Cross chamber (0.3 L). Figure 7 displays the sensor responses as a function of time. In the boat chamber, the responses were highly enhanced, with fast response and recovery times (4 s and 89 s, respectively). In contrast, in the cross chamber, the sensor dynamics were undoubtedly hided by the dynamics of the flow. Additionally, the response and recovery times were five times higher than those of the boat chamber.
Based on the simulation results (Figure 5), it is clear that the sensor followed the gas concentration diffusion behavior inside the chambers. Indeed, in the boat one, the responses were corresponding to 50 ppm of ethanol, however in the cross one, the responses were answering to only 25 ppm of ethanol, due to the effects of the size and the design of the chamber. In this case, it would take more than 10 minutes to reach the 50 ppm target.
Thus, there is a good accordance between the experimental and the simulations results, which successfully validates the proposed boat-shaped chamber model.
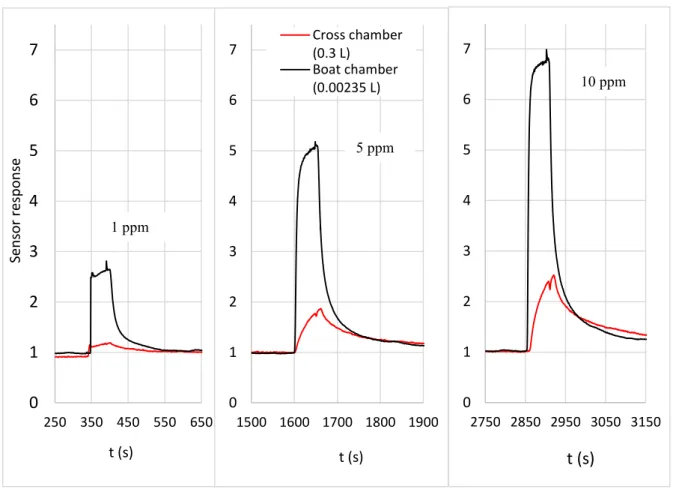
Figure 8 displays the sensor responses for three different concentrations of ethanol ranging from 1 ppm to 10 ppm, as a function of time, in both chambers. From these results, it is evident that using the new design, the sensor responses are better (higher amplitude/value) whatever the tested concentration. This allows us to quantify smaller concentrations of ethanol with higher sensitivities and faster responses. Besides, these results demonstrated how much the testing chamber can influence the sensor behavior and its metrological characteristics (response amplitude, response time, sensitivity, detection limit).
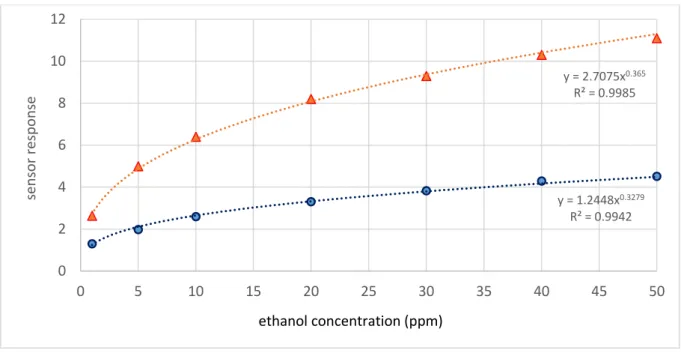
Figure 9 shows the sensor response as a function of ethanol concentration in the range of 1 to 50ppm. The responses follow a power function behavior which is common for semiconductors metal oxide gas sensors. Indeed, when the concentration is increased, the response curves toward the x abscissa direction. For the boat chamber, the sensor responses increased from 2.7 to 11, for an interval of concentration ranging from 1 ppm to 50 ppm of ethanol. In contrast, a small change of the response was seen in the case of a cross chamber (i.e. from 1.2 to 4.5). These results are in agreement with the hydrodynamic model discussed previously. Indeed, in the case of the cross chamber, hydrodynamics can only achieve about 50% of the injected concentration.
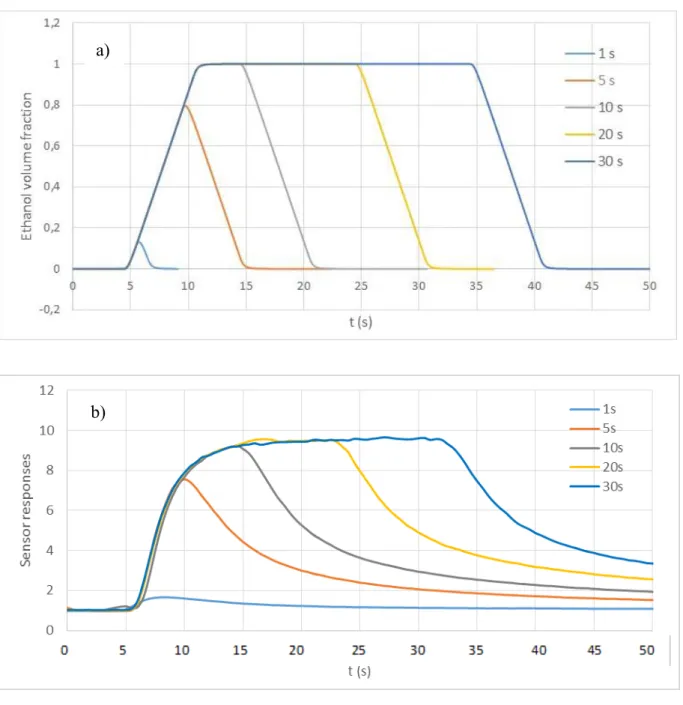
We have exposed our sensor towards 25 ppm of ethanol inside the boat chamber, using different injection times of 1 s, 5 s, 10 s, 20 s and 30 s. In parallel, we have modeled these injections using the boat chamber model (to be closer to the experimental conditions, we replaced the Heaviside function for the introduction of the passive scalar by a slope of few seconds to reach the maximum). The obtained results are depicted in Figure 10. Clearly, there is a good agreement between the proposed chamber model and the real sensor responses towards different ethanol exposure times. The dynamics of the gas transport coordinates very well with the real behavior of the sensor. It is worth noting that the sensor reached the steady state after 10 s of exposure. Consequently, with the boat chamber, the exposure time could be decreased.
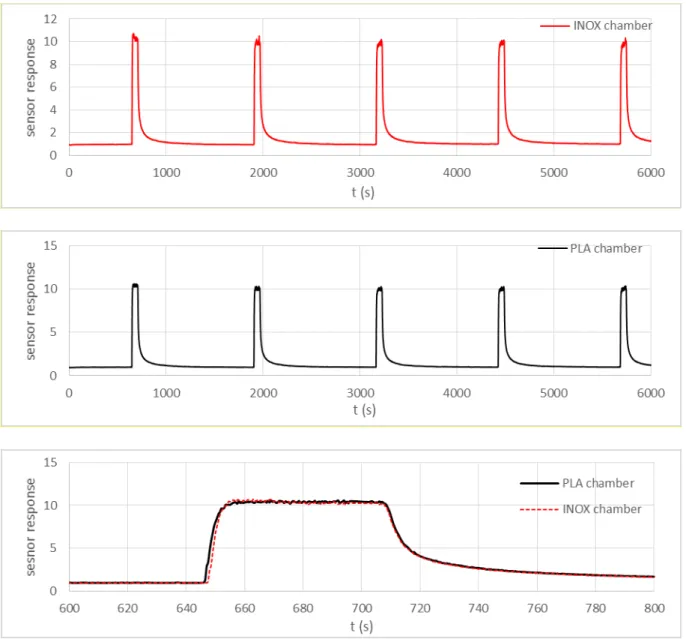
As it is mentioned before in section 2.2, the boat chamber was fabricated from PLA using the three-dimensional printing machine. In order to study the PLA walls adsorption effect on the gas sensor responses, we have realized a second chamber, from stainless steel (INOX), with similar design and dimensions. After that, we have carried out measurements with the same sensor in both chambers (PLA and INOX) using 25 ppm of ethanol during 1 min. Figure 11
depicts the obtained results. We can observe that there is no difference between the obtained curves. We have exactly identical response amplitudes with similar response and recovery slopes. Thus, the adsorption and desorption phenomena at the PLA test chamber walls seem negligible and do not affect the sensor response. Despites, it is worth noting the excellent repeatability of the sensor responses.
4. Conclusion
In this work, we showed how the testing chamber design can affect the real behavior of the gas sensor. We proceeded by using two different approaches: numerical and experimental. In the first one, we demonstrated that the cross chamber suffered from many defects such as the presence of recirculations, a lot of dead zones and the perpendicular position of the sensor with respect to the flow, which hided the real sensor response. Moreover, we founded that the new design (boat chamber) solved all these problems and increased a lot the chamber dynamics.
In the second approach, we observed a good accordance between the numerical and the experimental results. The sensor showed excellent results using the boat chamber in contrary to the cross one. The sensor detected very small concentrations of ethanol (1 ppm) with good sensitivity, the detection limits shifted toward ppb level and the response and recovery times were highly fast (4 s and 89 s, respectively). Finally, we demonstrated that the adsorption and desorption phenomena at the PLA test chamber walls seem negligible and do not affect the sensor response.
Acknowledgments: The authors would like to acknowledge NANOZ, a company specialized
regional economic development associated with innovation and Mr. T. FIORIDO for his technical support.
Conflicts of Interest: The authors declare no conflict of interest.
Corresponding author: Prof. Marc Bendahan, [email protected];
Tel.: + 33 (0)4 91 28 91 55
References
[1] E. Gobbi, M. Falasconi, G. Zambotti, V. Sberveglieri, A. Pulvirenti, G. Sberveglieri, Rapid diagnosis of Enterobacteriaceae in vegetable soups by a metal oxide sensor based electronic nose, Sens. Actuators B: Chem. 207 (2015) pp. 1104–1113.
[2] V. Galstyan, Porous TiO2-Based Gas Sensors for Cyber Chemical Systems to Provide
Security and Medical Diagnosis, Sensors. 17 (2017). doi:10.3390/s17122947.
[3] A. Kaushik, R. Kumar, S.K. Arya, M. Nair, B.D. Malhotra, S. Bhansali, Organic–Inorganic Hybrid Nanocomposite-Based Gas Sensors for Environmental Monitoring, Chem. Rev. 115 (2015) pp. 4571–4606.
[4] E. Singh, M. Meyyappan, H.S. Nalwa, Flexible Graphene-Based Wearable Gas and Chemical Sensors, ACS Appl. Mater. Interfaces. 9 (2017) pp. 34544–34586.
[5] O. Pummakarnchana, N. Tripathi, J. Dutta, Air pollution monitoring and GIS modeling: a new use of nanotechnology based solid state gas sensors, Sci. Technol. Adv. Mater. 6 (2005) p. 251.
[6] C. Wongchoosuk, A. Wisitsoraat, A. Tuantranont, T. Kerdcharoen, Portable electronic nose based on carbon nanotube-SnO2 gas sensors and its application for detection of
methanol contamination in whiskeys, Sens. Actuators B: Chem. 147 (2010) pp. 392– 399.
[7] A. Mirzaei, S.G. Leonardi, G. Neri, Detection of hazardous volatile organic compounds (VOCs) by metal oxide nanostructures-based gas sensors: A review, Ceram. Int. 42 (2016) pp. 15119–15141.
[8] N. Yamazoe, N. Miura, Environmental gas sensing, Sens. Actuators B: Chem. 20 (1994) pp. 95–102.
[9] D.R. Miller, S.A. Akbar, P.A. Morris, Nanoscale metal oxide-based heterojunctions for gas sensing: A review, Sens. Actuators B: Chem. 204 (2014) pp. 250–272.
[10] A.V. Marikutsa, M.N. Rumyantseva, A.M. Gaskov, A.M. Samoylov, Nanocrystalline tin dioxide: Basics in relation with gas sensing phenomena. Part I. Physical and chemical properties and sensor signal formation, Inorg. Mater. 51 (2015) pp. 1329–1347.
[11] A. Esmaeili-Bafghi-Karimabad, D. Ghanbari, M. Salavati-Niasari, L. Nejati-Moghadam, S. Gholamrezaei, Photo-catalyst tin dioxide: synthesis and characterization different morphologies of SnO2 nanostructures and nanocomposites, J. Mater. Sci. Mater. El. 26
(2015) pp. 6970–6978.
[12] S. Vallejos, S. Selina, F.E. Annanouch, I. Gràcia, E. Llobet, C. Blackman, Aerosol assisted chemical vapour deposition of gas sensitive SnO2 and Au-functionalised SnO2 nanorods
[13] A. Behrendt, C. Friedenberger, T. Gahlmann, S. Trost, T. Becker, K. Zilberberg, A. Polywka, P. Görrn, T. Riedl, Highly Robust Transparent and Conductive Gas Diffusion Barriers Based on Tin Oxide, Adv. Mater. 27 (2015) pp. 5961–5967.
[14] W. Ke, G. Fang, Q. Liu, L. Xiong, P. Qin, H. Tao, J. Wang, H. Lei, B. Li, J. Wan, G. Yang, Y. Yan, Low-Temperature Solution-Processed Tin Oxide as an Alternative Electron Transporting Layer for Efficient Perovskite Solar Cells, J. Am. Chem. Soc. 137 (2015) pp. 6730–6733.
[15] C. Wang, D. Zhao, C.R. Grice, W. Liao, Y. Yu, A. Cimaroli, N. Shrestha, P.J. Roland, J. Chen, Z. Yu, P. Liu, N. Cheng, R.J. Ellingson, X. Zhao, Y. Yan, Low-temperature plasma-enhanced atomic layer deposition of tin oxide electron selective layers for highly efficient planar perovskite solar cells, J. Mater. Chem. A. 4 (2016) pp. 12080–12087. [16] D. Zhang, Y. Sun, C. Jiang, Y. Zhang, Room temperature hydrogen gas sensor based on
palladium decorated tin oxide/molybdenum disulfide ternary hybrid via hydrothermal route, Sens. Actuators B: Chem. 242 (2017) pp. 15–24.
[17] Y. Xiao, Q. Yang, Z. Wang, R. Zhang, Y. Gao, P. Sun, Y. Sun, G. Lu, Improvement of NO2
gas sensing performance based on discoid tin oxide modified by reduced graphene oxide, Sens. Actuators B: Chem. 227 (2016) pp. 419–426.
[18] S. Das, V. Jayaraman, SnO2: A comprehensive review on structures and gas sensors,
Prog. Mater. Sci. 66 (2014) pp. 112–255.
[19] F.E. Annanouch, Z. Haddi, M. Ling, F. Di Maggio, S. Vallejos, T. Vilic, Y. Zhu, T. Shujah, P. Umek, C. Bittencourt, C. Blackman, E. Llobet, Aerosol-Assisted CVD-Grown PdO Nanoparticle-Decorated Tungsten Oxide Nanoneedles Extremely Sensitive and Selective to Hydrogen, ACS Appl. Mater. Interfaces. 8 (2016) pp. 10413–10421.
[20] F.E. Annanouch, Z. Haddi, S. Vallejos, P. Umek, P. Guttmann, C. Bittencourt, E. Llobet, Aerosol-Assisted CVD-Grown WO3 Nanoneedles Decorated with Copper Oxide
Nanoparticles for the Selective and Humidity-Resilient Detection of H2S, ACS Appl.
Mater. Interfaces. 7 (2015) pp. 6842–6851.
[21] J. Zhang, X. Liu, G. Neri, N. Pinna, Nanostructured Materials for Room-Temperature Gas Sensors, Adv. Mater. 28 (2016) pp. 795–831.
[22] C. Roman, C. Hierold, Micro and nano transducers for autonomous sensing applications, in: 2017 Joint International EUROSOI Workshop and International Conference on Ultimate Integration on Silicon (EUROSOI-ULIS), 2017: pp. 17–18. doi:10.1109/ULIS.2017.7962589.
[23] M.R. Alenezi, S.J. Henley, N.G. Emerson, S.R.P. Silva, From 1D and 2D ZnO nanostructures to 3D hierarchical structures with enhanced gas sensing properties, Nanoscale. 6 (2014) pp. 235–247.
[24] S. Vallejos, P. Umek, T. Stoycheva, F. Annanouch, E. Llobet, X. Correig, P. De Marco, C. Bittencourt, C. Blackman, Single-Step Deposition of Au- and Pt-Nanoparticle-Functionalized Tungsten Oxide Nanoneedles Synthesized Via Aerosol-Assisted CVD, and Used for Fabrication of Selective Gas Microsensor Arrays, Adv. Funct. Mater. 23 (2013) pp. 1313–1322.
[25] A.M. Lezzi, G.P. Beretta, E. Comini, G. Faglia, G. Galli, G. Sberveglieri, Influence of gaseous species transport on the response of solid state gas sensors within enclosures, Sens. Actuators B: Chem. 78 (2001), pp. 144-150.
[26] Giacomo Viccione, Daniele Spiniello, Tiziano Zarra, Vincenzo Naddeo, Fluid Dynamic Simulation of Odour Measurement Chamber, Chemical Engineering Transactions, Vol. 40, (2014), pp. 109 114 ; doi: 10.3303/CET1440019
[27] Latevi Lawson-gadayiglo ; New approach to non-invasive monitoring of alcohol by perspiration using MOX multi-sensors, Thesis of Aix-Marseille University, 13/12/2018 [28] M. Othman, C. Théron, M. Bendahan, L. Caillat, C. Rivron, S. Bernardini, G. Le Chevallier,
E. Chevallier, M.-P. Som, K. Aguir, T.-H. Tran-Thi, Efficiency of new ozone filters for NO2
sensing and air depollution, Sens. Actuators B: Chem. 265 (2018) pp. 591–599.
[29] T. Stoycheva, F.E. Annanouch, I. Gràcia, E. Llobet, C. Blackman, X. Correig, S. Vallejos, Micromachined gas sensors based on tungsten oxide nanoneedles directly integrated via aerosol assisted CVD, Sens. Actuators B: Chem. 198 (2014) pp. 210–218.
[30] Y. Fulpagare, Y. Joshi, A. Bhargav, Rack level transient CFD modeling of data center, Int. Jnl. of Num. Meth. for HFF. 28 (2018) pp. 381–394.
[31] S. Rouvreau, L. David, D. Calluaud, P. Joulain, Laminar junction flow at low Reynolds number: influence of the upstream region on the comparison between experiments and calculations, Comptes Rendus Mécanique. 333 (2005) pp. 265–272. doi:10.1016/j.crme.2004.11.010.
Figure. 1. MEMS-based microsensor platform (patent FR 13 59494, 2013 – US20160238548A1, 2016) Figure(s)
Figure 5. Ethanol concentration simulation with an injection of 50 ppm during 60 s in a) Boat chamber (0.00235 L) and Cross chamber (0.3 L)
b) Boat chamber (0.00235 L) and Cross chamber (0.0.00235 L) 0 5 10 15 20 25 30 35 40 45 50 55 60 0 50 100 150 200 250 300 350 Et ha no l c o nc ent rat io n (pp m ) t(s) Boat chamber (0.00235 L) Cross chamber (0.3 L) 0 5 10 15 20 25 30 35 40 45 50 55 60 0 5 10 15 20 25 30 35 40 45 50 55 60 65 70 75 Et ha no l c o nc ent rat io n (pp m ) t (s) Cross chamber (0.00235 L) Boat chamber (0.00235 L) a) b)
Figure 6. Ethanol volume fraction (set up ethanol concentration/ real ethanol concentration) simulation in the cross chamber (0.3 L) versus time injection for different gas flows: 100-250-500 sccm
Figure 7. Experimental gas sensor responses toward 50 ppm of ethanol with an injection duration of 60 s, using both chambers 0 2 4 6 8 10 12 14 0 50 100 150 200 250 300 350 400 450 500 550 600 se n so r re sp o n se t (s) Boat chamber (0.00235 L) Cross chamber (0.3 L)
Figure 8. Temporal gas sensor responses for three tested concentrations of ethanol (1, 5, 10 ppm) by using both chambers 0 1 2 3 4 5 6 7 250 350 450 550 650 Sens o r resp o ns e t (s) 0 1 2 3 4 5 6 7 1500 1600 1700 1800 1900 t (s) Cross chamber (0.3 L) Boat chamber (0.00235 L) 0 1 2 3 4 5 6 7 2750 2850 2950 3050 3150 t (s) 10 ppm 5 ppm 1 ppm
Figure 9. Gas sensor responses versus ethanol concentration for the two geometry chambers for an injection duration of 60 s y = 1.2448x0.3279 R² = 0.9942 y = 2.7075x0.365 R² = 0.9985 0 2 4 6 8 10 12 0 5 10 15 20 25 30 35 40 45 50 sens o r resp o ns e ethanol concentration (ppm)
Figure 10. Simulation results of ethanol concentration on time (with a slope of passive scalar until 1) inside the
boat chamber (a) and experimental sensor response toward the same ethanol concentration of 25 ppm (b), using boat chamber and different exposure times
a)
Highlights
The influence of the testing chamber design on a gas sensor response
Modeling and simulation of the gas transport mechanism inside a testing chamber for gas characterization.
Modeling of a gas flow by a finite volume method solving the 3D unsteady Navier-Stokes equations
High sensitive SnO2 ethanol sensor *Research Highlights