Impact assessment case study of phytosanitary measures for the risk mitigation system against the spread of fruit fly in Argentina
49
0
0
Texte intégral
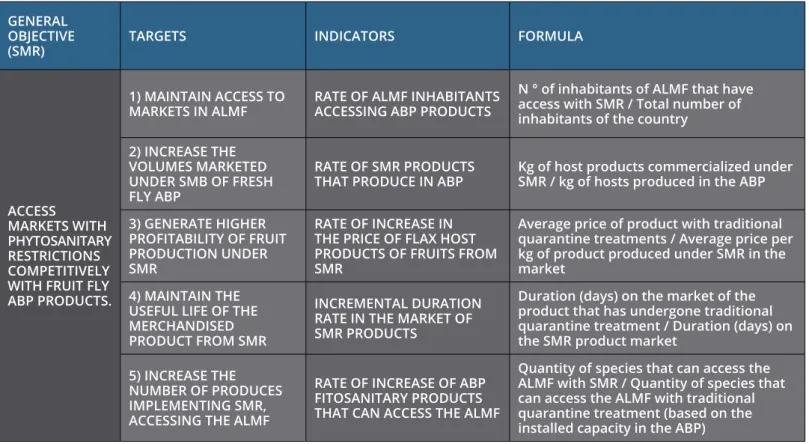
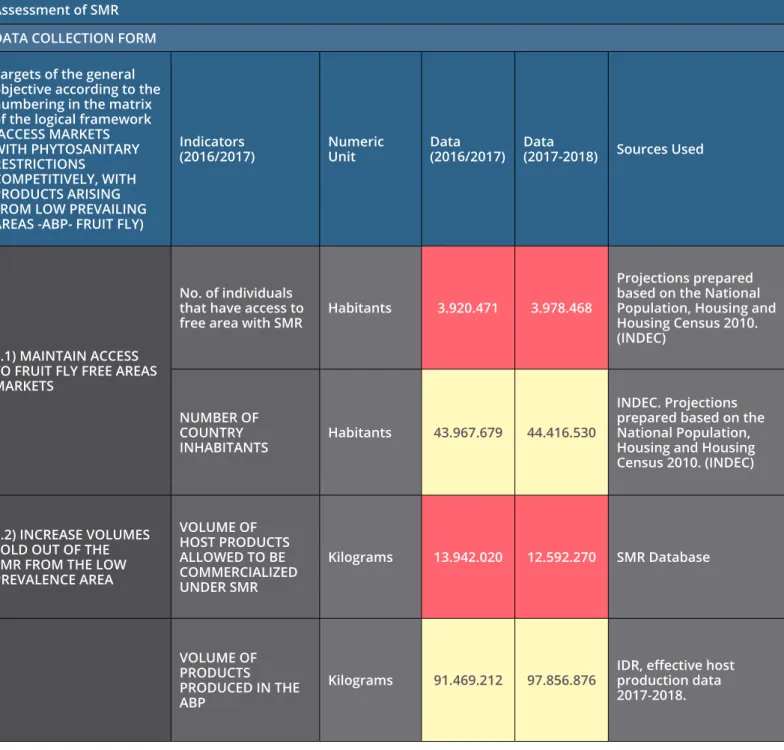
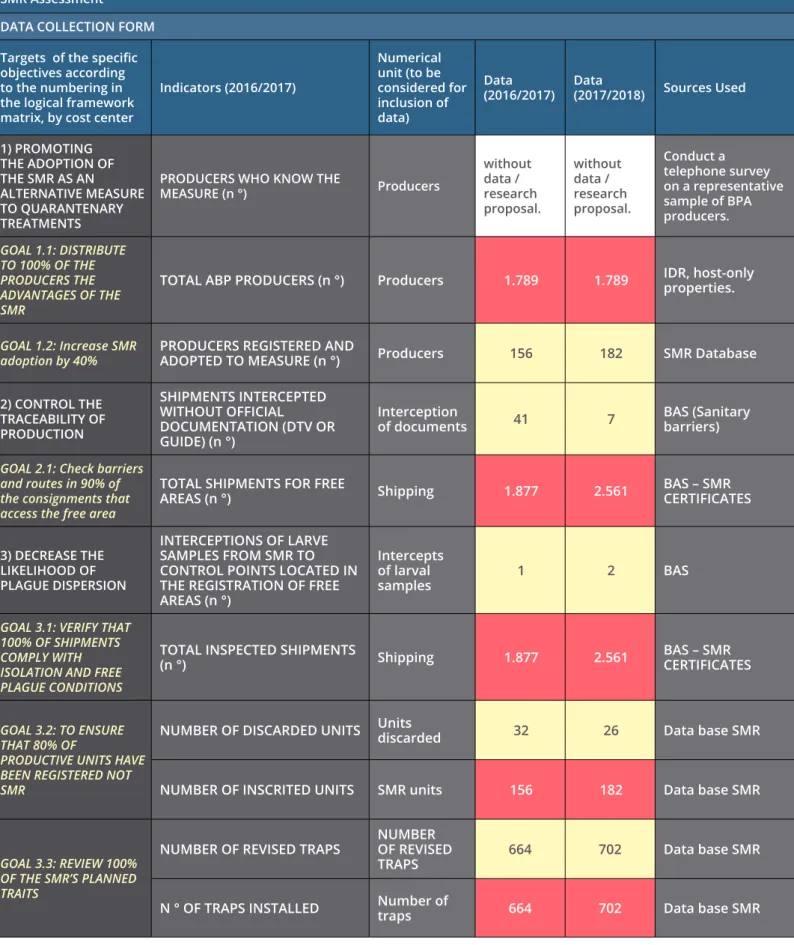
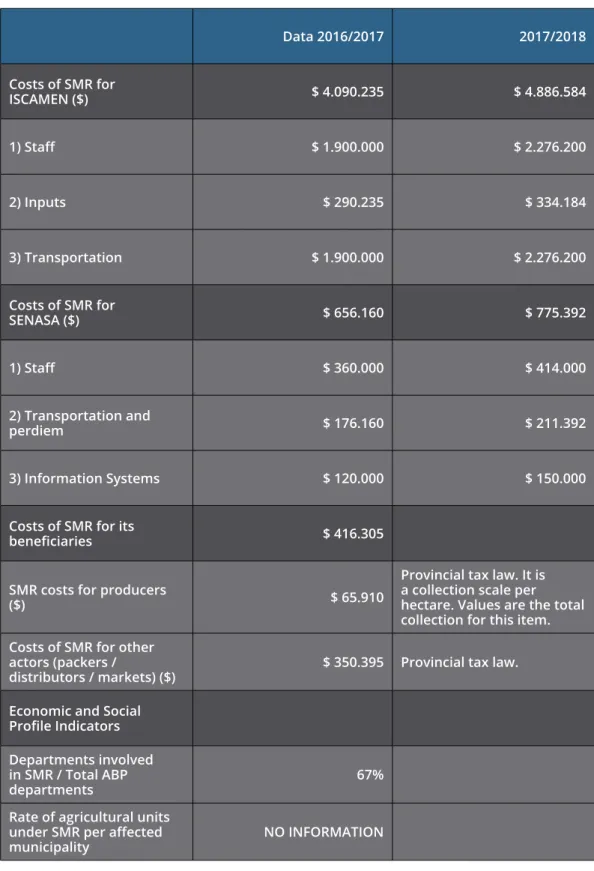
Figure


+7
Documents relatifs
