HAL Id: tel-01811061
https://tel.archives-ouvertes.fr/tel-01811061
Submitted on 8 Jun 2018
HAL is a multi-disciplinary open access archive for the deposit and dissemination of sci-entific research documents, whether they are pub-lished or not. The documents may come from teaching and research institutions in France or abroad, or from public or private research centers.
L’archive ouverte pluridisciplinaire HAL, est destinée au dépôt et à la diffusion de documents scientifiques de niveau recherche, publiés ou non, émanant des établissements d’enseignement et de recherche français ou étrangers, des laboratoires publics ou privés.
Mechanical behavior of granular material considering
particle breakage
Yuqi Zhang
To cite this version:
Yuqi Zhang. Mechanical behavior of granular material considering particle breakage. Mechanics of materials [physics.class-ph]. Université de Lorraine, 2018. English. �NNT : 2018LORR0041�. �tel-01811061�
AVERTISSEMENT
Ce document est le fruit d'un long travail approuvé par le jury de
soutenance et mis à disposition de l'ensemble de la
communauté universitaire élargie.
Il est soumis à la propriété intellectuelle de l'auteur. Ceci
implique une obligation de citation et de référencement lors de
l’utilisation de ce document.
D'autre part, toute contrefaçon, plagiat, reproduction illicite
encourt une poursuite pénale.
Contact : ddoc-theses-contact@univ-lorraine.fr
LIENS
Code de la Propriété Intellectuelle. articles L 122. 4
Code de la Propriété Intellectuelle. articles L 335.2- L 335.10
http://www.cfcopies.com/V2/leg/leg_droi.php
École doctorale EMMA
THÈSE
Pour l’obtention du titre de :
DOCTEUR DE L’UNIVERSITÉ DE LORRAINE
Spécialité : ingénierie géotechniquePrésentée par : Yuqi ZHANG
Comportement mécanique du matériau granulaire en tenant
compte de la rupture des particules
Thèse soutenue publiquement le janvier 2018 à Metz devant le jury composé de : Pierre-Yves HICHER Professor Ecole Centrale de Nantes, France Rapporteur Belouettar SALIM DR HDR Luxembourg Institute of Science and Technology, Luxembourg Rapporteur Marion MARTINY Professor Université de Lorraine, France Examinateur Christophe DANO MCF l’Université Grenoble Alpes UGA, France Examinateur Nadia BENAHMED Chargé de Recherche Irstea, Unité de Recherche RECOVER/Equipe G2DR - FRANCE Examinateur
Jrad MOHAMAD MCF Université de Lorraine, France Invité
Ali DAOUADJI Professor INSA Lyon, France Directeur
El Mostafa DAYA Professor Université de Lorraine, France Co-Directeur
LEM3 - 7 Rue Félix Savart, 57073 Metz Université de Lorraine
École doctorale EMMA
THESIS
To obtain the title of:
DOCTOR OF THE UNIVERSITY OF LORRAINE
Specialty: geotechnical engineeringPresented by : Yuqi ZHANG
Mechanical behavior of granular material considering particle
breakage
Thesis publicly defended on January 2018 in Metz in front of the jury composed of: Pierre-Yves HICHER Professor Ecole Centrale de Nantes, France Rapporteur Belouettar SALIM DR-HDR Luxembourg Institute of Science and Technology, Luxembourg Rapporteur Marion MARTINY Professor Université de Lorraine, France Examinateur Christophe DANO MCF l’Université Grenoble Alpes UGA, France Examinateur Nadia BENAHMED Chargé de Recherche Irstea, Unité de Recherche RECOVER/Equipe G2DR - FRANCE Examinateur
Jrad MOHAMAD MCF Université de Lorraine, France Invité
Ali DAOUADJI Professor INSA Lyon, France Directeur
El Mostafa DAYA Professor Université de Lorraine, France Co-Directeur
LEM3 - 7 Rue Félix Savart, 57073 Metz Université de Lorraine
Acknowledgements
i
Acknowledgments
When this part of a thesis is started, it indicates that my doctoral student stage is coming to the finish line. Thinking back the day in October 2014, I landed in CDG only with a new suitcase. Maybe one month later, the only partner who goes to CDG accompanied with me will be the old suitcase. Three years has passed like a white pony's shadow across a crevice. What’s in exchange is a piece of paper proving this period, and memory of happiness and sorrow, friendliness and loneliness, luckiness and helplessness
I would like show my most sincere thankfulness to my supervisor, Prof. Ali DAOUADJI, an extraordinary and meticulous scientist. It is my honor to acquire his guidance and help. He is my guidepost on the road of science.
I am particularly grateful to my co-supervisor, Prof. El Mostafa DAYA for all the enthusiastic help and encourage during my doctoral career. I would like to express my appreciation to Jrad MOHAMAD for his help on my experimental and numerical works. I also owe a special debt of gratitude to all the teachers such as BIAN Hanbing, Mahdia HATTAB, YIN Zhenyu, Guillaume BOBIN, MATHIEU Norman who offered advices during my study. I would like to thank the other colleagues in LEM3 who offer me assistance, Jacqueline DECKER, Nathalie KASPRZAK, Anne BLUM, Arlette JACQUIERRE, and Julien OURY.
I am indebted to all my friend, CHEN Cai, ZHAO Yajun, WEN Jing, ZHAO Dan, XU Shun, ZENG Ling, GAO Qianfeng, LIU Tao, HUANG Qun, HE Zhongming, XU rui, ZHOU Jialing, YANG Zhengtian, CHEN Xiaolei .... It is difficult to mention all your names here. It is you who shear tears and laughs with me and make this foreign town like home. It is about to leave and I don’t know whether we can meet somewhere and sometime again. I will bless you.
I would like give my most special thanks to my parents. Without your infinite, selfless, unconditional support, it is too far today that can’t walk really. Finally, thank you very much to my love, Dongxia. Without your sweet courage from China, I don’t know whether I can insist on. Thank you for walking in my world.
ii
To my family To Dongxia
13-11-2017 Metz
Tables of Contents iii
Table of Contents
Acknowledgments... i List of Figures ... vi List of Tables ... xi Introduction ... 1Chapter I. Literature Review... 4
I.1. Introduction ... 4
I.2. Failure behavior of single particle under compression ... 4
I.2.1. Experimental studies on single particle failure behavior ... 4
I.2.2. Numerical simulation on single particle crushing behavior ... 7
I.2.3. The exploration of the inside structure of a particle ... 12
I.3. Fabric of packing of granular material ... 16
I.3.1. Basic quantities of fabric of granular material ... 16
I.3.2. Particle connectivity... 17
I.3.3. Contact anisotropy ... 21
I.3.4. Factors which influenced the packing process... 22
I.4. Mechanical behavior of multiple particles considering particle failure ... 26
I.4.1. Factors influencing the mechanical behavior of granular assemblies ... 26
I.4.2. The factors influencing particles crushing ... 30
I.4.3. The influence of particles crushing to the behavior of material ... 36
I.4.4. Descriptions of mechanical behavior of granular material ... 37
Chapter II. Experimental and Numerical Investigation of Breakage of Single Particle of Porous Material under Uniaxial Compression ... 39
II.1. Introduction ... 39
II.1.1. Research Background ... 39
II.1.2. Aim and objectives ... 40
II.2. Experimental apparatus and methodologies ... 40
II.2.1. Sample properties... 40
II.2.2. Uniaxial compression tests ... 41
II.2.3. X-Ray Computed Tomography scan ... 42
II.3. Numerical investigation ... 45
II.3.1. Overview of the material model ... 45
iv
II.4. Experimental results and discussions ... 52
II.4.1. Uniaxial tests ... 52
II.4.2. CT scan analysis ... 54
II.5. Numerical results and discussions of Set 1 ... 56
II.5.1. Load-displacement curve ... 56
II.5.2. Location of the global failure ... 59
II.5.3. Formation of the failure ... 60
II.6. Numerical results and discussion of Set 2 ... 63
II.6.1. Load-displacement curve ... 64
II.6.2. Location and numbers of the cracks in global failure ... 66
II.7. Summary ... 68
Chapter III. Packing of Spherical Particles under Continuous Biaxial Loading ... 70
III.1. Introduction ... 70
III.1.1. Research background ... 70
III.1.2. Aim and objectives ... 71
III.2. Experimental apparatus and analyze methodologies ... 71
III.2.1. Sample properties ... 71
III.2.2. Experimental apparatus ... 72
III.2.3. Analysis methodology ... 76
III.3. Experimental settings ... 78
III.4. Experimental results and discussion ... 80
III.4.1. Packing density ... 80
III.4.2. Coordination number... 83
III.4.3. Contact orientation ... 85
III.4.4. Comparison of upper part and lower part... 89
III.5. Summary ... 91
Chapter IV. Mechanical and Kinematical Characteristic of Multiple Particles when Baring Load Considering Particle Breakage... 93
IV.1. Introduction ... 93
IV.1.1. Research background ... 93
IV.1.2. Aim and objectives ... 94
IV.2. Experimental apparatus and methodologies ... 94
Tables of Contents
v
IV.2.2. Analysis methodology ... 96
IV.3. Experimental results and discussion ... 98
IV.3.1. Load-displacement situation ... 98
IV.3.2. Particles breakage occurrences and distributions ... 104
IV.3.3. Influence of particle failure to fabric of packing... 108
IV.3.4. Displacement analyze ... 111
IV.4. Summary ... 116
Chapter V. Conclusions and Perspectives ... 118
V.1. Conclusions ... 118 V.2. Perspectives ... 120 Reference ... 122 Abstract ... 129 Résumé ... 130 L’introduction Fracaise ... 131
vi
List of Figures
Fig I-1 Several types of Brazilian tests loading configurations in Li’s work [26] ... 5 Fig I-2 Sketch of testing apparatus of Salami’s work [33] ... 6 Fig I-3 The inter-particle friction apparatus designed by Cavarretta et al [32] ... 7 Fig I-4 The fringe contours of samples of different condition under diametral loading of Tang’s work : (a) homogeneous disk, (b) heterogeneous disc, (c) irregular shape particle without confinement, (d) irregular shape particle with confinement [34] ... 8 Fig I-5 Interaction between two spheres: (a) Parallel bond model; (b) Contact bond model... 9 Fig I-6 Stress-strain curve and number of bond breakage of Yan’s work [39] ... 10 Fig I-7 Particle assembly simulated by FDEM in Ma’s work [42] ... 11 Fig I-8 Fracture pattern of the Brazilian disc of Mahabadi’s work : (a) sample failed in the laboratory; (b) simulation result ... 12 Fig I-9 A shear band of a sand from Dersures’ work [47] ... 13 Fig I-10 Evolution of the shape parameters for the LBS and HDG particles in Zhao’s work [48] ... 14 Fig I-11 Sketch and results of test of Druckrey’s work [50] : (a) Sketch of the SMT tests; (b) Load-displacement relationships from experiments (Exp) and FE analyze (FEA) for ideal sphere and the two real particles ... 15 Fig I-12 Test methedology of Alshibli’s work [51] (a) Far field of 3DXRD measurement geometry and (b) particles setting ... 15 Fig I-13 Evolution of lattice strain measurements as a function of axial load for Test 3 for (a) top particle, (b) middle particle, and (c) bottom particle ... 16 Fig I-14 Local vectors at the contact α between two particles 1α and 2α: ... 17 Fig I-15 The relationship between void ratio and coordination number of Oda’s work [62] ... 19 Fig I-16 Illustration of contact normal, branch vectors and doublet vectors from Wang’s work [64] ... 20
List of Figures
vii
Fig I-17 Distribution of the contact normals... 20
Fig I-18 Examples of shapes used in Zhao’s work ... 23
Fig I-19 Representation of a spherocylinder ... 23
Fig I-20 Porosity as functions of particle aspect ratios of Abreu’ work [75] ... 24
Fig I-21 Different effects of packing of polysized particles [83] ... 25
Fig I-22 Simulated tests on loose and dense assemblies of Casagrande’s work [88] .. 26
Fig I-23 Particle shape determination—sphericity S and roundness R chart.[94] ... 27
Fig I-24 Effect of particle shape on void ratios from Cho’s phenomenon [95] ... 28
Fig I-25 Particle types used in the DEM in Maeda’s work: a c101 (circle); b c103 (triangle); c c104 (quadrate); d c106 (hexagon); e c108 (octagon) [97] ... 29
Fig I-26 Particle shape effect on critical state line of DEM samples in Maeda’s work [97] ... 29
Fig I-27 Critical state lines for different values of Rd from Wood’s work [99] ... 30
Fig I-28 Influence de la minéralogie sur la rupture des grains of Lo’s work (a) GSD of beginning and after consolidation, (b) GSD of aluminium oxide after tests, (c) GSD of quartz sand after tests and (d) GSD of limestone sand after tests ... 31
Fig I-29 Comparison of different particle shape in particles assembly crushing tests of Afshar’s work [108] ... 32
Fig I-30 Relationship between total breakage and breakage potential [110] ... 33
Fig I-31 Comparison of the particles diameters in terms of crushing stress of Rozenblat’s work [111]... 34
Fig I-32 Comparison of the particles breakage characteristic of different boundary friction conditions of Kou’s work. (a) boundary with friction (b) boundary without friction ... 35
Fig I-33 The definition of Br in Einav’s work [119] [120] ... 37
Fig II-1 Particles used in the tests ... 41
viii
Fig II-3 Already assembled test equipment for simple particle tests ... 42
Fig II-4 Test equipment for CT tests... 43
Fig II-5 Set of loading equipment for CT test... 45
Fig II-6 Strain-stress curve of material under uniaxial loading in Concrete Damaged Plasticity model ... 46
Fig II-7 Yield surfaces in the deviatoric with different value of Kc ... 48
Fig II-8 Two models of the simulation ... 49
Fig II-9 The sketch of 4 models in Set two on x-o-y plane ... 51
Fig II-10 Displacement-load information of single particle tests ... 52
Fig II-11 Post-scan process of CT test ... 54
Fig II-12 Images of a radiograph projection and a tomography slice ... 55
Fig II-13 Post-scan processing of computed tomography test. ... 55
Fig II-14 3D tetrahedron mesh of the particle ... 56
Fig II-15 One slice of the particle after failed... 56
Fig II-16 Displacement-Load curve of the simulation compared with Laboratory Test ... 57
Fig II-17 Mises stress distribution in Model 1-1 at increasing displacement ... 58
Fig II-18 Mises stress distribution in Model 1-2 at increasing displacement ... 58
Fig II-19 Mises stress distribution in Model 1-3 at increasing displacement ... 58
Fig II-20 Failure state of simulation ... 59
Fig II-21 Failure state of Model 1-3 from different angle of view ... 60
Fig II-22 PEEQ of ideal particle at increasing displacement ... 61
Fig II-23 Compressive damage of ideal particle at increasing displacement ... 61
List of Figures
ix
Fig II-25 Compressive damage of real particle at increasing displacement ... 62
Fig II-26 PEEQT of ideal particle at increasing displacement ... 62
Fig II-27 Tensile damage of ideal particle at increasing displacement ... 62
Fig II-28 PEEQT of real particle at increasing displacement ... 63
Fig II-29 Tensile damage of real particle at increasing displacement ... 63
Fig II-30 Principle load-displacement curve of 4 models ... 64
Fig II-31 The cracks of the four models ... 65
Fig II-32 The PEEQT of the four models just before cracks appeared ... 66
Fig II-33 The logarithmic max principle strain on the z-o-x plane before the crack appeared ... 67
Fig II-34 The normal stress state of elements ... 68
Fig III-1 Original GSD line of the samples ... 72
Fig III-2 3D image of all components and combinations of the two kinds of PSC ... 73
Fig III-3 Three views of PSC with a small cover ... 73
Fig III-4 Three views of PSC with a big cover ... 74
Fig III-5 Sketch of tests instruments ... 75
Fig III-6 Assembled test equipments ... 76
Fig III-7 Working process of the software ... 76
Fig III-8 A comparison between original and treated image ... 77
Fig III-9 Circles found in binary image ... 77
Fig III-10 Grain size distribution curves of 5 tests. ... 79
Fig III-11 Starting states of the 5 tests ... 80
x
Fig III-13 Evolution of packing density of tests ... 81
Fig III-14 First breakage of each test ... 82
Fig III-15 Packing of polysized particles from Larrard’s work ... 83
Fig III-16 Evolution of coordination number of the tests ... 84
Fig III-17 The Perfect Model of monosized particles packing ... 85
Fig III-18 Rose curve of contact orientation of Perfect Model ... 86
Fig III-19 Orientation factors of laborotary tests ... 88
Fig III-20 Analyzing zone of upper part and lower part of Test III-4 ... 89
Fig III-21 Packing densities of different parts of Test III-4 ... 89
Fig III-22 Orientation factors of different parts of Test III-4 ... 91
Fig IV-1 The GSD curve of 6 tests ... 95
Fig IV-2 Scale Image of one of the tests... 98
Fig IV-3 The load-displacement curve of the 6 tests ... 99
Fig IV-4 Fitted curves of load-displacement relationship ... 100
Fig IV-5 Comparisons of fitted curves of and original curves ... 101
Fig IV-6 The order and position of particles failure ... 105
Fig IV-7 Mohr’s circle describing Mohr-Coulomb yield model ... 107
Fig IV-8 Maximum principle stress of Model 1 and Model 2 when the displacement of the cover is 15mm... 108
Fig IV-9 The magnitude of the sum displacement vectors ... 114
Fig IV-10 The included angle of the sum displacement vectors with the vertical direction ... 114
Fig IV-11 Sum of the absolute value of the horizontal component of particle displacement vectors ... 116
List of Tables
xi
List of Tables
Table II-1 Settings of single particle tests... 42
Table II-2 material parameters of concrete damaged plasticity model ... 52
Table II-3 Breakage information of each single particle test ... 53
Table III-1 Setting of the 5 tests ... 79
Table III-2 Rose curves of contact orientation of laboratory tests... 87
Table III-3 Roses curves of different parts of Test III-4 ... 90
Table IV-1 Setting of the 6 tests ... 96
Table IV-2 Parameters of the fitted curves ... 100
Table IV-3 Corresponding load and displacements of particle failure ... 105
1
Introduction
A granular material is a collection of discrete, macroscopic particles with different morphology and mechanical properties. A basic characteristic of this material is that, there would be a loss of energy between two particles when they interact with each other [1]. Generalized concept of granular material contains solids, liquids and gases [2]. However, in this thesis, the studied granular material refers only to a collection of solid particles which are big and heavy enough to give their interaction forces dominance compared with the intermolecular forces. Therefore, liquids and gases are not studied in this thesis. Besides, solids ashes which are less cohesive and easily suspended in the gas due to its tiny sizes and light weights are not considered in this work.
Granular material is ubiquitous in numerous domains. Sugar, salt and cereal are used in the food processing industry. Besides, the operation of powders is also common in manufacturing medical drugs in the pharmaceutical industry. Sand, soil and rock are the objects of study in construction engineering or roads and bridges engineering field, such as excavating foundation and laying roadbed. Obviously, the mechanical behaviour of granular material is different from other continues material, which may make a huge impact on our daily life. For example, the Canoas Novos Dam of Brazil was regarded as the third highest dam of concrete rock fill dam in the world and cost 6671 million dollar. While in 2006, water ran out following a break in the dam wall. One of the key reasons was that a lot of particles of the soil below the bottom of the dam crushed which caused strength reduction of the foundation [3].
So far, several researchers have investigated the complex behavior of granular material. Three different scales including macroscopic, mesoscopic and microscopic can be used to study this kind of material. Till now, soil mechanics could be a set of theories about granular material which are mature enough to be applied to solve practical engineering problems [4]. The three basic assumptions of soil mechanics are continuity, homogeneity and isotropic [5]. Therefore, this theory is still available on macro and mesoscopic scales such as Mohr-Coulomb elastic-ideally plastic model, hypoplastic or elastoplastic models and so on. All the models above consider granular material as a continuous and homogenous media containing an infinite but sufficient number of unbreakable and inseparable particles, leading to a poor understanding of particle-scale mechanics [6].
In fact, the property of granular materials also depends on the particle scale which is smaller than the macroscopic scale, but larger than the atomic dimension. The behavior of granular material is strongly affected by the mechanical behavior of single particles and the relative arrangement of voids and particles. In 1727, Stephen Hales [7] started the study of geometrical arrangements of a set of objects packing randomly. He also used the dimple patterns on peas that had been expanded in a closed,
water-Introduction
2
filled container. However, Hales’ work did not emphasize the mechanical behavior but was limited to the sap of vegetables. The first study of packing of granular material from the perspective of the mechanics began in 1929 by Furnas [8]. In addition, the single particle strength which is a basic property influencing the behavior of granular material was primarily studied by Jaeger in 1967 [9]. Since then, scientists have examined mechanical behavior of individual particle through using several methods. Regarding the mechanical behavior of multiple particles, scientists found that under high effective stress, crushing of particles may occur and act as a significant factor which influences the physical and mechanical behavior of granular material. [10] [11] [12] and [13].
In the present study, experiments and simulations have been performed to investigate the mechanical behavior of granular material at a particle scale with the consideration of particles breakages and particles arrangements. Specifically, nearly spherical particles made by expanded clay would be the experimental samples. Through experimental and numerical methods, the mechanical behavior of single particle considering particle breakage when influenced by pressure would be studied. The fabric characteristic of a packing of spherical particles would be studied with an experimental method and analyzed by software written with MATLAB code. The mechanical and kinematical behavior of multiple particles when suffering biaxial load would be investigated.
In the first chapter, the research background and present conditions in the fields involved in the thesis were reviewed. The basic theories employed in the later chapters would be presented.
In the second chapter, uniaxial compression tests would be performed on approximately spherical single particles. µ-CT technology would be applied to build the geometry of the particle. The geometry would be meshed and imported into Abaqus for further simulation. Comparisons and analyzes would be made about the results of the laboratory tests and simulations.
In the third chapter, biaxial tests would be performed on several groups of particles which were set in a Plane Strain Chamber composed by PMMA. Photos were taken to record the tests. Software was compiled with Matlab code to analyze the fabric of the packing of granular material when undertaking biaxial load.
In the forth chapter, biaxial tests would be performed on several groups of particles with different test setting. Photos were taken during the process of the tests. Mechanical behavior was observed from the tests. Software compiled with Matlab code was used to trace the displacement of each particle in each test in order to investigate the kinematical characteristic of multiple particles when under biaxial loading.
3
In the fifth chapter, a conclusion would be made of the whole thesis and a prospective would be described.
Chapter I. Literature Review
4
Chapter I. Literature Review
I.1.Introduction
This chapter introduces the research background and present conditions in the fields involved in the thesis. The basic theories employed in the later chapters will be also presented. In the second part of this chapter, failure behavior of single particle when with compression tests conditions would be reviewed. The research achievements of other scholars about fabric of packing of granular material are presented in the third part. In the fourth part, the mechanical behavior of multiple particles considering particles failure would be reviewed.
I.2.Failure behavior of single particle under compression
The failure of particles plays a crucial role in the properties of the assembly. It could affect the particle size distribution [14], the shear strength [15], [16] and [17], the solid fraction [18], the yielding surface [19], and so on. Consequently, it is thought that controlling the crush would improve the mechanical performance and reduce the instability. To investigate the global behavior of granular material influenced by particle crush, some scientists performed some investigations on the failure behavior of single particle. In general, the objects are mainly on process mechanical characteristic during loading. In this part, a review will be made on the numerous work achievement and research methods.
I.2.1.Experimental studies on single particle failure behavior a.One dimensional compression tests
For one dimensional compression tests, the yield stress of calcareous sands is lower than that of siliceous sands, because the calcareous particles are more friable [20]. Particle breakage was found to be the principal source of plastic volumetric compression on the normal compression line by McDowell et al [21] who related the micromechanics of grain fracture to the macroscopic deformation of crushable aggregates. As early as in 1948 and 1958, Terzaghi et al [22] and Roberts et al [23] performed one dimensional compression tests. In One dimensional compression test, vertical load is applied while lateral restraints are applied on a sample, so the sample could have only vertical compression and without lateral deformation. The yield stress of one–dimensional compression is an important parameter which indicates the initiation of particle crushing. The value of yield stress is always defined at the point where the relation of the deformation to the stress increment changes rapidly on a plot of semi-logarithmic coordinates. With the same kind of tests to aggregates, McDowell et al [21] indicated that the yield stress and the particle tensile strength exists a directly proportional relationship. With the same test principle, Yoshimoto et al [24] performed tests on granulated coal ash to evaluate the crushing behavior of each single particle. Besides, he demonstrated that, when the crushing strength rises, the shear stiffness increased and the compressive volumetric strain decreased. In addition,
5
he also found the crushing strength of single particle shows no relationship with its dimension.
b.Brazilian test
A kind of widely used tests for rock mechanical applications, Brazilian tests, which could be treated as a 2D displacement-controlled single particle compression tests. The Brazilian test is a simple indirect testing method to obtain the tensile strength of brittle material such as concrete, rock, and rock-like materials, in which, a cylinder is diametrically compressed to failure [25]. Four typical loading configurations are shown in Fig I-1 [26].
Fig I-1 Four types of Brazilian tests loading configurations in Li’s work [26]
(a) Flat loading platens, (b) Flat loading platens with two steel rods, (c) Flat loading platens with cushion, and (d) Curved loading jaws
Carneiro et al [27] invent the Brazilian testing method to obtain the tensile strength of concrete in 1943. Mellor et al [28] measured tensile strength by Brazilian tests on discs and annuli for Griffith-type materials. In addition, he also designed a curved-jaw loading jig to reduce the stress concentration at the loading points and concluded that the Brazilian test could successfully give a good measure of uniaxial tensile strength. Newman et al [29] carried out statistical experimental studies on the effect of specimen geometry and stress rate on the determination of the tensile strength of sandstone by the Brazilian tests in 1990 and concluded that the length-to-diameter ratio of the specimen exerts a significant effect on the tensile strength.
Salami et al [33] performed several multipoint crushing tests on cylindrical samples to investigate the affect of coordination number on particle crushing (Fig I-2). His tests demonstrated that the amount of orientations of contacts plate could influence the fragmentation of a single particle and the critical force was highly dependent on the contact area.
Chapter I. Literature Review
6
Fig I-2 Sketch of testing apparatus of Salami’s work [33] c.3D single particle compression tests
As for 3D displacement–controlled single particle compression tests, singles particles are applied displacement controlled loads from one or several directions. McDowell [30] performed tests on 30 silica sand grains of different diameters and found that the yield stress of a particle increased with the increase of tensile strength and the decrease of particle size. Nakata et al [31] conducted single particle crushing tests to investigate the relationship between single particle crushing characteristics and one-dimensional compression behavior. According to the results, the particle characteristic stress grows when the void ratio increases or the coordination number decreases. Cavarretta et al [32] carried out compression tests on glass ballotini which were used to simulate soil and concluded that the initial plastic displacement has relationship with its topography and bulk character and the surface rigidity. Moreover, he also designed a new particle-particle friction apparatus (Fig I-3) to study the influence of particle roughness. His tests indicated that the plastic strain appeared at the contact surface and related to plastic yield.
In addition to particle strength, some scientists also found the coordination number could act as another factor which influences particle crushing. It can be concluded that larger particles with a higher coordination number due to their sizes are difficult to crush. By contrast, the smaller ones which have a higher probability of having a low coordination are easier to crush [14].
7
Fig I-3 The inter-particle friction apparatus designed by Cavarretta et al [32] I.2.2.Numerical simulation on single particle crushing behavior
a.FEM methods
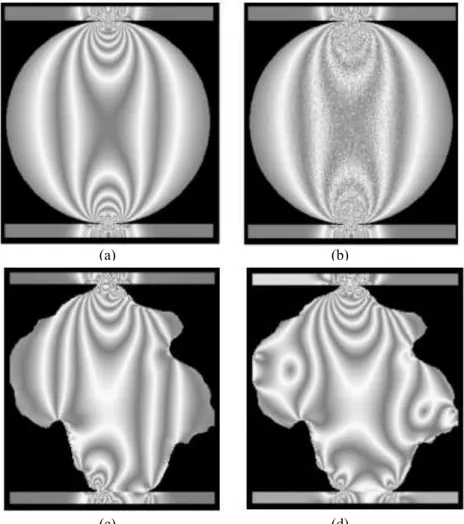
As a progress of computer and algorithm, scientists started to combine numerical simulation with laboratory experiments. Tang et al [34] simulated 2D disk samples and 2D irregularly shaped particles under diametric loading with RFPA2D which is a finite element method (FEM) software used to study their crushing behavior following different loading conditions (Fig I-4). In this software, Weibull’s distribution law is used with a homogeneous index m to describe the heterogeneous mechanical properties of the model elements. Breaking an element means reducing the element’s stiffness and strength, but the broken elements may restore their stiffness when they are highly compressed. He has concluded that the failure mode during loading is suddenly splitting and gradually crushing. In addition, he also found that the confinement stress increases the sample’s initial stiffness and breaking strength. Loading with lateral constraint produces finer sub-particles because of shear failure especially in the vicinal zone of the contact points. However, loading without lateral constraint could lead to an increasing number of coarse sub-particles because of splitting parallel to loading diameter.
Chapter I. Literature Review
8
Fig I-4 The fringe contours of samples of different condition under diametral loading of Tang’s work : (a) homogeneous disk, (b) heterogeneous disc, (c) irregular shape particle without confinement, (d)
irregular shape particle with confinement [34] b.DEM methods
For FEM, the continuum assumptions permit the elements to undergo only small strains. Therefore, even when fracturing is allowed, large-scale opening, sliding, or complete detachment of elements is not possible. Compared with FEM, discrete element method (DEM) is more extensively used for modelling crushing of particles with an advantage of providing a microscopic insight of the progressive failure phenomena and breakage mechanism. The difference of the two methods is that for FEM, a particle acts as a whole and is separated to several elements while calculating. However, for DEM, a particle breakage is modelled by an agglomerate of bonded spheres [35] or replaced by a group of fragments based on suitable failure criteria [36]. In the sphere bonding models, there are two specific implementations, namely, parallel bond and contact bond. In the parallel bond, a bond disk is defined between the two bonded spheres to transfer normal force, shear force and bending moment of oppose rolling. The contact bond model does not have the bond disk as defined in the parallel bond model, and can only resist normal and shear forces at the contact point (Fig I-5).
(a) (b)
9
Fig I-5 Interaction between two spheres: (a) Parallel bond model; (b) Contact bond model
The corresponding parallel bond is shown in Fig I-5 (a) where XA and XB are the
position vectors of sphere A and sphere B, n is the contact normal vector. As a result of the constant normal and shear stiffness of the bond, a force and a moment are developed within the bond induced by the relative motion at the contact. For the contact point interaction between spheres, the linear visco-elastic model is adopted, as shown in Fig I-5 (b) where MA and MB are the mass of sphere A and B, Kn and Ks are
the normal and tangential stiffness, Cn and Cs are the normal and tangential damping
coefficient, μ is the friction coefficient.
Cil et al [38] and Yan et al [39] modelled fracture of irregularly shaped particles which were generated as an agglomerate of large numbers of spherical sub-particles connected by contact bonds with moment and tension through using Particle Flow Code 3D (PFC3D) and Sphere-base Discrete Element Method (SDEM), respectively. According to their studies, cracks appeared with a few bond breakages at the contact point. Then, more bonds breakages appeared and the contact forces increase. Finally, the particle was divided into several smaller parts with a dramatic decrease of contact forces and increase number of broken bonds. In Cil’s work, the investigation demonstrated that particle crushing is affected by boundary conditions. Additionally, the micro behavior of agglomerates caused by particle crushing could not regenerate a stress-strain behavior at large scale. In Yan’s work, four stages of a particle crushing linear elastic (O-A), crack initiation (A-C), softening(C-D) and final splitting (E-G) was described with a view on the bond according to the stress-strain relationship. In the crack initiation stage, a few bonds broke. In the soften stage, more bonds broke and the stress declined rapidly. In the final splitting stage, particle split into several sub-particles with a drastic increase of bonds breakages (Fig I-6). Sukumaran et al [40]
Chapter I. Literature Review
10
conducted DEM simulation with PFC to explore the influence of coordination number to the crushing strength of particles. She concluded that, for 2D particles (disks), the critical force Fc follows
I-1 where σc is the critical tensile stress. fCN describes the effect of coordination umber
I-2 where C is the coordination number, d is the diameter of the crushed particle and D is the diameter of the surrounding particles.
fD describes the effect of diameter of surrounding particles
I-3
Fig I-6 Stress-strain curve and number of bond breakage of Yan’s work [39] c.A combination of FEM and DEM
Since deformability can be well described by FEM, and fractures can be explicitly represented by DEM, to combine the advantages of FEM and DEM, several studies used a merging of the two methods. For example, Bagherzadeh et al [41] and Ma et al [42] used a combined finite-discrete element method (FDEM). In this system, each
11
particle is modelled with FEM mesh, while all the relationship between particles such as contacts, displacement, inter-particle force, are calculated with DEM (Fig I-7). When a contact is detected by the software, a linear contact model will be generated to calculate contact force. The numerical results indicated that higher confining pressures gave rise to a larger numbers of particles breakage. Additionally, the particles in the shear band were more likely to break.
Fig I-7 Particle assembly simulated by FDEM in Ma’s work [42]
Mahabadi et al [43] believed that precious FDEM codes had some shortcomings. For example, there was no appropriate friction law to describe quasi-static friction and in the fracture model, there is no friction component. To overcome such limitations, a new numerical code Y-GEO is developed based on FDEM framework mainly for rock mechanics. A micro-scale model of a heterogeneous Brazilian disc test was studied to
prove Y-Geo could be capable of accurately estimating crack trajectories and the failure mechanism of the specimen (Fig I-8).
Chapter I. Literature Review
12
(a) (b)
Fig I-8 Fracture pattern of the Brazilian disc of Mahabadi’s work : (a) sample failed in the laboratory; (b) simulation result
Similarly, more methods on the basis of the same fundamental principals have been applied by other scientists. Each of them made some improvement on the FDEM methods. For example, Multiple-particle finite element method (MPFEM) combines discrete behavior of particles assemblies with the analysis ability of large contact deformation. The advantage is there is no simplifying assumption for the particle kinematics and contact mechanics like DEM. Move over, this method could simulate compression to high relative densities [44]. Meshed discrete element method (MDEM) was developed to overcome the limitation on basic DEM that the existing contact laws could not analysis all physical phenomena of granular material. It could give an accurate description of the particles’ deformation and produce more accurate results [45].
I.2.3.The exploration of the inside structure of a particle a.Computed Tomography technology
Admittedly, all the traditional laboratory experiments are based on the particle’s external morphologies and obtain its external displacement and strain. Even for numerical simulation, especially for the some kinds of particles whose internal structure is complicated enough to influence its mechanical behavior, the internal structure whose parameters are confirmed based on the traditional laboratory experiments results could not reflect the internal microstructure behavior during the crushing process. To investigate the internal geometry, X-ray Computed tomography (CT) technology could provide an effective instrument. X-Ray CT is a non- destructive, 3D high resolution imaging method that allows the internal microstructure of a particle to be understood. This technology was invented for medical domain and was started to be utilized for geotechnical engineering field in about recent 30 years. A CT scan utilizes lots of X-ray projections taken from different perspectives to produce enough cross-sectional images of a sample, in order to reconstruct its inner appearance [46]. X-Ray Computed Tomography Scan was first successfully utilized in geotechnical field research in 1996 by J. Desrues et al [47]. He studied strain localization in triaxial tests on sand and the shear band could be shown in his research (Fig I-9). Recently, with a progress of the instrument manufacturing,
13
scientist performed more CT tests and some improved version of CT tests with smaller resolutions.
Fig I-9 A shear band of a sand from Dersures’ work [47]
Zhao et al [48] performed CT scan four Leighton Buzzard sand (LBS) particles and four highly decomposed granite (HDG) particles during loading to study the mechanism of particle breakage behavior when under single particle compression (Fig I-10). He demonstrated that particle morphology and initial microstructure significantly influence the fracture pattern. The complicated morphology and microstructure could result in a complicated fraction pattern. For the LBS particles, the fracture planes were mainly parallel to the loading direction. For HDG particles whose external morphologies and internal microstructures are more complex, the initial internal voids, impurities resulted in the generation of different forms of tensile, shear and bending cracks through cleavage planes, mineral boundaries, voids or impurities. Although the LBS particles had much larger sphericity and convexity values than the HDG particles, fracture caused their values to decrease and converge to the same level. In contrast, while the initial aspect ratios were similar, the final values were lower for LBS particles. The stronger LBS particles tended to produce lower aspect ratio fragments with lower angularity, but resulted in the same level of sphericity and convexity as the HDG fragments.
Chapter I. Literature Review
14
(a) (b)
(c) (d)
Fig I-10 Evolution of the shape parameters for the LBS and HDG particles in Zhao’s work [48] (a) sphericity and convexity of LBS; (b) aspect ratio of LBS ;(c) sphericity and convexity of LBS; (d)
aspect ratio of LBS (S: sphericity; CX: convexity; EI: elongation index; FI: flatness index)
b.Some enhanced instruments
Based on fundamental CT technology, some other enhanced instruments were developed and utilised. At first, the accuracy was improved dramatically. One of the most popular equipment is currently Micro CT or µ-CT whose higher resolution could ensure the precision of the results. The word micro is used to indicate that the pixel sizes of the cross-sections are in the micron range. In addition, some scientists also call it High-resolution CT (HRCT) [49].
Druckrey et al [50] used Synchrotron Micro-computed Tomography (SMT) which could be regarded as an enhanced instrument to industrial CT system by producing images with a higher resolution (in the order of 5 micron/voxel) to capture and reconstruct the geometry of single silica sand particle. For soft X-ray, its stronger attenuation might lead to beam hardening effects in the reconstructed images. Synchrotron radiation could solve this problem through providing an intense hard X-ray with high photon flux which could make it possible to acquire reconstructed images with high resolution and low noise ratio (Fig I-11). He found that cracks appeared from the contact point between the particle and the loading system and since
15
the failure started, the elastic stress decreased rapidly and a brittle failure appeared and separate the particle to several parts.
(a) (b)
Fig I-11 Sketch and results of test of Druckrey’s work [50] : (a) Sketch of the SMT tests; (b) Load-displacement relationships from experiments (Exp) and FE analyze (FEA) for ideal sphere and the two
real particles
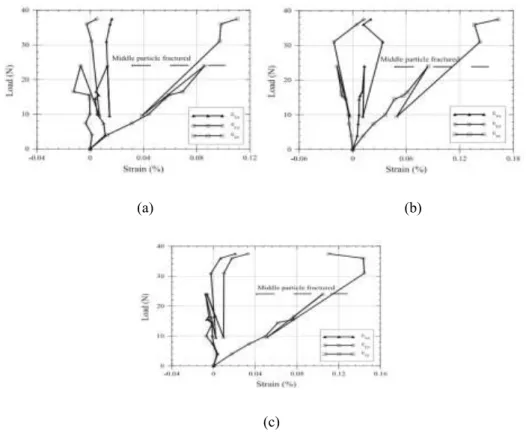
Alshibli et al [51] considered that, although CT scan could provide the inner geometry including voids of a sample, it cannot measure the contact stress and strain. In contrast, three-dimensional X-ray diffraction (3DXRD) microscopy is a promising technique that has the potential to measure lattice strains and crystallographic orientation of crystalline materials. Consequently, he tried to use 3DXRD method to determine volume averaged lattice strain tensor components of individual silica sand particles under axial loading condition (Fig I-12). His work demonstrated that 3DXRD technique could collect diffraction data which could be utilized to calculate particle lattice strain. Besides, he also found that before particle crushing, the vertical force and vertical normal strain fit a linear elastic relationship (Fig I-13).
(a) (b) Fig I-12 Test methedology of Alshibli’s work [51] (a) Far field of 3DXRD measurement geometry and
Chapter I. Literature Review
16
(a) (b)
(c)
Fig I-13 Evolution of lattice strain measurements as a function of axial load for Test 3 for (a) top particle, (b) middle particle, and (c) bottom particle
I.3.Fabric of packing of granular material
Particulate systems play an important role in the world we live in. Numerous scientists tried to make some breakthrough on this field. A packed bed is the most fundamental research topic of granular material due to all particles. The definition of
fabric is the arrangement of particles, particle groups, voids and their correlation [14].
Different initial fabric could cause a lot of considerable differences on the mechanical behavior of one kind of granular material [53] [54]. Early studies established on mathematical derivation and laboratory experiments such as Oda’s work [55] and Finney’s work [68]. Recently, with the development of computer technology and image processing, more investigations have been applied in this field.
I.3.1.Basic quantities of fabric of granular material
Based on experimental observation of Oda et al [55], fabric of a random assembly of spherical granular were introduced such as density of contacts, average branch length and second-order symmetric tensor. Coordination number, radial distribution function and packing density are the most commonly used and fundamental parameters to characterize a structure of a granular material [56] [57].
At the particle scale, the granular fabric involves three basic vectors based on which other local geometrical variables could be defined. For a pair of particles contacting particles 1α and 2α sharing the contact α, a) the branch vector joins the centres of
17
particles, b) the contact orientation vector defined as the unit vector normal to the particle boundary at the contact point α and c) the contact vectors joins the particle centres to the contact point. The contact force indicated the force at the contacting point.
Fig I-14 Local vectors at the contact α between two particles 1α and 2α: I.3.2.Particle connectivity
The connectivity of a granular assembly refers to the set of active contacts. The connectivity is described most basically by the coordination number which appeared as a concept in chemistry field and originally defined in 1893 by Alfred Werner et al [58]. The coordination number of a central atom in a molecule or crystal is the number of its near neighbours. For granular material, the coordination number has two meanings for two kinds of study object. For one particle, the coordination number indicates the number of its neighbour particles [59]. For a random arrangement of particles, the coordination number means the average number of particles touching a given one. Besides, the detailed calculating methods of the coordination number were introduced by Jouannot-Chesney et al [60]. The packing density means the volume fraction of the space dominated by particles. Obviously, for a certain material, the packing density plus the porosity equals to 1. Lochmann et al [61] studied the geometrical organization of four different kinds of packing structures including monosized, binary, power-low and Gausian sized distribution. The results demonstrated that the fabric of granular material is closely associated with radial distribution function.
Considering a finite population of particles, Np corresponds to the number of particles.
For particle number i, it may contact with another particle number j. Each of the contact is given a name ci-j. Nc corresponds to the total number of contacts.
Chapter I. Literature Review
18
Nco means the coordination number of the material.
I-5 It is worthwhile of noting that, associated with one contact surface, there are two contacts and each of the contact belongs to a particle at one side. Therefore, ci-j and cj-i
refer to two contacts of two opposite direction of one contact surface.
If δ is the density of particles centre located in a chamber whose volume is V.
I-6 If the radial distribution function could be given by a probability density function f(r)
I-7 For any function , is the mean value based on the probability density function
I-8 Let Vs be the total solid volume and e be the void ratio, the total volume V equals to
(1+e)Vs. Therefore
I-9 I-10 the density of contacts is
I-11 Some scientists studied the relation between the contact coordination number and the void ratio of the material. Oda [62] found that the Nco and e are independent of the
radial distribution function (Fig I-15). The relationship is shown as follow:
19 Thus, the density of contacts
I-13
Fig I-15 The relationship between void ratio and coordination number of Oda’s work [62]
The concept of coordination number has a limitation that all the particles contact each other at single points or the contacting areas which could be simplified to points. Therefore, this kind of contact has a limitation on the particles shapes. For example, for the cuboid or sheet particles, the contact surface cannot be points. Therefore, a definition contact index was proposed by Fonseca which considers the contact area.
I-14 where Spiis the surface area of particle i, Scjis the surface area of the contact j and Nc;i
is the number of contacts involving particle i [63].
The contact normal which is also called contact orientation vector is defined as the unit vector normal to the contact boundary. Besides, the vector joining the centres of contacting particles is called the branch vector. The vector connecting the centre of a given particle and its nearest neighbours is called doublet vector (Fig I-16) [64].
Chapter I. Literature Review
20
Fig I-16 Illustration of contact normal, branch vectors and doublet vectors from Wang’s work [64]
To express vectors of a given set of particles, the most Intuitive approach is to build rose diagrams (Fig I-17) [65][67].
(a) (b)
Fig I-17 Distribution of the contact normals
(a) 2D example from Oda’s work [65] (b) 3D example from Wang’s work [67]
These rose diagrams could offer a qualitative description of fabric orientations, and the likelihood of the orientation could be described by a probability function.
=1 I-15
where dΩ is the differential solid angle in a spherical coordinate system and is the vectors of contact normal.
21 I.3.3.Contact anisotropy
The shear strength of dry granular materials is generally affected by the buildup of an anisotropic texture due to friction between the particles and as a result of arrangement effects depending on particle shapes and sizes [65] [66].
From the experimental values, an experimental probability density function
which can be approximated by a theoretical distribution ) could be defined. The theoretical approximation could be obtained by means of the least square method which amounts to minimizing the function
I-16 Let P be expanded as a polynomial sum
I-17 Because of the even parity of P, all the odd terms are dropped. The function P is parameterized by the tensors Cij... of increasing order. It can be shown that for an
approximation of order m, all terms of order below m should be omitted since they can be expressed through the higher-order terms. For example, using the identity tensor I, we can write Cijninj=(CijIkl)ninjnknl , since Iklnknl=1. Hence, the most general
polynomial expression of order m is simply given by
I-18 For 2D system, Radjai et al [65] introduced the concept of anisotropy and studied the method for description of granular texture with anisotropy. A representation of the probability density function of the contact normal distribution is produced as a Fourier expansion and the second order expansion of P could be expressed as
I-19 where α is the second order fabric anisotropy, is orientation of
defines the direction of the fabric anisotropy. The second order fabric tensor is given by
Chapter I. Literature Review
22
where α and β are the components in a reference frame. By definition, tr(F)=1. The anisotropy of the contact network is given by the difference between the principal values F1 and F2.
I-21
θi-j is used to express the orientation of the contact ci-j. To be specific, θi-j means the
angles of the normal of the contact surface with horizontal plane. With θi-j, the
contacts orientation of each image could be shown with rose diagrams. Therefore, it could be easily imagined that, the difference of θi-j and θj-i is π.
I-22 If a equals to 0, the material is absolute isotropy. However, if a equals to 1, the material shows a significant anisotropy.
I.3.4.Factors which influenced the packing process
The granular fabric develops mainly because of contact loss and gain. The fraction of lost and gained contacts depends on the contact orientation. Some factors which influenced packing process are studied by some scientists.
a.Shape of particles
The particle shape is one of the most important variables in the packing process. Many authors focused on some shapes of particles, e.g., spheres [68], ellipsoids [69] and regular convex polyhedral [70] to study packing characteristic and performed some experimental tests. In addition, the relationship between particle shape and packing density has been studied. The effect of different 3D object such as cube, cylinder, spherocylinder, cone, tetrahedron, and sphere on packing density of granular material has been revealed. It has been found that the packing density reached peak value when the particles are cube and decreased as the number of sides increased [71]. Additionally, the relation between Aspect ratio, particle size and the fabric of the packing of granular were investigated [72] [73] [74]. Zhao et al [72] used two parameter η and ζ, representing aspect ratio and blockness respectively, to describe different type of particles (Fig I-18) composing different packing and investigated the relationship between these parameters and packing density. The results obtained with a numerical simulation of a super ellipsoid model using DEM showed that η and ζ could significantly affect packing density, correlation number and anisotropy while the distribution of particle orientation is more sensitive to ζ than to η. Abreu et al [75] performed DEM simulation with different packing of various shapes of spherocylinder particles. In his simulation, the shape of spherocylinder could be described by the aspect ratio φ which could be calculated as the ratio between its length and diameter (Fig I-19). To study the effect of shape, all the packing has
23
particles with the same volume and density but different aspect ratio. According to his result, the porosity decreases to minimum value then increases with aspect ratio increasing. Thus, the aspect ratios affect the porosity significantly and an extreme point of aspect value could be found to make the packing densest (Fig I-20).
Fig I-18 Examples of shapes used in Zhao’s work
Chapter I. Literature Review
24
Fig I-20 Porosity as functions of particle aspect ratios of Abreu’ work [75] b.Diameter conditions of particles
The influence of particles diameter has been studied in several works. For monosized and polysized particles, the mechanical behaviour of granular material showed great difference [76] [77].
For monosized particles sample, there are two packing states including random loose packing (RLP) and random close packing (RCP). The definitions of the two states were given by Berryman in 1983[78]. He considered that, in the RCP state, any increase in packing density is impossible. On the contrary, the RLP refers to the loosest packing which could maintain mechanical stability. That is to say, for the particles whose scales are big enough to get rid of Van der Waals force, the RCP state would give a maximum packing density. In three dimensions and two dimensions, the packing density is 0.6366±0.02 and 0.82±0.02, respectively [79]. As for RLP, the packing density is affected by the particle’s mechanical behavior. For cohesive particles, the packing fraction of RLP can range from 0 to 0.64. For cohesionless particles, since friction between particles may decline the packing density [80], it may vary with friction coefficients in a narrower range, probably from 0.554 to 0.64. For cohesionless and frictionless particles, it is the same as RCP [81].
The comparison between packing densities obtained with different particles diameter conditions has been made by Wong et al [82]. He explained that, ideally, the packing density of polysized particles is bigger than the packing density of monosized ones. The reason is that the particles of smaller sizes could fill up the gaps between the bigger ones. If the process of filling up could be extended infinitely by smaller and smaller particles, all the voids could be filled up and the packing density could be close to 1. The process above was called filling effect. Nevertheless in reality, the above process is very difficult to achieve due to a lot of restriction. For example, it is easy to imagine that the diameter of big particles and the diameter of smaller particles which filled up the gaps should maintain a certain proportion. By contrast, if the fine
25
particles are not small enough to fill up the gaps between larger ones, the larger particles would be pushed apart which causes an increase in void volume and decrease in packing density and this process was called loosening effect [83] (Fig I-21).
(a) (b)
Fig I-21 Different effects of packing of polysized particles [83] (a): Filling effect. (b): Loosening effect
Some works showed interesting in the influence of some dynamic factors on material properties [84] [85]. Silbert et al [86] found the relationship between dropping height and packing density from the direction of energy and found that a bigger dropping height usually leads to a denser packing due to a faster energy accumulation. However, a faster energy consummation caused by friction, deposition, may result in a loose packing. Random closed packing states could be achieved by some physical methods such compaction and vibration. An applied DEM model simulates the process from random loose packing state to random close packing state through one dimensional vibration to acquire the proper vibration amplitude and frequency.
Casagrande [88] defined the concept of critical state to study granular material. When the phase of critical state is reached, deformation continues without changes of packing density (Fig I-22). For dense packing, the granular material reaches critical state as s result of dilation. However, for the material of loose packing, it would reach critical state when under contraction. In several works, it is believed that critical coordination number and critical anisotropy should be considered as a combination that describes critical state. It is found that the relationship between packing density and coordination number is influenced by anisotropy of the contact orientations.[89] [90].
Chapter I. Literature Review
26
Fig I-22 Simulated tests on loose and dense assemblies of Casagrande’s work [88] I.4.Mechanical behavior of multiple particles considering particle failure
Mechanical behavior of granular material has been studied for hundreds of years. Some classical theories were born concentrating on this field. For example, the Mohr– Coulomb theory which is named in honour of Charles-Augustin de Coulomb and Christian Otto Mohr is used to describe the shear strength of soil [91]. Karl von Terzaghi studied the filtration theory of consolidation and principal of effect stress [92]. Moreover, the crushing of particles which act as components of granular may exert significant influence on the mechanical property of granular material due to changed grain size distribution. It may lead to an upheaval of the micro structure. As a result, particles’ crushing has attracted great attention in recent years.
I.4.1.Factors influencing the mechanical behavior of granular assemblies
It is found that except for the stiffness of single particles, some other factors also influenced the mechanical behavior of granular media. It is believed that particle size and shape are affected by its generation history. In return, particle size and shape reflect the material behavior. In addition, the grain size distribution (GSD) and the interparticular friction also make a crucial impact on the mechanical response of the material. Moreover, microstructures which are formed in the connection paths of contact points between particles also influence the mechanical behavior of granular assemblies.
a.Influence of particle shape
Wadell [93] and Krumbein [94] introduced three important parameters in particle shape. Sphericity or eccentricity refers to the global form of the particle and describes the uniformity among the particle’s length, height, and width (Fig I-23). Sphericity can be calculated as the diameter of the largest inscribed sphere relative to the diameter of the smallest circumscribed sphere. Roundness or angularity describes the
27
scale of major surface features which are typically one order of magnitude smaller than the particle size. Roundness could be quantified as the average radius of curvature of surface features relative to the radius of the maximum sphere that can be inscribed in the particle. Smoothness or roughness describes the particle surface texture relative to the radius of the particle.
Fig I-23 Particle shape determination—sphericity S and roundness R chart.[94]
In addition, Wadell [93] also believed that sphericity, roundness, and smoothness form an independent set. Sphericity and roundness increase because of abrasion, however they do not increase proportionally. Furthermore, although chipping of a particle may increase the sphericity, it decreases the roundness. All in all, round particles can have nonspherical shape and equidimensional particles can be very angular
Cho et al [95] studied the results from published papers to explore the effects of particle shape on void ratio. For the particle assembles with similar GSD, both emax
and emin, and the void ratio difference Ie=emax−emin increase as roundness and
sphericity decrease (Fig I-24). The reason is that irregularity hinders particle mobility and their ability to attain dense packing configurations. In the case of low sphericity, platy particles bridge gaps over grains and create large open voids.
Chapter I. Literature Review
28
Fig I-24 Effect of particle shape on void ratios from Cho’s phenomenon [95]
Ashmawy et al [96] used DEM to model the liquefaction of angular soils. In this work, a new method was applied to model angularity of particles as a series of overlapping, rigid connected distinct elements of equivalent properties. Simulation of cyclic shear tests were carried out on representative volumes of six materials with the same size distribution to evaluate the dependence of liquefaction susceptibility on particle morphology. Based on the result, at the maximum void ratio, the susceptibility to liquefaction is independent of particle shape. However, the liquefaction resistance increases with particle irregularity in the case of samples prepared at the same void ratio.
Maeda et al [97] simulated the deformation of granular material with different particle shapes via 2D DEM under different stress levels and densities. Circular (Fig I-25a) and non circular (Fig I-25b-e) particle elements were considered to investigate grain shape effects on macro bahavior of granular material. He found that macro deformation and failure of granular materials were induced by not only interparticular sliding but also particle rotation due to the buckling of the microstructure. The coordination number Nco, which represented the stability of fabric, increased under
isotropic compression and decreased under shearing. Consequently, Nco was revealed
to have a critical state which corresponds to the relation e−p−q in critical state soil mechanics The results also demonstrated that the critical line moved upward with the increase of angularity (Fig I-26).
29
Fig I-25 Particle types used in the DEM in Maeda’s work: a c101 (circle); b c103 (triangle); c c104 (quadrate); d c106 (hexagon); e c108 (octagon) [97]
(a) (b)
Fig I-26 Particle shape effect on critical state line of DEM samples in Maeda’s work [97] (a): Critical state line in void ratio (b): critical state line in coordination numbers b.Influence of GSD
Igwe et al [98] performed tests on three silica sand samples, well graded, intermediately graded and narrowly graded to investigate the GSD effect on the mechanical behavior of granular material. The results suggested that as the coefficient of uniformity increased, both the peak and critical strength of sand increased. Well graded samples have a higher static liquefaction resistance the poorly graded samples. Through simulating a series of numerical triaxial tests, Wood et al [99] used DEM method to study the influence of GSD on the mechanical behavior. The results indicated that the initial GSD influences the critical state of the material. To be
![Fig I-1 Four types of Brazilian tests loading configurations in Li’s work [26]](https://thumb-eu.123doks.com/thumbv2/123doknet/14599698.730979/22.892.152.784.378.590/fig-types-brazilian-tests-loading-configurations-li-work.webp)
![Fig I-6 Stress-strain curve and number of bond breakage of Yan’s work [39]](https://thumb-eu.123doks.com/thumbv2/123doknet/14599698.730979/27.892.187.715.474.944/fig-stress-strain-curve-number-bond-breakage-yan.webp)
![Fig I-10 Evolution of the shape parameters for the LBS and HDG particles in Zhao’s work [48]](https://thumb-eu.123doks.com/thumbv2/123doknet/14599698.730979/31.892.207.686.101.607/fig-evolution-shape-parameters-lbs-hdg-particles-zhao.webp)
![Fig I-11 Sketch and results of test of Druckrey’s work [50] : (a) Sketch of the SMT tests; (b) Load- Load-displacement relationships from experiments (Exp) and FE analyze (FEA) for ideal sphere and the two](https://thumb-eu.123doks.com/thumbv2/123doknet/14599698.730979/32.892.220.675.179.430/sketch-results-druckrey-sketch-displacement-relationships-experiments-analyze.webp)
![Fig I-15 The relationship between void ratio and coordination number of Oda’s work [62]](https://thumb-eu.123doks.com/thumbv2/123doknet/14599698.730979/36.892.143.698.149.571/fig-the-relationship-between-void-ratio-coordination-number.webp)
![Fig I-16 Illustration of contact normal, branch vectors and doublet vectors from Wang’s work [64]](https://thumb-eu.123doks.com/thumbv2/123doknet/14599698.730979/37.892.230.661.107.381/illustration-contact-normal-branch-vectors-doublet-vectors-wang.webp)
![Fig I-20 Porosity as functions of particle aspect ratios of Abreu’ work [75]](https://thumb-eu.123doks.com/thumbv2/123doknet/14599698.730979/41.892.267.627.102.394/fig-porosity-functions-particle-aspect-ratios-abreu-work.webp)
![Fig I-22 Simulated tests on loose and dense assemblies of Casagrande’s work [88]](https://thumb-eu.123doks.com/thumbv2/123doknet/14599698.730979/43.892.263.632.115.427/fig-simulated-tests-loose-dense-assemblies-casagrande-work.webp)
