HAL Id: hal-02322503
https://hal.archives-ouvertes.fr/hal-02322503
Submitted on 21 Oct 2019HAL is a multi-disciplinary open access archive for the deposit and dissemination of sci-entific research documents, whether they are pub-lished or not. The documents may come from teaching and research institutions in France or abroad, or from public or private research centers.
L’archive ouverte pluridisciplinaire HAL, est destinée au dépôt et à la diffusion de documents scientifiques de niveau recherche, publiés ou non, émanant des établissements d’enseignement et de recherche français ou étrangers, des laboratoires publics ou privés.
Optimized Continuous Application of Hyperpolarized
Xenon to Liquids
B. Niederländer, P. Blümler, T. Brotin, D. van Dusschoten, A. Offenhäusser,
H.-J. Krause, W. Heil
To cite this version:
B. Niederländer, P. Blümler, T. Brotin, D. van Dusschoten, A. Offenhäusser, et al.. Optimized Con-tinuous Application of Hyperpolarized Xenon to Liquids. Journal of Physical Chemistry A, American Chemical Society, 2018, 122 (48), pp.9359-9369. �10.1021/acs.jpca.8b09479�. �hal-02322503�
Optimized Continuous Application of
Hyperpolarized Xenon to Liquids
B. Niederländer
1,3, P. Blümler
1, T. Brotin
2,
D. van Dusschoten
3, A. Offenhäusser
3, H.-J. Krause
3and W. Heil*
1 1. Institute of Physics, University of Mainz, Germany2. Laboratoire de Chimie, ENS de Lyon, France 3. Forschungszentrum Jülich GmbH, Germany
Keywords:
129Xe, nuclear magnetic resonance, NMR, magnetic resonance imaging, hollow fiber membranes, compressor, transfer
Abstract:
In recent years, NMR with hyperpolarized (HP) xenon inside functionalized host structures (e.g. cryptophanes) have become a potential candidate for the direct observation of metabolic processes (i.e. molecular imaging). A critical issue for real applications is the dissolution of the HP-gas in the liquid which contains the host. In this work, we present recent developments for an improved and controlled dissolution of HP-Xe in liquids using hollow fiber membranes and different compressor systems. The designed apparatus consists of a compressor and a membrane unit. The compressor provides HP-129Xe continuously at small adjustable pressures and in a polarization-preserving way. The membrane unit enables a molecular solution of the HP-gas in aqueous liquids, avoiding the formation of bubbles or even foams. Two different types of compressors were tested in terms of function and useful materials. Special emphasis was put on a systematic reduction of transfer losses in the gas and liquid phase. In order to optimize the system parameters, several physical models were developed to describe the transport and the losses of nuclear polarization.
Finally, the successful implementation was demonstrated in several experiments. HP-Xe was dissolved in an aqueous cryptophane-A-(OCH2COOH)6 solution, and stable Xe signals could
experimental conditions enabled the study of chemical exchange of xenon between cryptophane and water environments even for a time-consuming 2D NMR-experiment. The good signal stability over the measurement time allowed an exact determination of the residence time of the Xe-atom inside the cryptophane, resulting in an average residence time of 42.9 ± 3.3 ms.
1. Introduction
129
Xenon-NMR is a well-established method to characterize microporous systems [1], surfaces [2] as well as biomolecules [3-5]. Xenon as a noble gas does not chemically react with the structures it explores, however, its wide chemical shift range of more than 300 ppm in NMR (nuclear magnetic resonance) spectra allows to distinguish physical adducts and adsorbates [6-8] selectively and sensitively. Furthermore, xenon dissolves in many liquids, allowing such studies also in solutions [9]. Unfortunately, its solubility in aqueous environments is rather low, often limiting the sensitivity of biochemical or medical applications. Nevertheless, such sensitivity problems can be partially alleviated by the use of so-called laser- or hyperpolarized (HP) 129Xe [10]. Hyperpolarized 129Xe is typically produced by spin-exchange optical pumping [10] and exhibits a spin polarization which is several orders of magnitude higher than in thermal equilibrium at common magnetic field strengths (5–25 T) and room temperature.
In recent years, dissolved xenon became a potential candidate for molecular imaging due to its affinity to functionalized host-molecules (e.g. cyclodextrines, cucurbiturils and cryptophanes) [11-13]. In the pioneering work of Pines et al. [14], cryptophanes were functionalized by biotin to detect certain proteins via the frequency shift of the HP-Xe NMR-signal when inside the cryptophane cage. However, dissolving a gas especially in biological liquids can be very challenging. The formation of bubbles during the process is very likely to cause stable foams. Despite the reduced liquid content in such foams, the gas/liquid interface can cause severe loss in spectral resolution due to the strong local gradients in magnetic susceptibility. Furthermore, the dissolution process has to be rapid and without significant depolarization of the HP-Xe. These problems can be overcome by using hollow-fiber membranes, as already used for clinical blood-oxygenation (i.e. in heart/lung machines) [15]. Such membranes act like nanoporous sieves where the gas/liquid interface is primarily provided by the interplay of surface tension and immiscibility of polymer and liquid. In this way the gas/liquid surface is tremendously increased while kept static. To maintain these conditions, however, the pressure
gradient at this gas/liquid interface must be kept low to avoid either liquid ingress into the membrane material or bubbling.
This membrane technique was introduced by Baumer et al. [15] and then used by Möller et al. [16,17] to enrich blood in mice with HP-Xe to be used a homologous contrast agent. A critical issue for the implementation of this concept is the dissolution of the HP-gas in bio-liquids. In this work, we present a device for fast, efficient, polarization-sustaining and continuous dissolution of hyperpolarized 129-Xenon in liquids via hollow-fiber membranes. A special focus was given to the possibility to add buffer gases to the HP-Xe and to continuous application at low pressures without high losses in polarization. The experimental setup is described in Section 2. The collected data and discussions are presented in Section 3, where the performance of the device is described. Its stability over long time is then demonstrated in several long lasting 2D-NMR experiments on HP-Xe exchange with cryptophanes. A model of polarization losses due to the field gradients via the HP-gas transfer between different magnetic fields is discussed in Appendix A.
2. Experimental Methods
2.1 Overview
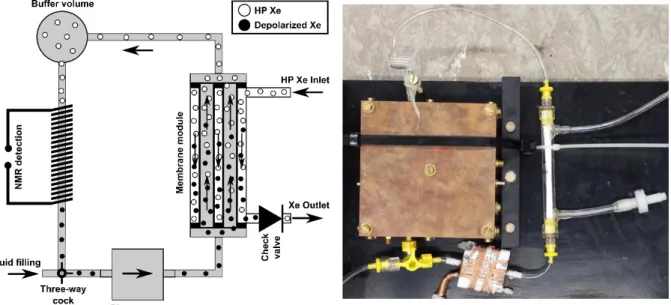
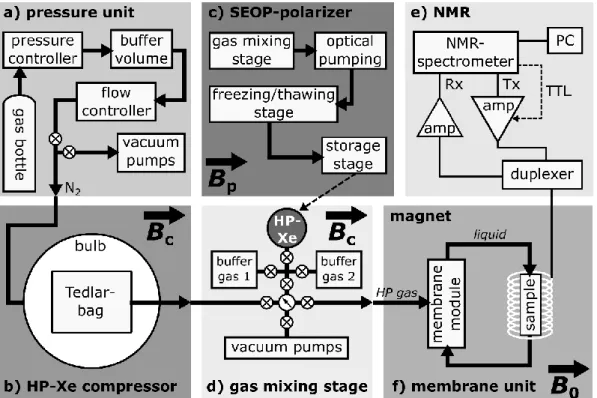
Before the essential new features of the setup are described in detail, a schematic overview of the entire experimental installation is illustrated in Fig. 1. The hyperpolarized 129Xe is produced in a home-built polarizer by spin-exchange optical pumping (Fig. 1c, a detailed description is found in [18]). Typical values for HP-Xe production by this instrument are 400 mbar.liter / hour with polarization levels of about 20% using 92% isotopically enriched 129 Xe-gas (NUKEM Isotopes GmbH, Alzenau, Germany). A system of glass-valves (Fig. 1d, Kontes HI-VAC, DWK Life Sciences LLC, Rockwood, USA) then allows admixing of buffer gases (e.g. for volume expansion or relaxation suppression [18]) and also connects a turbo pump for evacuation. Operating the compressor unit (Fig. 1b) in suction mode then allows subsequent filling the compressor’s volume with several gases (here HP-Xe and 4
He). This gas mixture is then continuously pressed into the membrane unit (Fig. 1f, membranes: Celgard X30-240, 3M Deutschland GmbH, Wuppertal, Germany) with a well-controlled overpressure in the order of a few mbars. A detailed description of the membrane module is given in the following section. The dissolution and detection part of the experiment was designed in a very compact way and included the NMR-excitation/detection circuit to reduce the distance between gas
dissolution and NMR detection. Finally, the latter part was placed inside the homogeneous part of an NMR magnet. Excitation and detection of the nuclear spins were conducted by a commercial NMR-spectrometer (Fig. 1e, KEA2 100 MHz, MAGRITEK, Aachen, Germany). Two magnet systems were used in this investigation. For simple optimization protocols, a home-built permanent magnet-system (B0 = 0.18 T over 70 mm gap) was used. The
homogeneity and field strength of this magnet was insufficient for spectroscopy experiments, which were therefore done at a special split-coil superconducting magnet at the Forschungszentrum Jülich (B0 = 1.5 T over a 500 mm gap).
All glass and metal parts that are in contact with the HP-gas were carefully cleaned by a Mucasol-solution (MERZ HYGIENE GmbH, Frankfurt, Germany), rinsed several times with water and backed out in a vacuum oven at 150°C. Plastic parts were treated identically but baked out at temperatures of about 100 °C.
Fig. 1: Schematic drawing of the setup separated into six functional units: a) pressure unit to control the compressor b) compressor (two types are used of which only the Tedlar bag compressor is shown) c) polarizer to generate HP-Xe [18] which is manually transported to d) (dashed arrow). d) Evacuation and gas mixing stage, f) NMR spectrometer, e) membrane unit to dissolve Xe in liquid and detect it via NMR inside the homogenous part of a magnet. See text for details.
2.2 Miniaturized Membrane Unit
While dialysis membranes [19] are swollen polymers which are semipermeable to separate molecules from a liquid carrier, oxygenation membranes simply increase the interface between gas and liquid phase in a controlled way. In this respect they act like a nano-size scaffold to reduce the individual interfaces per pore (see sketch in Fig. 2). The pore sizes should be as large as possible to achieve fast gas exchange but small enough to mechanically stabilize the interface. Besides the pore size, the essential parameter to avoid liquid-leakage into the gas-part is the contact angle between liquid and polymer1. The leakage pressures are typically in the range 20-40 bars and hence four orders of magnitude higher than the opposite leakage of gas (bubbles) into the liquid. Since such gas leakage is most critical in clinical applications to avoid clotting (causing embolism), the pressure difference on such membranes should not exceed 15 mbars on the gas side. This light over-pressure on the gas side is realized by a special compressor, which is described in the following section.
About 40 of such hollow-fiber membranes (outer diameter 244 µm, wall thickness 28 ± 2 µm, length 80 mm, effective pore size ca. 30 nm) are glued into a plastic container, which has LUER connectors on the lumen side (access to the inner membrane part) used for the liquid phase and on the outer part for the gas (cf. Fig. 3).
Figure 3 gives a schematic overview of the membrane unit and the NMR detection. The solution is circulated in counter-flow (with respect to the gas flow) through the lumen of the membranes by a piezo-pump (BPH-215E 230V, NITTO KOHKI GmbH, Steinenbronn, Germany). To reduce the volume, the entire membrane unit was miniaturized so that the total liquid volume amounts to ca. 4 ml. A small additional buffer volume was integrated for separation (collection and inspection) of possible gas bubbles. When the unit is operated under optimized conditions, this volume must stay free of gas over the time of the experiment. However, over a duration of several days, liquid is evaporating via the membranes and this lack (some µl) can be inspected and refilled via a three-way valvebelow the buffer volume. All connections were made from polyurethane tubing (4 mm PUN-H, FESTO GmbH, Esslingen, Germany) and standard LUER-connectors. The dissolution and detection part of the experiment was further compacted by integrating the NMR-excitation/detection circuit (solenoidal coil of dimensions: diameter: 10 mm, length: 55 mm, windings: 8, copper band: 5
1 The leakage pressure Δp
L of the liquid can be approximated by pL 4 cos / dP [20], where σ is the
surface tension, θ is the contact angle and dP is the pore diameter. This formula was derived for liquid inside a
mm) next to the membrane module (see Fig. 3). The tank circuit was tuned to the corresponding 129Xe-Larmor-frequency and matched to 50 Ω via non-magnetic variable capacitors (Tronser GmbH, Engelsbrand, Germany). Since we had no serious spatial restrictions, a second identical coil was placed and tuned to 1H by a separate tank circuit. This served as a convenient way to shim the magnetic field and adjust sequence parameters.
Fig. 2: a) Photo of the Celgard X30-240 hollow fiber membranes made of polypropylene and a microscopic picture of the pore structure [21]. b) Schematic representation of the membrane function. Due to the hydrophobic property of the polypropylene, aqueous solutions cannot wet the pores. The circular insert shows the contact angle (in red) between liquid and polypropylene (for water θ = 103° - 111° [22]). On the contrary, gases can pass the pores and a gas/liquid contact area is established at the ends of the pores. Here gas atoms diffuse into the liquid and are carried away by the liquid flow. This transfer is reversible.
Fig. 1: Miniaturized closed membrane unit consisting of a homemade membrane module (lumen side 1 ml), a buffer volume, a probe head with sampled volume of 0.7 ml and a nonmagnetic piezo-pump (max. pumping rate: 10 ml/min). 4 mm tubes connect all parts. The circuit has a liquid volume of around 3.6 ml.
2.3 Compressors
In this work we compare two types of compressors. The first compressor design was inspired by the work of Möller et al. [23]. Their principal design was copied and consists of a flexible (Tedlar-)bag inside a glass container bulb with adjustable pressure. The second is a pneumatic controlled piston compressor. Both compressors are always operated in homogeneous magnetic fields (either provided by air-coils or by placing them in the homogeneous region of super-conducting magnets).
2.3.1 Tedlar Bag compressor
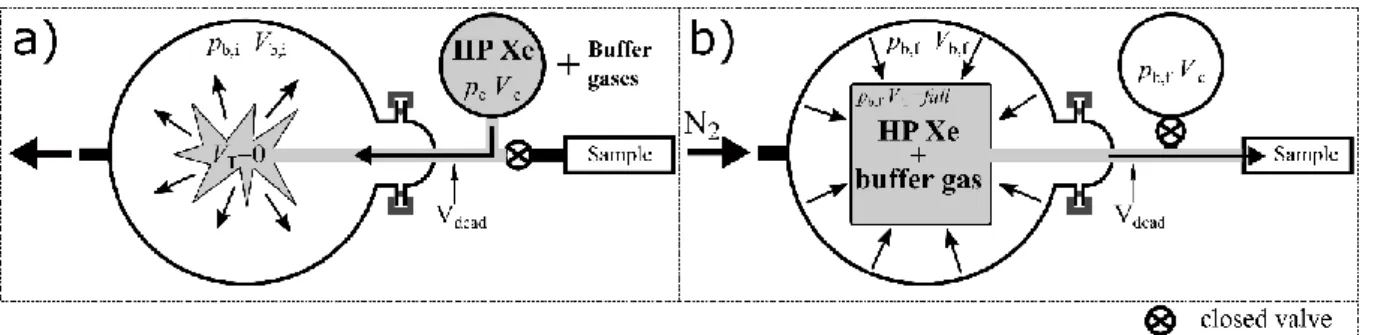
A Pyrex glass bulb of six liters served as a pressure vessel. The front of this bulb was equipped with a glass hood tightened via a 10 cm glass flange to allow for inserting the Tedlar bag (max. volume 1.6-liter). On this hood and the opposing side of the bulb, additional glass olives were attached for tube mounting (cf. Fig 4). The bag is directly connected via a passage to the valve system, the HP Xe reservoir, buffer gases (cf. Fig. 1d) and the membrane unit (Fig. 1f). The other olive allows to control the pressure inside the bulb and outside the bag via the pressure-unit (cf. Fig. 1a). Figure 4 illustrates the function of this compressor. Initially the glass bulb is kept at an overpressure causing a total collapse of the bag (Fig. 4a). When the gas is evacuated, the bag fills with HP-Xe (and possible buffer gases). Once the bag is full,
the HP-Xe can be released in a controlled way by again increasing the pressure inside the bulb (cf. Fig. 4b). The filling operation can be performed in two extreme ways. 1) The bulb-pressure is continuously reduced until the bag is completely filled. The filling level is inspected by eye and hence the entire filling process is rather slow and bears the risk of HP Xe depolarization. 2) Therefore, we preferred to set the initial pressure, pb,i, inside the glass
bulb to a predetermined value before venting. This speeds up the process and results directly in a filled Tedlar bag after pressure compensation. The initial pressure value can be simply obtained from the law of Boyle-Mariotte and the system parameters (p = pressure, V = volume, indices see Fig. 4)
b,i T c b,i c T c dead b,i V V V p V V V V p (1) Möller et al. describe the relaxation behavior of a deflating Tedlar bag in [23]. The longitudinal magnetization Mz(t) of HP Xe in such a collapsing bag of starting volume V(0) and constant surface ST is given by
T / ,0 bulk 1 (0) (0) ( ) (0) for S V z z t V Vt V M t M exp T V t V & & & (2) with ηT the relaxivity of Tedlar material, V& the gas flow, and T1bulk includes all relaxation
mechanisms except the wall relaxation.
Fig. 4: Operation principle of the Tedlar bag compressor. a) Initially HP Xe is stored in a spherical glass cell (GE180, inner diameter: 10 cm) and the Tedlar bag collapses (VT = 0). By
reducing the pressure in the glass bulb, the HP Xe is sucked into the bag until it is completely filled. b) By increasing the pressure inside the bulb again, the filled Tedlar bag is compressed in a controlled way and the HP gas continuously streams out towards the sample volume.
2.3.2 Pneumatically driven piston compressor
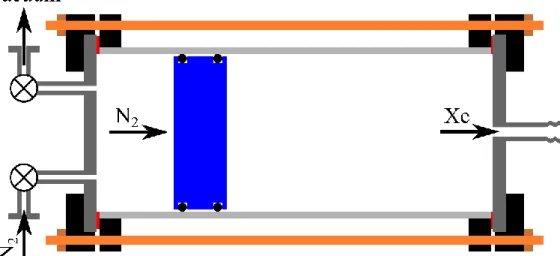
The Tedlar bag compressor has the main disadvantage that during compression, the volume permanently decreases while the surface stays constant. Hence, the surface-to-volume ratio continuously increases and with it the wall relaxation rate, causing severe depolarization towards the end of the operation. In order to reduce this effect, a cylindrical compressor with a piston was designed (cf. Fig. 5). The cylinder with an inner diameter of 10 cm (wall thickness 5.2 mm) and a length of 25 cm was made from Pyrex and sealed with 10 mm thick plates from the same material. Since the evenness of the cylinder is critical for a smooth operation, a high precision tube was used (precision: 0.04 mm, KPG pipe, DWK Life Sciences GmbH, Wertheim, Germany) and directly sealed at its cut edge using normal flat seal rings. The piston was made from aluminium and sealed with two O-rings versus the cylinder. The side which is in contact with HP-Xe was configured such that end caps from various materials could be attached and their relaxation behavior tested. We tried lamination with polyimide-film (Kapton, DuPont), window glass, oxygen-free copper, Tedlar and PTFE. Although Tedlar had the best properties, it was impossible to keep a film reliably attached. Therefore, Kapton as the second best material was chosen.
Fig. 5: Sketch of the pneumatically driven piston compressor. The compressor consists of a 25-cm long hollow glass cylinder (inner diameter 10 cm, light gray) separated in two parts by a piston (blue) which is doubly sealed by O-rings. Two circular glass plates seal the cylinder vacuum-tight (dark gray) and provide valves and olives for gas exchange. A constant pressure difference between the two separated sides moves the piston pneumatically. Additional threaded rods (orange) can be used to stabilize the system for high-pressure operation.
Another great advantage of this design is its pressure stability. It causes a simple and fast filling of the compressor with HP-Xe and buffer gases. This filling process was not done by moving the piston but rather placing it at the (left w.r.t. Fig. 5) end of the cylinder, evacuating the volume and then flushing it with the desired gases. This fast procedure reduces the polarization losses during the filling. Then the piston is moved forward by increasing the pressure on the other side (left side of Fig. 5) until the required pressure of the gas mixture is reached.
The relaxation behavior of this compressor is also dominated by wall relaxation. But now the surface, S(t), decreases together with the volume in a deterministic geometric ratio (in contrast to the Tedlar bag, where the surface is constant during the collapse).
2 0
piston cap piston cap
2 2
t
( ) V S S Vt wi h S S R
R R
S t & (3)
Here, R is the radius of the glass pipe and caps, and V0 is the starting volume (Spiston and Scap
are the surface of piston and front cap). Then the volume changes as
0 0 with ( )t Vt V V V V & t & , (4)
and V& is the gas flow. Thereby one obtains for the wall relaxation
pip 2 Wall 1 e piston cap 0 1 2 ( ) S R T V R V Vt & . (5)
Here ηpipe, ηpiston, and ηcap are the relaxivities of the pipe, the piston and the front cap. Then
the longitudinal magnetization, Mz, of the nuclear spins in a given (measurement) volume which is replenished by the collapsing piston compressor is then approximated by the following Bloch equation
pipe piston 2 bulk 1 ca 0 p 1 2 ( ) z z dM R M T R V Vt dt & , (6)
with the result
piston cap 2 pipe ( )/ 0 bulk 1 0 2 1 ( ) (0) exp R V z z V Vt M t M t T R V & & . (7).
2.4 Sample preparation
The water used in all experiments was deionized and degassed (by flushing it with N2 to
remove O2). As a specific host-structure for xenon, we used water soluble
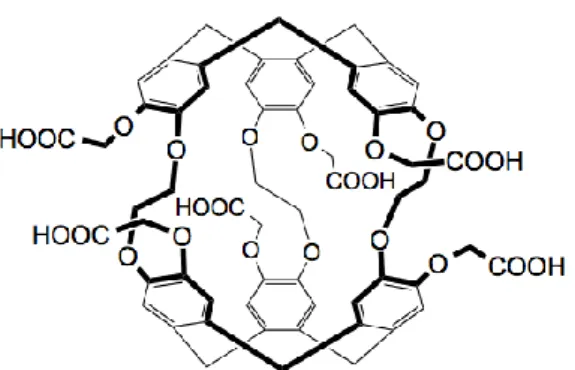
cryptophane-A-(Cr222(OCH2COOH)6 in the following abbreviated as “Cr”, see Fig. 6) as described in [24].
Since the highest solubility of Cr in water is achieved at a pH > 10, it was adjusted by titrating the solution with NaOH-solution controlled by a pH-meter. All chemical shifts of xenon are referenced to its gas peak at zero pressure.
Fig. 6: Scheme of the used water soluble cryptophane-A-(Cr222(OCH2COOH)6) shown as
crown-crown conformation.
3. Results and Discussion
3.1 Comparison of the compressors
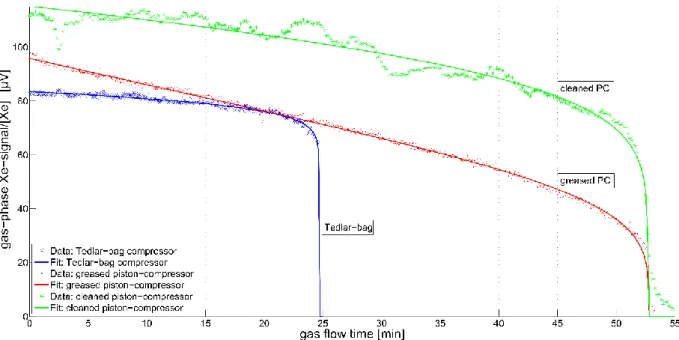
Figure 7 shows a direct experimental comparison of the two compressors by measuring the NMR-signal of the ejected gas-mixture (7 % HP-Xe in 4He) inside a fixed volume. Because it was difficult to reproduce exactly the initial amount of HP-Xe in the gas mixture (e.g. due to depolarization inside the compressors), the ordinate of Fig. 7 was calibrated by the percentaged Xe-amount in the gas mixture while the abscissa is the experimental time during which the gas was flowing at constant rate. The blue lower curve shows a typical result from the Tedlar bag compressor (V&= 40 ml/min, V0 ca. 1000 ml). Due to the lower start volume
and a higher gas flow, this curve ends much earlier. The lower initial amplitude (Xe-amount) is due to the higher depolarization of the HP-Xe during the much slower filling process compared to the piston compressor. However, the flat signal evolution during the first 20 min is a result of the extraordinarily low wall relaxivity of Tedlar. A fit of Eq. (2) describes the experimental data very well with the following parameters: free parameters: M0 = 83.45 ± 0.7
µV, V0 = 987 ± 1 ml, ηTedlar = 0.1381 ± 0.0024 cm/h; fixed parameters: [Xe] = 0.0688, T1bulk =
1210 min, V&= 40 ml/min.
The piston compressor (green top curve) on the other hand is much faster to fill and therefore starts with a much higher HP-Xe signal (polarization). Additionally it was filled with a higher start volume (V0 = 1500 ml) and therefore was operated at V&= 30 ml/min over almost twice
the time. However, the smoothness of the Tedlar bag compressor could not be reached. Several bumps in the data can be attributed to a non-steady movement of the piston through the cylinder. The green line is a best fit of Eq. (7) with the following parameters: free parameters M0 = 115.2 ± 0.1 µV, V& = 29.99 ± 0.01 ml/min, ηpipe = 0.0913 ± 0.0116 cm/h,
ηpiston+cap = 3.3364 ± 0.0343 cm/h; fixed parameters: [Xe] = 0.0694, T1bulk = 1202 min, V0 =
1580 ml. The fit curve shows a steeper signal decrease over the experimental time than for the Tedlar bag. This can be explained by the high relaxivity of the piston and glass cap (ηpiston+cap
= 3.3364 cm/h), which leads to an accelerated relaxation. Improvements of this parameter result in a significantly better performance; comparable to that of the Tedlar bag-compressor or even better.
In order to reduce the slip-stick behavior of the piston; we tried to lube the walls with a very thin film of standard silicone grease2. The middle, red curve shows the result of this experiment, where the bumps are removed, however at the cost of an increased wall relaxivity due to the grease. (fitting parameters for Eq. (7): free parameters: M0 = 96.3 ± 0.1 µV, V& =
29.76± <0.01 ml/min, ηpipe = 0.7801 ± 0.0181 cm/h, ηpiston+cap = 5.2104 ± 0.0588 cm/h; fixed
parameters: [Xe] = 0.0629, T1bulk = 1286 min, V0 = 1570 ml.).
A closer inspection of the fitting parameters in both systems highlights the systematic improvements of the setup compared to earlier work [23]. Working in homogeneous fields and using buffer gases [18] prolong T1bulk to ca. 20 h. This offers the possibility to measure
the wall relaxation with improved precision so that the relaxivity of materials can be determined. From this the depolarizing effect of an extremely thin layer of grease is clearly observed by an increase of ηpipe = 0.78 cm/h. The superior low relaxivity of Tedlar was also
confirmed this way.
Both compressor concepts show different advantages and disadvantages with respect to function and performance. Clearly the materials of the piston-compressor are more accessible and durable (Tedlar bags need to be replaced after a week of operation). Furthermore, it can handle higher pressures if required, it is generally more convenient to handle, and the loss of
HP-Xe polarization during the fast filling process is negligible. This allows for a very simple automation of the compressor system. On the other hand, slip/stick-problems are a common problem with piston compressors, which show up if the lubrication of the sealing O-rings is removed. This then causes fluctuations of pressure and signal. In grease-free operation, very high pressures are required for the piston feed (ca. 0.8 – 1.0 bar pressure difference), in contrast to the Tedlar bag, which requires only a few mbar pressure difference for a controlled HP-gas flow. On the other hand, the Tedlar bag ages, doesn’t withstand high pressures and has no deterministic surface/volume ratio.
Fig. 7: Delivery of HP-Xe gas from the two compressor types. The ordinate is normalized to the Xe-amount in the individual gas mixtures, while the abscissa is the operation time of the compressor. The blue points are the results from the Tedlar compressor. The blue curve is a best fit of Eq. (2) to the data. The green points are the data from the piston compressor equipped with degreased O-rings. A fit of Eq. (7) is shown by the green curve. The experiment and data treatment was repeated with greased O-rings and the results are shown in red color. All fitting parameters can be found in the text.
3.2 Measured transfer losses
A principal problem of experiments with HP-gases is that they are typically produced and stored at relatively low magnetic fields (ca. 1 mT) while they are often measured at high magnetic fields (> 1 T). Hence, the gas has to be transferred from one field to another and is
therefore exposed to field gradients in the order of several T/m. This transfer has to be done slow enough to stay in the adiabatic regime if the field additionally changes direction3 but fast enough to avoid serious depolarization due to relaxation via diffusion in inhomogeneous fields [18,25]. Leaving the adiabatic regime would cause spin-excitation, which can be ruled out for our low field magnet setup4 by assuming a gas speed that equals the corresponding speed of sound, resulting in an effective nutation angle below 5°.
The critical remaining task is therefore to bring the gas as fast as possible through the field gradient. Theoretically, a very thin tube would be best suited for this purpose (see Appendix A1, Eq. A.4), however a smaller diameter will also increase the surface-to-volume ratio and consequently increase the contribution of wall-relaxation. This interplay was approximated in appendix A1, suggesting that for gradients in the order of several T/m, wall-relaxation effects can be neglected if one stays in a laminar regime.
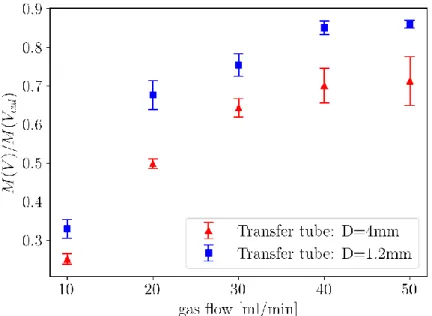
This theoretical result was investigated using two glass capillaries differing only in their inner diameter (Borosilica glass tubes of 60 cm length). The thinner tube had an inner diameter of 1.2 mm and the wider 4.0 mm. They bridged the locations of storage and detection and experienced an average gradient of 0.3 T/m over the length of the tube, with a maximum of 1.7 T/m towards the magnet entry. Both setups have to be compared in an equilibrium state at different gas flow rates. Establishing an equilibrium condition turned out to be quite time-consuming because the tubes were initially evacuated. Depending of the actual gas flow rate, the system needed at least 5 min to equilibrate. During this time, relaxation losses inside the compressor volume are not negligible, which makes a direct comparison of the detected signal amplitudes problematic. Since the model in appendix A1 suggests that depolarization losses are lowest at high gas flow rates, a calibration experiment was conducted prior to each experiment to which the data were normalized. This calibration was always performed by a measurement at the highest reasonable flow rate (V& = 100 ml/min for the thin tube and 200 cal ml/min for the thick one). In this way the actual polarization of HP-Xe in the compressor volume is probed.
Figure 8 shows the results of these experiment and clearly confirms the predictions of appendix A1, because the depolarization losses are always less for the thinner tube. The
3 For a gas flowing with an average velocity v
0 along a distance z0 over which the direction of the magnetic field
changes by 90° the term πv0/(2 z0) must be much smaller than the according Larmor-frequency.
4 In the low field setup, the magnetic field directions between storage and detection include an angle of 90°,
model in Eq. A.4 also qualitatively describe the graph in Fig. 8, however low flow rates are overestimated.
It should be noted that a third even thinner tube (ID = 0.8 mm) was tested, however this setup turned out to be impractical due to the enormous pressure drop over its length.
As a consequence of this investigation, only transfer tubing with an ID = 1.2 mm was used for the following experiments.
Fig. 8: Determination of the transfer losses in two 60 cm long glass tubes with two different inner diameters. The ordinate shows the detected NMR-signal normalized to a calibration run (see text for details). Red filled triangles show the data for a tube of 4 mm inner diameter and blue filled squares for a thinner tube with ID = 1.2 mm.
3.3 Long term measurement of the Xe-Cryptophane-complexes
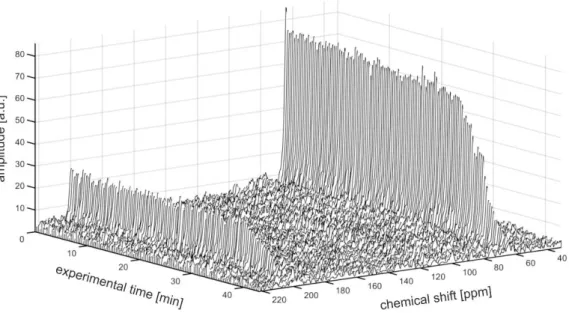
In order to test our setup under more realistic application conditions, the membrane unit was filled with an aqueous 2.4 mMolar Cr-solution and placed in the homogeneous part of a 1.5 T magnet. This field was chosen on purpose because it is a typical strength for clinical MRI scanners. The system also allows to bring the Tedlar bag-compressor and valve system close to the place of measurement by storing it inside one of the superconducting coils (length of transfer tube ca. 100 cm). The NMR-spectrum shows two distinct signals, one for Xe in water (Xe@H2O) at 199.5 ppm and Xe inside the Cr-cage (Xe@Cr) at 64 ppm.
The purpose of the first experiment was to test the long-term stability of Xe-supply to the liquid solution via our optimized compressor and membrane setup. For this 1.0 bar·liter of a
gas mixture with 12% HP-Xe (rest 4He) was filled in the Tedlar bag and constantly transferred to the liquid at a flow rate of V&= 30 ml/min. Figure 9 shows the acquired NMR-spectra versus experimental time. A very stable signal is observed over 35 min (ca. 10% signal loss over this duration due to relaxation) during which HP-Xe was constantly delivered to the solution. The final drop in intensity indicates the moment when the bag was empty.
Of course much longer supply times can be realized using larger reservoirs and higher HP-Xe amounts. A direct comparison to the earlier work of Cleveland et al. (cf. Fig. 4 in [16]) is difficult because this work was done in more inhomogeneous fields with smaller volumes and flow rates.
Fig. 9: Long-term run of HP-Xe delivered to a 2.4 mM cryptophane-A solution using the optimized setup described above. Shown is the NMR-spectrum versus the experimental time. The peak at 64 ppm is Xe@Cr while the smaller signal at 199.5 ppm stems from Xe@H2O. The signals drop only by ca. 10% due to relaxation until the Tedlar bag runs
empty at ca. 35 min. The NMR-signal is measured every 5 s and four times accumulated.
The high Xe@Cr-signal compared to the Xe@H2O-signal can be attributed to the strong affinity of cryptophane-A-(Cr222(OCH2COOH)6 to encapsulate xenon (binding constant:
Ka=6800 M-1 [24]). Due to the hydrophobicity of xenon, it prefers the lipophilic environment
immediately bound. Therefore, it can be assumed that almost all available cryptophanes5 are occupied by Xe atoms. For this reason, the Xe@H2O-signal would disappear, if the Cr
concentration in the solution exceeds the amount of dissolved Xe. The maximal solubility of Xe in a liquid is described by the Ostwald-coefficient. A list of Ostwald-coefficients can be found in [26]. On the other hand, the residence time of Xe in the cage depends on the size of the cavity and on the size of the entrance (see next section).
3.4 Chemical exchange in Xe-cryptophane-complexes
The high stability of the NMR-signal can be used for several applications. Given the system from the previous experiment, we decided to perform 2D exchange spectroscopy experiments during which the signal must be very stable to avoid artefacts. Although the exchange rate of Xe@Cr ↔ Xe@H2O can be tested in 1D selective saturation experiments [27] much easier, a
2D EXSY [28,29] must yield the same results and is therefore a valid test.
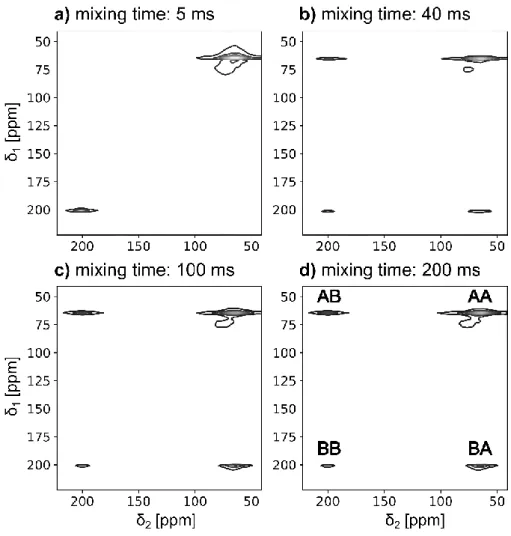
Using the identical setup as in the previous section, 2D-EXSY experiments were acquired with various mixing times. Each 2D-EXSY (32 encoding steps with an increment of 100 µs were measured, each 4 times accumulated with a 2-step phase cycle6, 2k data were recorded with time intervals of 100 µs, the experimental time was ca. 10 min for a complete hypercomplex data set). Four 2D-exchange spectra are shown in Fig. 10 which were subsequently acquired with mixing times τmix = 5, 40, 100, 200 ms yielding a total
measurement time of almost 50 min.
Exchange between the two chemical environments (i.e. Xe@Cr and Xe@H2O) manifests in
such 2D EXSY-spectra as off-diagonal or “cross-peaks”. Their relative intensity also reports the amount of atoms, which underwent the exchange process. For instance, in Fig. 10a such cross-peaks are almost absent due to the very short mixing time, and clearly show up for longer τmix.
If the diagonal peaks are referenced as AA or BB for those Xe-atoms which stayed in their environment during the mixing time; and those which went from A to B are labeled AB and
5 Cryptophane molecules can exist in different conformations, e.g. as crown-crown- and
crown-saddle-cryptophanes. But a Xe@Cr-complexation is only observable for the crown-crown structure (for more details see [24]).
6
The three 90° pulses had the following phase cycle
x x/
y y/
x x/
for the cosine-data set and
x x/
x x/
x x/
for the sine-data set. The detector was toggled
x x/
. See [30] for details.vice versa (cf. Fig. 10d), the ratio of the integrated intensities, I, of these peaks can then be used to calculate the exchange rates (k for Xe@Cr → Xe@H2O and k’ for Xe@H2O →
Xe@Cr) [30]. Here the fact that HP-Xe is continuously refreshed and no T1 relaxation is
observable on the time scale of τmix, is utilized to simplify the equations.
mix
tanh
mix
and
mix
tanh
mix
AB BA
AA BB
I I
k k
I I (8)
These ratios were extracted from the data of Fig. 10 and are displayed in Fig. 11. When Eqs. (8) are fitted to these ratios, the following values for the exchange times yield to k-1 = 44.5 ms ± 2.7 ms and k’-1 = 54.8 ms ± 10.7 ms. Both values are in good agreement with the independently determined values from similar systems [31].
Fig. 10: Four EXSY 2D spectra with mixing times of 5, 40, 100 and 200 ms displayed as contour plots. A represents a Cr-environment and B water. (see text for details)
Fig. 11: Normalized ratios of peak integrals versus mixing time. The blue triangles show the chemical exchange of xenon from the Cr-cage into the water and the red squares the opposite transfer. The lines are fits of eqs. 8.
5. Conclusions
The aim of this work was to design an optimized system which allows to dissolve HP-Xe in liquids continuously and with low polarization losses. Two different types of (Tedlar bag and piston) compressors were constructed and compared. As it turned out, the piston compressor is easier to fill and all xenon touching components are replaceable. Thereby, it has a higher flexibility in its operation parameters (size, pressure, flow rates) and appears more durable. Therefore, it can be used for material studies. However, it is prone to show slip-stick behavior, which was reduced by the use of grease, however at the cost of increased depolarization rates. The signal stability of the Tedlar bag compressor could not be achieved with the current design. Generally, it was clearly demonstrated that placing the gas storage, compressor and administration equipment in homogeneous fields and mixing it with buffer gases is advisable if relaxation studies are performed. Hence, we could improve the value of the relaxivity of Tedlar measured by Möller et al. [23] by a factor of three to ηTedlar = 0.1381 ±
0.0024 cm/h. Furthermore, we estimated the relaxivity of borosilicate glass on ηpipe = 0.0913
± 0.0116 cm/h which is consistent with the value for GE180 [18].
Another source of depolarization by transporting HP-gases through magnetic field gradients was also investigated. Here it was demonstrated that wall relaxation has only a marginal contribution, and the best strategy is to move the gas as quickly as practically possible through the gradients, i.e. to use tubes of very small inner diameter.
With this optimized setup, 35 min of continuous supply of a liquid through hollow fiber membranes was realized. This time was only limited by the size of the reservoir. The steady NMR-signal in solution was used for several 2D-exchange experiments which lasted in total 50 minutes. Therefore, this application technique simplifies the measurement procedure for fundamental investigations of Xe@Cr-complexes, like HYPER-CEST [32], which is essential for future biomedical applications.
In this way, it was clearly demonstrated that the setup can provide constant concentrations of HP-Xe over several minutes and a continuous supply is limited only by the reservoir size and the relaxation within.
4. Acknowledgements
The authors would like to thank Johannes Kochs (Research Center Jülich) for helping with the installation of polarizers, magnets and NMR-equipment. The glass blower, Rainer Jera, and the mechanical workshop at the Institute of Physics in Mainz are also acknowledged for making parts and pieces.
Appendix Mathematical Models
A.1 Model of transfer losses
The typical setup of a HP-Xe dissolution application is a storage volume of the compressor is placed in a separate homogenous field and is connected via a transfer tube to the dissolution and detection place which then is inside the NMR/MRI-magnet. Depending on the magnet design, stray fields etc. the length of the tube can vary. During the transfer the HP gas usually flows with a range of 5-50 ml/min through this transfer line passing necessarily locally changing magnetic fields.
In the following a model is developed which describes the depolarization effects during transfer of a HP-gas through a cylindrical tube of radius R in the presence of field gradients. Since the HP-gas flows with a certain velocity, vk, the longitudinal magnetization, Mz, is
considered as a function of space, z. Assuming that thermal magnetization can be neglected for a hyperpolarized sample, one obtains for the longitudinal Bloch equation,
1 1 ( ) d ( ) ( ) ( ) ( ) d ( ) ( ) z z z z k M z z t M z M z M z v z t T z z T z (A.1)
The relaxation time, T1(z), is also a function of space, because of the locally changing field
gradients
2
bulk wall dB bulk
1 1 1 1 1 ( ) 1 1 1 1 1 2 ( ) ( ) ( ) B z D T z T T T z T R B z v v v (A.2) where bulk 1
T contains all relaxation mechanisms excluding wall relaxation, wall 1
T , and the relaxation due to field inhomogeneity, dB
1
T , with D as the diffusion coefficient of the gas. With this the Bloch-equation (A.1) has the solution
2 bulk 1 0 ( ) ( ) 1 1 2 ( , ) (0) exp d z z k z k B z B z M z v M z D z v T R
v v v . (A.3)Here Mz(0) describes the spin magnetization before entering the transfer tube. Assuming a laminar and incompressible gas flow, the velocity distribution is described by the law of Hagen-Poiseuille, where all velocities have the same probability. In other words, each velocity transports the same amount of gas atoms through the cross section. For a numerical solution the maximum velocity, vmax 2 / (V& R2), is divided in nv equal parts and the
velocity in the kth tube section is then vk kvmax /nv with k
1,nv . The magnetization of at a position z is then given by2 max bulk 1 max 1 0 ( ) ( ) (0) 1 2 ( , ) exp d v z n v z z k v B z B z n M M z v z D z n kv T R
v v v , 2 2 bulk 1 1 0 ( ) ( ) (0) 1 2 ( , ) exp d 2 v z n v z z k v B z B z n R M M z V z D z n kV T R
v v v & & . (A.4)This equation numerically sums over the different residence times of the gas in the tube section at z due to a laminar velocity distribution. Hence Mz scales with a negative power of R with the practical consequence, that the thinner the transfer tube the lower the polarization losses. However, the flow rate is a function of the pressure difference p over the tube and the radius R V: & R4 p; i.e. if the radius is halved, the pressure between the inlet and outlet
of the transfer line must increase 16 times in order to keep the volume flow constant, which keeps a practical limit on the size of the radius.
5. References
[1] D. V. Soldatov, I. L. Moudrakovski, and J. A. Ripmeester, Angewandte Chemie-International Edition 43, 6308 (2004).
[2] D. Raftery, H. Long, T. Meersmann, P. J. Grandinetti, L. Reven, and A. Pines, Physical Review Letters 66, 584 (1991).
[3] S. M. Rubin, M. M. Spence, B. M. Goodson, D. E. Wemmer, and A. Pines, Proceedings of the National Academy of Sciences 97 9472 (2000 ).
[4] C. Landon, P. Berthault, F. Vovelle, and H. Desvaux, Protein Science 10, 762 (2001). [5] T. J. Lowery, M. Doucleff, E. J. Ruiz, S. M. Rubin, A. Pines, and D. E. Wemmer,
Protein Science 14, 848 (2005).
[6] C. J. Jameson, A. Keith Jameson, and S. M. Cohen, The Journal of Chemical Physics, 4540 (1970).
[7] C. J. Jameson, A. K. Jameson, and S. M. Cohen, Journal of Chemical Physics 59, 4540 (1973).
[8] T. Ito and J. Fraissard, Journal of Chemical Physics 76, 5225 (1982).
[9] R. H. Acosta, P. Blumler, K. Munnemann, and H. W. Spiess, Prog. Nucl. Magn. Reson. Spectrosc. 66, 40 (2012).
[10] T. G. Walker and W. Happer, Rev. Mod. Phys. 69, 629 (1997).
[11] Y. Q. Song, B. M. Goodson, R. E. Taylor, D. D. Laws, G. Navon, and A. Pines, Angewandte Chemie-International Edition in English 36, 2368 (1997).
[12] T. Meersmann and E. Brunner, Hyperpolarized Xenon-129 Magnetic Resonance (The Royal Society of Chemistry, Cambridge, 2015).
[13] G. Huber, F.-X. Legrand, V. Lewin, D. Baumann, M.-P. Heck, and P. Berthault, Chem. Phys. Chem. 12, 1053 (2011).
[14] M. M. Spence, S. M. Rubin, I. E. Dimitrov, E. J. Ruiz, D. E. Wemmer, A. Pines, S. Q. Yao, F. Tian, and P. G. Schultz, Proceedings of the National Academy of Sciences 98 10654 (2001 ).
[15] D. Baumer, E. Brunner, P. Blümler, P. P. Zänker, and H. W. Spiess, Angewandte Chemie International Edition 45, 7282 (2006).
[16] Z. I. Cleveland, H. E. Moller, L. W. Hedlund, and B. Driehuys, Journal of Physical Chemistry B 113, 12489 (2009).
[17] Z. I. Cleveland, H. E. Moller, L. W. Hedlund, J. C. Nouls, M. S. Freeman, Y. Qi, and B. Driehuys, Plos One 7, e31306 (2012).
[18] M. Repetto, E. Babcock, P. Blumler, W. Heil, S. Karpuk, and K. Tullney, Journal of Magnetic Resonance 252, 163 (2015).
[19] S. Laukemper-Ostendorf, H. D. Lemke, P. Blumler, and B. Blumich, Journal of Membrane Science 138, 287 (1998).
[20] E. L. Cussler, Diffusion, mass transfer in fluid systems (Cambridge University Press, New York, 1992), 2nd edn.
[22] L. Meagher and V. S. J. Craig, Langmuir 10, 2736 (1994).
[23] H. E. Möller, Z. I. Cleveland, and B. Driehuys, Journal of Magnetic Resonance 212, 109 (2011).
[24] G. Huber, T. Brotin, L. Dubois, H. Desvaux, J. P. Dutasta, and P. Berthault, J. Am. Chem. Soc. 128, 6239 (2006).
[25] G. D. Cates, S. R. Schaefer, and W. Happer, Phys. Rev. A J1 - PRA 37, 2877 (1988). [26] A. Cherubini and A. Bifone, Prog. Nucl. Magn. Reson. Spectrosc. 42, 1 (2003).
[27] G. Huber, L. Beguin, H. Desvaux, T. Brotin, H. A. Fogarty, J. P. Dutasta, and P. Berthault, J. Phys. Chem. A 112, 11363 (2008).
[28] K. Schmidt-Rohr and H. W. Spiess, Multidimensional Solid-State NMR and Polymers (Academic Press, 1994).
[29] S. Macura and R. R. Ernst, Molecular Physics 41, 95 (1980).
[30] M. H. Levitt, Spin Dynamics: Basis of Nuclear Magnetic Resonance (Wiley, 2011), 2nd edn.
[31] M. M. Spence, E. J. Ruiz, S. M. Rubin, T. J. Lowery, N. Winssinger, P. G. Schultz, D. E. Wemmer, and A. Pines, J. Am. Chem. Soc. 126, 15287 (2004).
[32] L. Schröder, T. J. Lowery, C. Hilty, D. E. Wemmer, and A. Pines, Science 314, 446 (2006).
![Fig. 2: a) Photo of the Celgard X30-240 hollow fiber membranes made of polypropylene and a microscopic picture of the pore structure [21]](https://thumb-eu.123doks.com/thumbv2/123doknet/14652674.737703/7.892.145.758.308.622/photo-celgard-hollow-membranes-polypropylene-microscopic-picture-structure.webp)