HAL Id: inria-00070430
https://hal.inria.fr/inria-00070430
Submitted on 19 May 2006
HAL is a multi-disciplinary open access
archive for the deposit and dissemination of
sci-entific research documents, whether they are
pub-lished or not. The documents may come from
teaching and research institutions in France or
abroad, or from public or private research centers.
L’archive ouverte pluridisciplinaire HAL, est
destinée au dépôt et à la diffusion de documents
scientifiques de niveau recherche, publiés ou non,
émanant des établissements d’enseignement et de
recherche français ou étrangers, des laboratoires
publics ou privés.
Evaluation of Meta-scheduler Architectures and Task
Assignment Policies for High Throughput Computing
Eddy Caron, Vincent Garonne, Andreï Tsaregorodtsev
To cite this version:
Eddy Caron, Vincent Garonne, Andreï Tsaregorodtsev. Evaluation of Meta-scheduler Architectures
and Task Assignment Policies for High Throughput Computing. [Research Report] RR-5576, LIP
RR-2005-27, INRIA, LIP. 2005, pp.13. �inria-00070430�
ISSN 0249-6399
ISRN INRIA/RR--5576--FR+ENG
a p p o r t
d e r e c h e r c h e
Thème NUMINSTITUT NATIONAL DE RECHERCHE EN INFORMATIQUE ET EN AUTOMATIQUE
Evaluation of Meta-scheduler Architectures and
Task Assignment Policies for High Throughput
Computing
Eddy Caron — Vincent Garonne — Andreï Tsaregorodtsev
N° 5576
Unité de recherche INRIA Rhône-Alpes
655, avenue de l’Europe, 38334 Montbonnot Saint Ismier (France)
Téléphone : +33 4 76 61 52 00 — Télécopie +33 4 76 61 52 52
Evaluation of Meta-scheduler Architectures and Task Assignment Policies
for High Throughput Computing
Eddy Caron, Vincent Garonne , Andreï Tsaregorodtsev
Thème NUM — Systèmes numériques Projet GRAAL
Rapport de recherche n° 5576 — May 2005 — 13pages
Abstract: In this paper we present a model and simulator for many clusters of heterogeneous PCs belonging to a
local network. These clusters are assumed to be connected to each other through a global network and each cluster is managed via a local scheduler which is shared by many users. We validate our simulator by comparing the experi-mental and analytical results of a M/M/4 queuing system. These studies indicate that the simulator is consistent. Next, we do the comparison with a real batch system and we obtain an average error of 10.5% for the response time and 12% for the makespan. We conclude that the simulator is realistic and well describes the behaviour of a large-scale system. Thus we can study the scheduling of our system called DIRAC in a high throughput context. We justify our decentralized, adaptive and opportunistic approach in comparison to a centralized approach in such a context.
Key-words: Simulation, Model, Multi-clusters platform, Meta-scheduling, Grid Computing
Évaluation d’architectures de Meta-ordonnanceur et politique de
distribution de tâches pour le calcul haute performance
Résumé : Dans cet article, nous présentons une modélisation et un simulateur de grands systèmes de calcul distribué.
Une telle plate-forme se compose de grappes de PCs hétérogènes appartenant à un réseau local inter-connectées entre elles par un réseau global. Ces grappes sont accessibles via un ordonnanceur local et sont partagées entre les util-isateurs. La confrontation du simulateur avec les résultats théoriques d’un système M/M/4 nous permet de conclure qu’il est analytiquement valide. Une deuxième confrontation avec un système batch réel, nous donne une différence moyenne de 10.5 % par rapport à la réalité pour les temps de réponse et de 12% pour le makespan. Notre simu-lateur est donc réaliste et décrit le comportement d’un système de batch réel. Fort de cet outil, nous avons analysé l’ordonnancement de notre système (appelé DIRAC) dans un contexte de calcul intensif. Nous avons justifié l’approche distribuée, adaptative et opportuniste utilisée dans notre système par rapport à une approche centralisée.
Évaluation of Meta-scheduler architectures ... 3
1
Introduction
In an institutional large scale system [5] resources are heterogeneous clusters which belong to a local network (LAN) and miscellaneous administrative domains. These clusters are shared between many users or virtual organizations [6] and a local policy is applied to each cluster which defines their access rights. This policy is applied through a resource management system, i.e. a batch system.
To aggregate theses clusters and manage the workload a global architecture must be defined paying special attention to the size of these systems. For example, in the High Energy Physics domain the envisaged size is around a hundred sites spread all over the world which is equivalent to 30,000 nodes. This domain also strongly favors high throughput [12], which attempts to maximize the number of jobs completed on a daily, or longer, basis. This is typical of situations where the supply of computational jobs greatly exceeds the available resources and jobs are generally not time critical. While batch systems are often used at the local level, there is no common solution in a global context. The DIRAC system has been developed to meet these requirements and provide a generic, robust grid computing environment. In this paper we propose an evaluation of the performances and the behavior of the DIRAC system in a high throughput
context. The paper is organized as follows: Section 2 presents the background; Section 3 discusses the DIRAC
architecture and main components; Section 4 presents the model used; while Section 5 discusses the simulation tool and section 6 descibes how it was tested; Section 7 shows the experimental setup; Section 8 the results and finally Section 9 finishes with conclusions and future plans.
2
Background
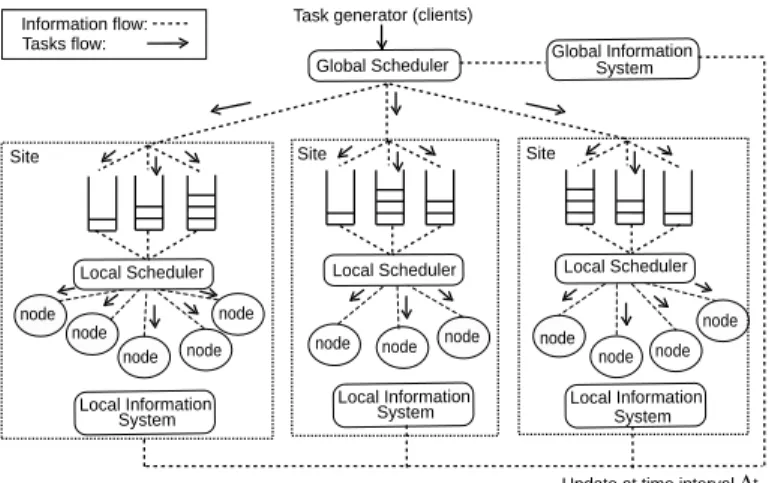
In a multi-site grid project [18,8,1], decisions are often taken with a global view of the system. The architecture in Figure1is composed of a centralized meta-scheduler and a centralized information system. This approach put in place as ’Push’ paradigm.
node node node node node node node node node node node Local Scheduler node Information flow: Tasks flow:
Task generator (clients)
Global Scheduler Global InformationSystem
Update at time interval ∆t System
Local Information Local InformationSystem
System Local Information Local Scheduler Local Scheduler
Site Site Site
Figure 1: Example of an architecture with centralized scheduling
In this model, the global information system keeps all the static and dynamic information about the system state in one place. Sensors deployed on the sites update the information by first querying the local information system and then updating their own information in the global information system. Ideally these updates are done whenever a change of state happens in the system which could, for example, be the arrival or end of a task. In fact, this solution often generates a message storm and needs some kind notification mechanism. The use of a period4t seems most
appropriate and stems the flow of messages.
Some studies [9] propose strategies which employ file queuing systems [10] whilst others [17] use simulation mechanisms like BRICKS [16]. Generally these work quite well but only in a simplified and unrealistic model. Thus far no project is able to manage the workload on more than a hundred sites and the problem of a multi-site system for high throughput computing has not yet been explored.
4 E. Caron , V. Garonne , T. Tsaregorodtsev
3
The DIRAC system
DIRAC (Distributed Infrastructure with Remote Agent Control) [7] has been developed by the CERN LHCb physics experiment to facilitate large scale simulation and user analysis. The DIRAC system has recently been used for an intensive physics simulation involving more than sixty sites, 90 TB of data, and in excess of one thousand 1 GHz processor-years. DIRAC is organized into a Service Oriented Architecture (SOA), with a number of independent services including monitoring and resource management.
3.1
The resource management system: The ’Pull’ paradigm
node node node node node node node node node node node Local Scheduler node Match-Maker Service global queues Information flow:
Tasks flow: Task generator (clients)
Local Scheduler Local Scheduler
Site agent Site agent Site agent
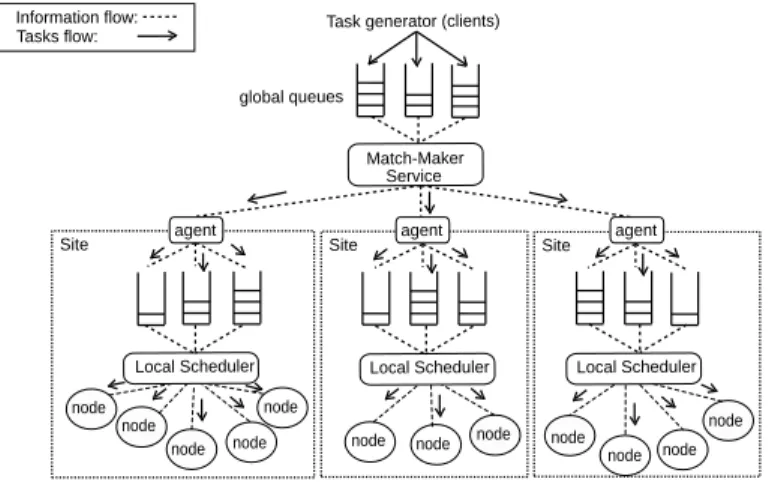
Figure 2: The DIRAC scheduling model.
Figure2illustrates the DIRAC scheduling model which deploys agents on the sites and uses central global queues.
DIRAC uses a ’Pull’ paradigm where agents demand a task if they detect free slots. Using the cycle-stealing paradigm
borrowed from global computing [14], tasks are only run when resources are not in use by the local users. DIRAC extends this concept to different computing resources by defining a criterion of availability. These resources could be anything from a simple PC to whole batch systems. As soon as a resource is detected to be available the dedicated agent requests tasks from thematch-makerservice. This is accomplished using the resource description which contains the dynamic and static information about the resource. Thematch-makerservice allocates tasks to resources by viewing the global job queues and using Classad matchmaking from the CONDOR project [12].
The Matchmaker compares one-on-one requirements performing a round-robin on each of the job queues until it finds a suitable job for a particular resource. This is an O(n) operation, which, in the worst case, would involve all n queued tasks in the system being checked once against the resource characteristics defined in the task request. This operation is independent from the total number of resources and the total number of tasks.
4
The performance model
LetC represent the set of clusters present in the multi-sites platform. Each cluster Ciowns a set of worker nodesNi
and belongs to a local domain, i.e. a LAN (Local Area Network). This local network describes a graph for the nodes. Each link of this graph has a local bandwidthbwtCiand a local latency latencyCi.
4.1
The topology
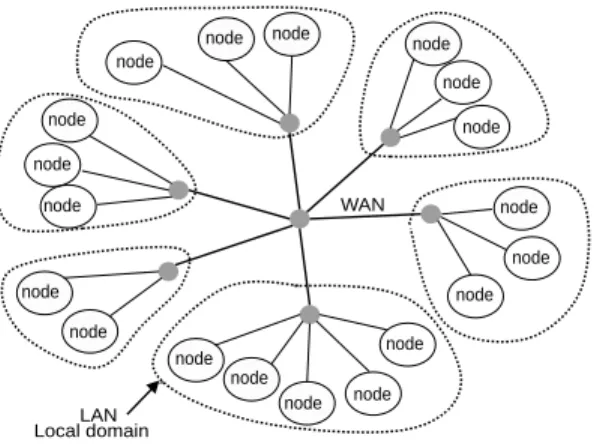
A clusterCiis connected to the global network or WAN (World Area Network) by a switch. Figure3describes this
topology with links having the same properties as previously mentioned. LetbwtC be the global bandwidth and
latencyCthe global latency.
Many different approaches exist to generate the right graph for the proposed model. Tools exist, such as ENV [15] to describe the characteristics of a real topology. Although there is not sufficient information to suggest that these tools
Évaluation of Meta-scheduler architectures ... 5 node node node node node node node node node node node node node node node node node node WAN node LAN Local domain
Figure 3: Example of a topology for a meta-scheduling platform.
scale well it was decided to use a generator topology. Some recent studies [13] show that networks follow specific power laws. The graph generator according to these laws are generally random, degree-based or hierarchical.
4.2
The node characteristic
Let (i, j) be the pair defines the jjthnode of clusterC
i. Each node (i, j) has a processor capacity capacityi,jand to
express this we define one computing unit, the NCU (Normalized Computing Unit). This unit is determined by special application benchmarking on different referential machines, taking into account the absolute time. So the capacity of a node is simply the total number of computing units able to be computed per unit time. We can then model the platform heterogeneity and define the average platform capacity ascapacitym= P 1
i∈Ccard(Ni)
P
i∈C,j∈Cicapacityi,j.
4.3
The workload model
We define two levels for the workload, local and global. The global workload corresponds to the tasks submitted to the metacomputing system, usually called meta-tasks. The local or background workload corresponds to tasks locally submitted to a cluster. A meta-taskmkis mapped locally to a simple taskk.
A typical taskk has four attributes : attributes={tlk,lengthk,prock,groupk} wheretlkis the local submission date,lengthkthe length expressed in NCU,prockis the total number of processors required for the task execution
andgroupk the organization who submits the task. A meta-taskmk is composed of the task properties sub-set and the global submission datetk. So we havemeta-attributesk={tk,attributesk}.
Modelling the workload for a metacomputing system involves determiningk for each task from the task set T then
submitting the attributesattributsk to a clusterCi. The meta-tasksmk of the set of tasks MT and their
meta-attributes are also submitted to the system. The methods used to generate a workload are the following: a randomize workload; a workload derived from real system traces and lastly a stochastic workload.
A random workload and, in the same way, a workload derived from a real system are not realistic. A workload derived is judged to represent too many platform dependant characteristic and so too specific. Instead, the stochastic workload is chosen here. Some works [11] studying computing centre traces propose a complete probabilistic model and so we writeS(T ) for the distribution function which generates the length set for a set of task T . Let CA
be the cut applied to this length set which fixes the maximal and minimal length. We also denote the distribution
function which generates the submission date set byA(T ) for a set task and finally the average submission rate
byλT.
4.4
The local model scheduling
At the local level, nodes of a same site are typically managed by a resource management system, e.g a batch system. Other implementations use queues which are defined by the characteristics of the task, for example, their length. Shared time scheduling between users is done by the local scheduler which would normally apply policies based on quotas or priorities. For a clusterCi, we can define a queues setQi. Each queue qi,jofQi is composed of a set of
6 E. Caron , V. Garonne , T. Tsaregorodtsev
nodes Nqi,j. Any particular node can belong to one or many queues. The tasks submitted to the site are then added to
these queues to wait for their execution. Subsequently, a queue qi,jwill contain a task setTi,l. We define the queue depth depthi,j = card(Ti,l) as the total number of tasks waiting in the queue a particular instant. The maximal time that a task could spend in execution on a node of the queueqi,jis denoted bytmaxi,j.
4.5
Measures and metrics
For a taskk, we define three following states: queued, running and done. The state queued means that a task is in a
waiting queue. When the task is executing it is in the running state and the done state signals that the task is completed.
The corresponding times for the changing states running, queued and done for a taskk are respectively rk, qk anddk. the local waiting time for a taskk is the execution beginning time minus the submission time rk− tlk. The execution time isdk− rk and the local response time isdk− tlk. For a meta-taskmk, we have a global waiting time which is the beginning execution time minus the global submission time,rk− tk. The global response time is
dk− tk.
For the set of meta-tasksMT , we define the average waiting time:
waitingm= 1 card(MT ) X k∈MT (rk− tk) (1)
the average execution time:
executionm= 1 card(MT ) X k∈MT (dk− rk) (2)
and the average response time:
responsem= 1 card(MT ) X k∈MT (dk− tk) (3)
We also define the makespan which is the full time to complete all the jobs inMT : makespan = max
k∈MT(dk) − mink∈MT(tk) (4)
5
Simulation tool
Simgrid [2] is a discrete event toolbox which allows the modelling and description of a platform for centralized, hierarchical or fully distributed scheduling. The improvements made to Simgrid are as follows:
A description platform module. Our simulator is interfaced with the hierarchical graph generator Tiers [4]. We have to specify the total number of WAN, LAN, nodes per LAN and the redundancy links. For the capacity information, we define a sample set of nodes where each node is weighted by a percentage. This percentage expresses the proportion of this node type present in the platform. The node NCU capacities and their weights are inspired by the performances obtained by DIRAC for a physics application on the production platform [3]. This platform was composed of more than 4,000 nodes and twenty different node configurations. Based on the total number of nodes and their proportions we generate the setP of all available capacity. Then for each node
we proceed by drawing lots in the setP and one occurrence of this value would be removed from the set P until
the capacity attribute is filled for all nodes.
A workload generator. Simgrid has already got an implementation of the task concept. In this model, however, the
meta-data is added e.g., the organization submitting tasks. The workload generator provides different probability density functions (p.d.f) like the Gamma law, Gaussian law and so on. To have a shared system we implement an agent per client or organization. The simulation tool allows one to simulate different system users. Therefore, it is possible to have different workloads submitted at the same time and evaluate their interactions.
A generic batch system. The basic entity at the local level is the batch system. As Simgrid does not provide a model
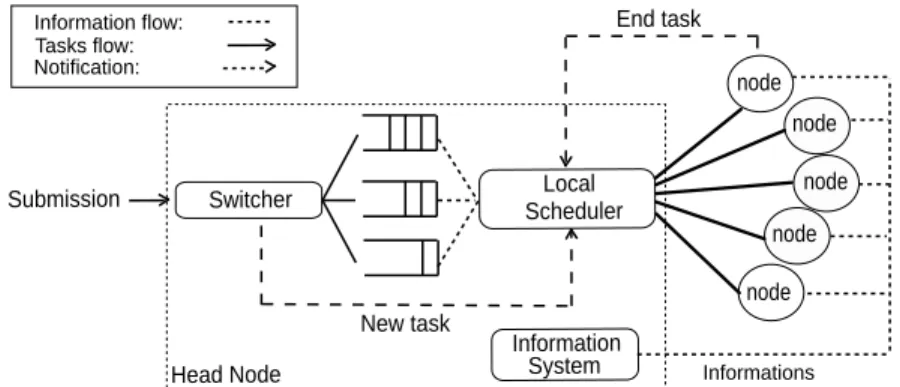
for this, a generic one has been implemented. The design is illustrated by Figure4.
Évaluation of Meta-scheduler architectures ... 7 Scheduler Local Submission Switcher System Information
Head Node Informations
New task End task node node node node node Information flow: Tasks flow: Notification:
Figure 4: The generic Batch system design.
A head node hosts the principal components: switcher, queues, information system and finally the local sched-uler. Each node communicates with the head node. A task submission is managed by the switcher which with regard the task requirements, places it in a queue and notifies the scheduler. This then queries the monitoring and accounting system to choose a candidate node. If no resource is available the task stays in the queue but once the task is sent to the node it is executed. After the task is completed, the scheduler is notified which triggers a cycle where the scheduler looks at the queues and determines if another task could be executed. The scheduler configuration is entered by file and includes properties such as the total number of queues, the availability or not of a node in a queue and the maximum number of tasks which could execute on a node.
The meta-scheduling architectures. Two kinds of global architectures were implemented. First the centralized
architecture outlined in Section2. Second the DIRAC architecture described in the Section3.
A monitoring and accounting system. For each simulation run the information relating to each task is recorded.
This helps the analysis of a particular strategy by facilitating the measures and metrics computation described in Section4.5.
6
Validation of the simulation tool
6.1
Analytical validation
For the theoretical validation, experiments were performed on M/M/m queuing systems [10].
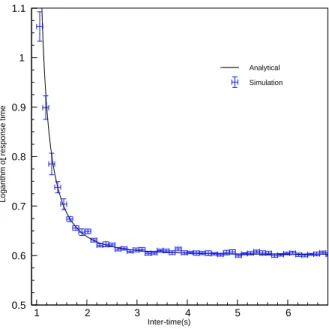
Figure5shows the response time differences between the simulated results and the analytical theory for a M/M/4 system. The service time average is four units time. The arrival rate follows an exponential law. The simulated responses are derived from 16 independent runs of 1,000 tasks and the root mean square error for all simulated arrival rates. The results obtained are consistent with theory.
6.2
Experimental Comparison
A dedicated and heterogeneous cluster was used, described in Table1.
A DIRAC agent was deployed on the cluster with a task generator put in place. This generator submits independent and sequential tasks with no communications. The submission times follow a Poisson law and the benchmark used was a program which implements a CPU consumed counter. It takes one parameter which is the number of CPU to consume before ending. This length is created for each task and follows a Weibull law. The response time and the waiting time are then captured by the DIRAC monitoring service. Then, we capture this workload to inject it in our simulator. To estimate the execution time according to the node capacity we normalize this time with the node NCU capacity. The NCU node capacity is determined by benchmarking, outlined in Table1. A simple topology is assumed where each node is connected to the head node by a simple link with 100 mega byte/s bandwidth and a null latency, as illustrated in Figure4.
8 E. Caron , V. Garonne , T. Tsaregorodtsev 0.5 0.6 0.7 0.8 0.9 1 1.1 1 2 3 4 5 6 Simulation Analytical Inter-time(s)
Logarithm of response time
Figure 5: Reponse time comparison between simulation and M/M/4 theory queueing system.
Attributes Values
Total number of nodes (card(Ni)) 3
Type PII PII PIII
Processor(MHz) 350 400 600
Memory(mo) 128 128 128
Capacity(N CU.s−1) 32.12 52.12 100.00
Scheduler openPBSv2.3
Politicy First Come First Serve(FCFS) Local Network Megabyte Ethernet Table 1: Platform caracteristics used for the simulation validation.
6.3
Results
The total number of tasks is 330, i.e. card(MT ) = 330. We observe for first instance an average error of 80% for
the response time as illustrated in Figure6(a). After a trace study we characterize two service times,µrecandµsend.
µrecis the service time between task arrival and task sending on a node or in queue andµsendis the necessary time
to notify the scheduler of a task completion. This large average error can be explained by the fact that the scheduler made its choice with a different system state view. The nodes are heterogeneous so the consequences are dramatic for the response time. We correct this error by including the service timesµrecandµsendmeasured on the real system
injected as traces. Then, we obtain exactly what we would expect in reality which validates the code. The experiment is then repeated by setting time services to constants. These constants are the average service time observed in reality (µrec= 3.75s, µsend= 2s). After this we observe an improvement in the average error of 10.5%. Figure6(b)shows
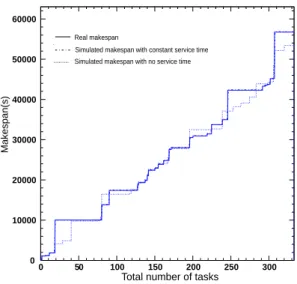
the makespan evolution versus the total number of tasks. For the constant service time, we see an average error of 12%. From this it is possible to conclude that at the local level the simulator is realistic. It is now possible to proceed to the strategies and meta-scheduling architectures evaluation. One further improvement could be to make the service timesµrecandµsenda distribution function approaching the real behavior.
Évaluation of Meta-scheduler architectures ... 9 0 25 50 75 100 125 150 175 200 0 1000 2000 3000 4000 5000 6000 7000 8000 9000
Average response time deviation (s)
Total number of task
Without service time With service time
(a) Deviation distibution for the response time (absolute value). 0 10000 20000 30000 40000 50000 60000 0 50 100 150 200 250 300 Makespan(s)
Total number of tasks Real makespan
Simulated makespan with no service time Simulated makespan with constant service time
(b) Makespan evolution vs. the number of tasks.
Figure 6: Comparison between simulation and a real batch system withµrec = µenv = 0 and µrec = constant,
µenv= constant.
7
Experimentals setup
The decentralized DIRAC architecture described in Section3and the centralized approach from Section2can now be compared. The message control size for both architectures is 30 KB in the simulation. The workload characteristics are inspired by an empirical study [11] and Table2summarises the platform parameters and workload attributes.
Parameters Notations Values
Platform
z
}|
{ Total number of sites card(C) 3
Total number of node per site card(Ni) 20
Total number of queue per site card(Fi) 1
Average node capacity capacitym 96 N CU.s−1
Local policy M/M/card(Ni)/FCFS FCFS
Maximal execution time tmaxi,j 24000s
Local/Global bandwith bwtC/bwtCi 1000 M bit/100 M bit
Local/Global latency latencyC,latencyCi 0s
W
orkload
z
}|
{ Task Type card(prock) 1
Length distribution S(Mt) → {lengthk} W eibull(α = 142.2, β = 0.45)
Length cut C(lengthk) 37300 < lengthk< 242800
Global
z
}|
{ Total number of task card(Mt) 500
Arrival time distribution A(Mt) → {tlk} P oisson(m = 0.05, s = 4)
Average inter-arrival 1/λMt 19s
Local
z
}|
{ Total number of task per site card(Ti) 500
Arrival time distribution A(Ti) → {tk} P oisson(m = 0.011, s = 4)
mean inter-arrival 1/λTi 87s
Table 2: Experiments parameters.
10 E. Caron , V. Garonne , T. Tsaregorodtsev
The associated DIRAC strategy is detailed in section3. The criterion of availability is expressed in5which implies that tasks in the waiting state scheduled on a computing resource should not exceed 30% of the total number of nodes.
depthi,j
card(Nqi,j)
< ε, e.g. ε = 0.3 (5)
The policy applied at the matchmaker level is that of FRFS( Fit Resource First Serve). That means that the first resource which matches well is chosen.
We also propose to evaluate the impact of the deployment in DIRAC. Let us consider two kinds of agent deploy-ment. The static approach is described in Section3whereas the dynamic approach is a concept similar to the resource reservation. After detecting the availability, the agent deployed on the site queries the match-maker to ask if tasks are available. In the case of a positive answer, it submits an agent wrapped in simple task to the cluster. Once the agent arrives at the node, it checks the node capacity and environment and creates the resource description accordingly. After that the agent queries a task from the match-maker. If no task is returned the agent dies. In the simple reservation mode ’Run Once’, the agent dies after the completion of the first task while in a ’filling’ mode it queries for one more task with respect to the available time.
The algorithm for the centralized scheduling is the following. At each task arrival the scheduler looks for the least loaded resource, i.e. the resourceqi,j from clusterCiwhich has the minimum measured depthdepthi,jwith∀i ∈ C
and∀j ∈ Fi.
Now we compare two approaches which strongly favour high throughput computing but the question is: what architectures and implementations could influence their performance?
8
Results
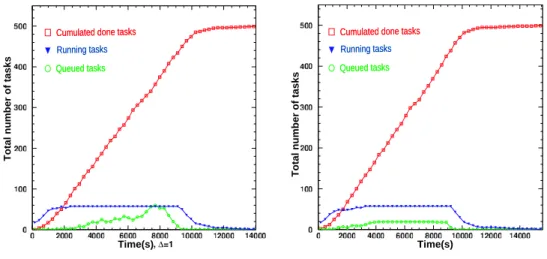
Figure7shows the evolution of total number of tasks in the state queued and running during the experiment. The third line is the done cumulated task curve.
Cumulated done tasks Cumulated done tasks
Running tasks
Running tasks
Queued tasks Queued tasks
Time(s)
Total number of tasks
(a) Centralyzed approach with4t = 0.
Time(s)
Total number of tasks
Cumulated done tasks Cumulated done tasks
Running tasks
Running tasks
Queued tasks Queued tasks
(b) DIRAC approach.
Figure 7: Tasks evolution vs. time in a dedicated platform.
The saturation phase gives us the platform maximal capacity which is equivalent to the sum of all nodes ,i.e.
P
i∈CNi, here 60. The two approaches saturate all resources but this is different in the DIRAC approach where the
evolution of the tasks in the queued state is constant (Figure7(b)).
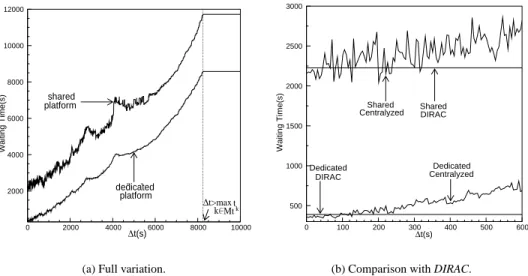
The Figure8shows the variation of the4t period versus average waiting time waitingmfor centralized scheduling
in first a dedicated context and then in a shared context. The DIRAC waiting times are qualitatively indicated because they are independent in philosophy from4t (Figure8(b)).
Évaluation of Meta-scheduler architectures ... 11 2000 4000 6000 8000 10000 12000 0 2000 4000 6000 8000 10000 Waiting Time(s) ∆t(s) platformshared platform dedicated ∆t>max k k Mtt
(a) Full variation.
500 1000 1500 2000 2500 3000 0 100 200 300 400 500 600 Waiting Time(s) DIRAC ∆t(s) DIRAC Centralyzed Dedicated Shared Centralyzed Shared Dedicated
(b) Comparison with DIRAC.
Figure 8: Average waiting time for meta-task vs. period4t for the centralized approach in a shared and a dedicated
context.
DIRAC does not use a central information service so does not depend on this period. For a4t less than 95 s, the
waiting time is better than the centralized scheduling in a dedicated context and performs better by around 60 s in the shared context. In the latter the performances rapidly degrade and a more chaotic effect is observed. The upper bound observed corresponds to the situation where all tasks are scheduled on the same site where4t > maxk∈Mttk.
Metrics and measures vs. Time(s)
0 5000 10000 15000 20000 25000 RT GWT LWT ET Decentralyzed Centralyzed
Decentralyzed with reservation Decentralyzed with reservation, mode filling
M: Makespan RT: Average Response Time GWT: Average Global Wait Time LWT: Average Local Wait Time ET: Average Execution TIme
M
(a) Strategies comparison for: centralized approach, DIRAC with a static deployment and the two DIRAC reser-vation mode simple and filling.
Demands rate vs. Time(s)
DIRAC, bin = 200 s
DIRAC with reservation, bin = 200 s
DIRAC with reservation, mode filling, bin = 200 s
(b) Traffic on the match-maker service vs. time for the three DIRAC strategies.
Figure 9: Results and caracteristics for strategies.
Figure9(a)compares the makespan as well as the local and global response times executed for the four evaluated strategies. For a null4t, the best makespan is obtained for the centralized approach although the smallest response
time came from the DIRAC approach in the filling reservation mode. The execution times are of the same order for all
12 E. Caron , V. Garonne , T. Tsaregorodtsev
strategies. This is explained by the platform characteristic that sites have the same capacity on average. The response time difference is mainly due to the local and global waiting time. The largest local waiting time is found with the static DIRAC scheduling however, the global waiting time in this situation is minimal.
In the case of DIRAC reservation the local waiting times are null because the matching is done directly from the node. The waiting time is expressed for the agents in this case. The effect of changing the deployment from static to dynamic gives a improvement of 10% for the average response time. The reservation mode filling nearly introduced a 50% improvement for the average response time in comparison with the centralized approach.
The graphs in Figure 9(b) illustrate the rate of tasks demanding the match-maker servicein the tree
DIRAC deployment mode with the static approach (top), the simple reservation (middle) and the ’filling’ reservation
mode (bottom).
During the platform initialization and at the experimentation end, the load is important on the service matchmakerin the static case. The total number of queries with the static approach is about 872 with about 699 for the dynamic case. We also establish that thethe match-makerload is more homogeneous for the dynamic case.
9
Discussion
In an ideal situation the centralized approach gives the best results but it is often impractical to assume that such a plat-form would stay stable. Common failures, by order of importance are: network failure; the disk quotas; unavailability of services; incorrect local configuration and finally power cut. With this large scope of error it is difficult to keep an ideal view of a global system. The scheduling is totally dependant on the information system performance and this system often does not scale well.
DIRAC bypasses this problem because one of the main characteristics is the total absence of a system global view.
It takes its decisions with a partial and global view. Each resource, in conjunction with its current state, gets an appropriate workload to suit its capacity. The tasks are put in a buffer where the scheduling event is an attribute of the resource availability which is the opposite to the centralized approach where the triggered event is a task submission.
If a platform deterioration occurs, any drawback from using the centralized approach is immediately paid back in term of performance. This effect is also more significant if the approach is combined with predictions. A rapid state change of a resource is taken into account only after a lapse of time in the centralized model. During this lapse in a high throughput context, the decisions made can be disastrous. Resource starvations and system information failures are also two main drawbacks which do not affect DIRAC, where all available resources are utilized immediately.
DIRAC demonstrates adaptability. This dynamic aspect forces scheduling in an opportunistic, reactive and
non-predictive way. On the other hand, the results are quite similar with the centralized scheduling. DIRAC is easy to implement, stable and flexible. It also facilitates resource reservation which can significantly increase performances. Nevertheless it must be said that technically this improvement required direct communication with worker nodes. Within DIRAC passive communication mode relaying of outbound connectivity is used to accomplish this.
The reservation mode causes a higher and more regulated load onthe match-maker service. This penalty for this improvement is the huge number of agents which abort right after the non-task answer (299 in our case which is non-negligible).
10
Conclusion and future works
In this paper we propose a model for a meta-scheduling platform. We measure an average error of 12% for the makespan prediction. With this tool it is demonstrated that a centralized approach is better than a decentralized approach in term of performances for high throughput computing. However, this happens only in the ideal case where the update period is quasi null. Above 95s in a dedicated context, the ’pull’ approach had similar results and importantly was more stable. The same observation is made in a shared context. The ’pull’ approach also provides an abundance of scenarios which allow a performance enhancement the of just under fifty percent compared to the centralized approach. This was most evident with resource reservation. It will be interesting to study the impact of the migration from site to site with regard to their local workload. The criterion for optimizing the scheduling is specific to the application itself, therefore, since many applications are executed concurrently on the same platform, grid scheduling must be done with a multi-criteria scheduling approach. Future work will be into the study of this aspect.
Évaluation of Meta-scheduler architectures ... 13
Acknowledgment
We gratefully acknowledge Stuart Paterson for helping to prepare this document.
References
[1] Abhijit Bose, Brian Wickman, and Cameron Wood. Mars: A metascheduler for distributed resources in campus grids. In GRID ’04: Proceedings of the Fifth IEEE/ACM International Workshop on Grid Computing (GRID’04), pages 110–118, Washington, DC, USA, 2004. IEEE Computer Society.
[2] H. Casanova. Simgrid: A toolkit for the simulation of application scheduling. In Proceedings of the First
IEEE/ACM International Symposium on Cluster Computing and the Grid (CCGrid 2001), Brisbane, Australia,
15-18May 2001.
[3] J. Closier and al. Results of the lhcb experiment data challenge 2004. In CHEP’04, Interlaken, November 2004. [4] Doar. A better model foor generating test networks. In IEEE GLOBECOM, 1996.
[5] I. Foster and C. Kesselman, editors. The Grid: Blueprint for a New Computing Infrastructure. Morgan-Kaufmann, 1998.
[6] Ian Foster. The Anatomy of the Grid: Enabling Scalable Virtual Organizations. Lecture Notes in Computer
Science, 2150, 2001.
[7] Garonne, V. and Stokes-Rees, I. and Tsaregorodsev, A. DIRAC: A Scalable Lightweight Architecture for High Throughput Computing. In Grid 2004, 5th IEEE/ACM International Workshop on Grid Computing, November 2004.
[8] V. Hamscher, U. Schwiegelshohn, A. Streit, and R. Yahyapour. Evaluation of job-scheduling strategies for grid computing. In Proceedings of the First IEEE/ACM International Workshop on Grid Computing, pages 191–202. Springer-Verlag, 2000.
[9] Ligang He, Stephen A. Jarvis, Daniel P. Spooner, and Graham R. Nudd. Optimising static workload allocation in multiclusters. In IPDPS, 2004.
[10] L. Kleinrock, editor. Queueing Systems Volume I : Theory. John Wiley and Sons, 1975.
[11] Hui Li, David Groep, and Lex Walters. Workload characteristics of a multi-cluster supercomputer. In Job
Scheduling Strategies for Parallel Processing. Springer-Verlag, 2004.
[12] Miron Livny, Jim Basney, Rajesh Raman, and Todd Tannenbaum. Mechanisms for high throughput computing.
SPEEDUP Journal, 11(1), June 1997.
[13] D. Lu and P. Dinda. Synthesizing realistic computational grids. In Proceedings of ACM/IEEE SC 2003, 2003. [14] [email protected]://setiathome.ssl.berkeley.edu/.
[15] G. Shao, F. Berman, and R. Wolski. Using effective network views to promote distributed application perfor-mance. In Proceedings of the 1999 International Conference on Parallel and Distributed Processing Techniques
and Applications, 1999.
[16] A. Takefusa. Bricks: A performance evaluation system for scheduling algorithms on the grids. In JSPS Workshop
on Applied Information Technology for Science, 2001.
[17] Atsuko Takefusa, Satoshi Matsuoka, Henri Casanova, and Francine Berman. A study of deadline scheduling for client-server systems on the computational grid. In HPDC ’01: Proceedings of the 10th IEEE International
Symposium on High Performance Distributed Computing (HPDC-10’01), page 406. IEEE Computer Society,
2001.
[18] S. Vadhiyar and J. Dongarra. A metascheduler for the grid. In Proceedings of the 11th IEEE Symposium on
High-Performance Distributed Computing, 2002.
Unité de recherche INRIA Rhône-Alpes
655, avenue de l’Europe - 38334 Montbonnot Saint-Ismier (France)
Unité de recherche INRIA Futurs : Parc Club Orsay Université - ZAC des Vignes 4, rue Jacques Monod - 91893 ORSAY Cedex (France)
Unité de recherche INRIA Lorraine : LORIA, Technopôle de Nancy-Brabois - Campus scientifique 615, rue du Jardin Botanique - BP 101 - 54602 Villers-lès-Nancy Cedex (France)
Unité de recherche INRIA Rennes : IRISA, Campus universitaire de Beaulieu - 35042 Rennes Cedex (France) Unité de recherche INRIA Rocquencourt : Domaine de Voluceau - Rocquencourt - BP 105 - 78153 Le Chesnay Cedex (France)
Unité de recherche INRIA Sophia Antipolis : 2004, route des Lucioles - BP 93 - 06902 Sophia Antipolis Cedex (France)
Éditeur
INRIA - Domaine de Voluceau - Rocquencourt, BP 105 - 78153 Le Chesnay Cedex (France) http://www.inria.fr