HAL Id: hal-01860254
https://hal.archives-ouvertes.fr/hal-01860254
Submitted on 23 Aug 2018HAL is a multi-disciplinary open access archive for the deposit and dissemination of sci-entific research documents, whether they are pub-lished or not. The documents may come from teaching and research institutions in France or abroad, or from public or private research centers.
L’archive ouverte pluridisciplinaire HAL, est destinée au dépôt et à la diffusion de documents scientifiques de niveau recherche, publiés ou non, émanant des établissements d’enseignement et de recherche français ou étrangers, des laboratoires publics ou privés.
Measuring Motional Dynamics of [(CH 3 ) 2 NH 2 ] +
in the Perovskite-Like Metal–Organic Framework [(CH 3
) 2 NH 2 ][Zn(HCOO) 3 ]: The Value of Low-Frequency
Electron Paramagnetic Resonance
Sylvain Bertaina, Nandita Abhyankar, Maylis Orio, Naresh Dalal
To cite this version:
Sylvain Bertaina, Nandita Abhyankar, Maylis Orio, Naresh Dalal. Measuring Motional Dynamics of [(CH 3 ) 2 NH 2 ] + in the Perovskite-Like Metal–Organic Framework [(CH 3 ) 2 NH 2 ][Zn(HCOO) 3 ]: The Value of Low-Frequency Electron Paramagnetic Resonance. Journal of Physical Chemistry C, American Chemical Society, 2018, 122 (28), pp.16431 - 16436. �10.1021/acs.jpcc.8b04698�. �hal-01860254�
Measuring Motional Dynamics of (CH
3
)
2
NH
2
+in
the Perovskite–like Metal-Organic Framework
[(CH
3
)
2
NH
2
][Zn(HCOO)
3
]: The Value of
Low-Frequency EPR
Sylvain Bertaina1*, Nandita Abhyankar2, Maylis Orio3, Naresh S. Dalal2,4*
1. Aix-Marseille Université, CNRS, IM2NP UMR 7334, 13397 Marseille Cedex 20, France. 2. Department of Chemistry & Biochemistry, Florida State University, 95 Chieftain Way, Tallahassee Florida 32306, United States.
3. Aix Marseille Université, CNRS, Cent. Marseille, iSm2, 13397 Marseille Cedex 20, France.
4. National High Magnetic Field Laboratory (NHMFL), 1800 East Paul Dirac Drive, Tallahassee, Florida 32310, United States.
Corresponding Authors
sylvain.bertana@im2np.fr dalal@chem.fsu.edu
ABSTRACT: Dimethylammonium zinc formate (DMAZnF) is the precursor for a large family of multiferroics, materials which display co-existing magnetic and dielectric ordering. However, the mechanism underlying these orderings remains unclear. While it is generally believed that the dielectric transition is related to the freezing of the order-disorder dynamics of the dimethylammonium (DMA+) cation, no quantitative data on this motion are available.
We surmise that this is due to the fact that the timescale of this cationic motion is on the borderline of the timescales of experimental techniques used in earlier reports. Using multifrequency EPR, we find that the timescale of this motion is ~ 5 x 10 -9 s. Thus, S-band (4
GHz) EPR spectroscopy is presented as the technique of choice for studying these motional dynamics. This work highlights the value of the lower-frequency end of EPR spectroscopy. The data are interpreted using DFT calculations and provide direct evidence for the motional freezing model of the ferroelectric transition in these metal-organic frameworks with the ABX3
perovskite-like architecture.
1 - INTRODUCTION
During the last decade or so, there has been considerable research interest in the family of metal-organic framework (MOF) compounds with the general perovskite formula ABX3,
because of their structural versatility and potential applications1–6. A particularly popular class
of such MOFs consists of formate frameworks5–9 with the general formula [A][M(HCOO) 3].
Here, A+ is a molecular cation such as the dimethylammonium ([(CH3)2NH2+]) or DMA+ cation,
and M2+ is a 3d transition metal cation. Like their inorganic counterparts, such as SrTiO
3,these
MOFs exhibit two primary, spontaneous, and switchable internal domain alignments in the same phase: the alignment of electric polarization, as seen in ferroelectrics, and the alignment of magnetization, as seen in ferromagnets. More importantly, their electric polarization can be reversibly switched by an external magnetic field and the magnetization altered reversibly by
an external electric field1. It has been emphasized in earlier reviews1–4 that in order to optimize
their device potential, it is important to obtain a deeper understanding of the molecular interactions that underlie their ferroelectric and ferro(antiferro)magnetic phase transitions. In this regard, it is known that for these MOFs, the motional dynamics of the A+ cation seem to
play a pivotal role in driving the structural, ferroelectric transition6–10. In the high-temperature,
paraelectric phase, the A+ molecular unit, which possesses an axis of three-fold symmetry,
appears to be dynamically disordered over three possible orientations5–8 . The phase transition
coincides with the loss of this three-fold symmetry, as suggested by X-ray diffraction5–7,
neutron scattering11, and IR12 , Raman12,13 , EPR14–17 and NMR18,19 spectroscopies. However,
none of these techniques has provided a quantitative estimate of the correlation time or frequency of motion of the DMA+ cation, a much sought-after datum in the phase transition
model of these MOFs.
This report presents a variable frequency EPR study aimed at measuring the timescale of motional dynamics of the A+ cation [(CH
3)2NH2]+ in dimethylammonium zinc formate,
[(CH3)2NH2]Zn(HCOO)3, henceforth referred to as DMAZnF. This sample was chosen because
in this family of MOFs,7,8 DMAZnF was the first compound shown to exhibit a dielectric
transition. It has now been confirmed to be a ferroelectric below the dielectric phase transition8,9,20 .
DMAZnF displays a first-order structural phase transition at about TC=170K. X-ray
diffraction reveals that at high temperature (HT), the compound exists in the trigonal R3c phase while at low temperature (LT), its structure belongs to the monoclinic noncentrosymmetric Cc space group10. Despite this structural phase transition, the global structure does not change
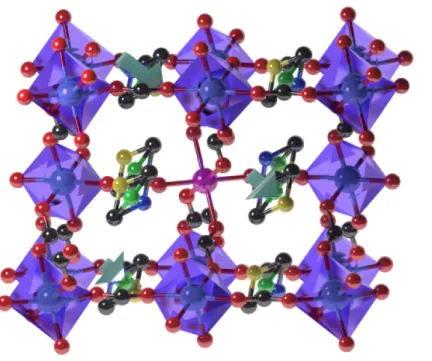
significantly. Figure 1 shows the crystal structure of DMAZnF in the HT phase. The Zn(HCOO)3- subsystem, in which the Zn2+ ions are connected through the formate groups,
forms a cage in which the DMA+ cations are located. The symmetry of the HT phase allows the
nitrogen atom to occupy one of three equivalent positions. In Figure 1, we have differentiated these positions by three colors: yellow, green, and blue. The nitrogen continuously moves between these three positions (as represented by the round arrow). The position of any DMA+
ion is independent of the positions of the neighboring DMA+ ions in the paraelastic/paraelectric
phase. The symmetry of the LT phase (Figure SI1) allows only one position for the N atom. In the LT ferroelastic/ferroelectric phase, DMA+ cations are ordered in a checkerboard
arrangement, with alternate DMA+ cations pointing in slightly different directions.
Electron paramagnetic resonance (EPR) spectroscopy is the tool of choice to probe the anisotropy and crystal field effects acting on paramagnetic ions. In particular cases, it is also possible to probe the fluctuation of the crystal field in time. In this paper, we focus only on the HT phase (T>170K), in which the DMA+ cations are thought to undergo hindered rotational
reorientations between three equivalent sites within the zinc formate cage. In order to perform EPR experiments, we have doped the DMAZnF (diamagnetic) with a small (~ 0.1 mole %) amount of Mn2+, which acts as a paramagnetic probe of crystal-field fluctuations due to the
motion of the DMA+ cations around it. Thus, the timescale of the motion of DMA+ can be
measured via the Mn2+ spin probe.
We show that the lack of measurements of the timescale of motional dynamics of DMA+ can
be ascribed to the fact that this motional timescale falls well below the timescales of optical-IR spectroscopy and neutron scattering, which are techniques used in earlier studies of these materials. As detailed below, this timescale falls in the range of the rarely used low-frequency (~ 4 GHz) S-band EPR technique. The obtained data, supplemented by theoretical modeling (DFT calculations), provide strong support for the dynamic behavior of the DMA+ cation and
Figure 1: Schematic representation of Mn2+-doped DMAZnF in the HT phase. The nitrogen
atom in DMA+ can occupy one of three equivalent positions, as represented by three different
colors (dark blue, yellow, and green). The reorientation of DMA+ is thermally activated,
resulting in hindered rotation between these three positions. To probe the effect of this motion by EPR spectroscopy, Zn2+ (light blue) was replaced by Mn2+ (pink) at a nominal concentration
of 0.1%. Oxygen atoms are shown in red and carbon atoms are shown in black. Hydrogens have been omitted to simplify the presentation. The structure of the LT phase is presented in Fig SI1.
2- EXPERIMENTAL DETAILS:
Synthesis: Single crystals of DMAZnF were grown by solvothermal methods reported previously. A reaction mixture containing 1 mmol anhydrous ZnCl2, 6 mL DMF, and 6 mL
deionized H2O was spiked with trace amounts of MnCl2. The exact amount of Mn in the final
diphenylpicrylhydrazyl (DPPH), the amount was assessed as less than 1 mole % in the final product. The mixture was heated overnight in a Teflon-lined autoclave. The solution was gradually cooled over a few hours, and the supernatant was set aside to crystallize. Over a period of a few days, block-like single crystals with dimensions of 1-3 mm were obtained.
Single crystal diffraction: Single crystal X-ray diffraction was employed to confirm the crystal structure and the relationship between the external morphology and unit-cell and crystal axes. Figure 1 shows a schematic of the pseudocubic crystal structure of DMAZnF, with eight Zn ions at the corners of the cube and the DMA+ cation at the center. As is known, DMAZnF
undergoes a paraelectric-to-ferroelectric phase transition at TC = 166 K, with a hysteresis of
less than 1 K, in agreement with our heat capacity studies7. In the currently accepted model of
the ferroelectric transition, at T > TC,the DMA+ cations are dynamically disordered between
three positions, with 1/3rd site occupation at each position, as depicted in Fig. 1. At T C, the
dynamic disordering ceases and the DMA+ cations become ordered. As mentioned in the
Introduction, despite several studies using neutron scattering and IR, Raman, EPR and NMR spectroscopies, it has not been possible to pin down the actual timescale or frequency of the order-disorder dynamics of the DMA+ cation. This issue provided the main motivation for the
present undertaking.
EPR spectroscopy:
EPR experiments were performed using three conventional Bruker spectrometers operating at S-band (E600 - 4 GHz), X-band (EMX - 9.6 GHz), and Q-band (E600 - 34 GHz), respectively. The sample was mounted on a suprasil rod and its orientation was measured using a goniometer. All measurements were performed with H//[102] axis. The temperature was varied from 300K to 170K (the phase transition temperature), using an Oxford ITC temperature
controller. 10 min were allowed for stabilization at each temperature. Magnetic field modulation associated with lock-in detection was employed, resulting in the derivative of the signal. All measurements were carried out with the static field H perpendicular to the (012) face of the crystal. It is noted that the sensitivity of the S-band spectrometer is about an order of magnitude lower compared to those at X and Q-band. Therefore, the signal-to-noise ratio is correspondingly worse in the S-band spectra.
3- COMPUTATIONAL DETAILS
All theoretical calculations were based on the Density Functional Theory (DFT) and were performed with the ORCA program package21. To facilitate comparisons between theory and
experiments, all DFT models were obtained from the experimental X-ray crystal structures, and were optimized while constraining the positions of all heavy atoms to their experimentally derived coordinates. Only the positions of the hydrogen atoms were relaxed because these are not reliably determined from the X-ray structure. Geometry optimizations were undertaken using the GGA functional BP8622–24 in combination with the TZV/P25 basis set for all atoms
and by exploiting the resolution of the identity (RI) approximation in the Split-RI-J variant26
with the appropriate Coulomb fitting sets27. Increased integration grids (Grid4 and GridX4 in
ORCA convention) and tight SCF convergence criteria were used. The zero-field splitting (ZFS) parameters were obtained from single-point calculations using the BP functional. Scalar relativistic effects accounted for the metal center, and were included with ZORA paired with the SARC def2-TZVP(-f) basis sets28 and the decontracted def2-TZVP/J Coulomb fitting basis
sets for all atoms. Increased integration grids (Grid4 and GridX4 in the ORCA convention) and tight SCF convergence criteria were used in the calculation. The spin-spin contribution to ZFS was calculated on the basis of the UNO determinant29.
In the rigid model:
EPR spectra of DMAZnF:Mn2+ have been reported recently,16 with particular attention paid to
the LT phase. However, the dynamics of interest occur in the HT phase. We therefore focused mainly on the dynamics in the HT phase.
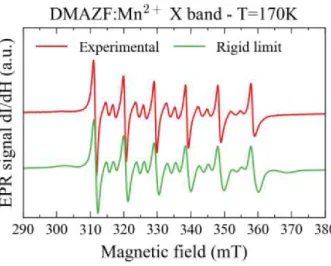
Figure 2: X-band EPR spectra of the Mn2+ spin probe in DMAZnF, recorded just above Tc. The
experimental data (red) are fitted (green) using the parameters provided in the text.
Figure 2 shows an example of a spectrum recorded at X-band and T=170K (just above the ferroelectric phase transition temperature). In general, the spectrum of a Mn2+ ion (S=5/2,
I=5/2) is composed of six sets of 5 allowed transitions (DmS=±1, DmI =0), giving 30 allowed
lines. In our case, the spectrum is composed of only 6 allowed DmS=±1 (mI=-1/2 to 1/2)
transitions. The (mS=±5/2 to ±3/2, and mS=±3/2 to ±1/2) transitions are invisible because while
they do occur, they are too broad to be resolved. Between the allowed transitions, we observed 10 weaker forbidden (DmS=±1, DmI=±1) transitions30. The presence of the forbidden transitions
proves that there is a non-negligible crystal field anisotropy. Multiple-quantum transitions, observed in weak anisotropy,31,32 are not seen here.
Here, the first term represents the Zeeman interaction, the second the hyperfine interaction, while the last term represents the crystal field interaction.
In solid-state EPR spectroscopy, the signal is usually described by the rigid model, in which the motion of atoms is small compared to the timescale (~1/f, f = frequency) of measurement. We used the Matlab module Easyspin33 to simulate the spectra.
The green line shows the spectrum simulated using the standard rigid model and the following parameters: g=2.01, A=-265MHz and D=B02/3=250(±50)MHz. To take into account the large
anisotropy strain, we used a Gaussian distribution of D, DD~150MHz. The simulation describes the experimental data accurately, and the fit parameters are in agreement with those reported in other EPR studies15. Due to the very large line broadening, it was not possible to extract other
crystal field parameters from the data.
We are conscious that the physical meaning of this very large value of D-strain is not obvious, but we present a plausible hypothesis based on our theoretical calculations (vide infra).
Compared to the nominal value of D=250MHz, the value of DD is not at first understandable since DD, which is caused by small local strains in the lattice, should be a perturbation. Here we found a strain of about 60%, which should destroy the crystal structure. However, another scenario can explain this large value. We recall that the Mn2+ spin is surrounded by eight
nearest-neighbor DMA+ cations. In the HT phase, each DMA+ can occupy one of three
equivalent positions, and is constantly moving between these positions. However, if the timescale of the measurement is fast enough (faster than the time of motion between two positions), the DMA+ cations appear frozen in one configuration. We can estimate the number
each capable of occupying one of three equivalent positions, we have 38 = 6561 possible
configurations. The sample contains many billions of Mn2+ spins, each experiencing a crystal
field corresponding to one of these 6561 configurations. Thus, the EPR signal recorded is like a “snapshot” of all the configurations at the same time. All configurations are equally probable and each gives a different EPR spectrum. The spectrum shown in Fig. 2 is actually the sum of all 6561 spectra. We simulated this effect using a Gaussian distribution of D.
In order to confirm this model, we used DFT. We have estimated the ZFS of selected configurations. We chose to work with a minimal model consisting of one Mn2+ ion bound to
six formate anions and surrounded by eight DMA+ cations (see figure SI2). The resulting metal
cluster displays a quasi-octahedral coordination geometry. Based on the HT X-ray structure that identified three equivalent positions of the nitrogen atom in each DMA+, we considered
several configurations in which the Mn-N distances can vary from 4.61 to 5.78 Angstroms. This provided a random sampling of the possible configurations (see Table SI3). The distribution of the ZFS parameter was found to be DDDFT~125 MHz, in rather good agreement with the
experimentally estimated DD~150 MHz .
The results of DFT calculations lead to several conclusions. Firstly, the crystal field effect on the Mn2+ spin has previously been considered to originate solely from the surrounding
octahedral oxygens. Here we prove that the DMA+ cations also play an important role in
determining the crystal field of the M2+ ion. The reason is that although the oxygens are in
first-neighbor positions, they form an octahedron with a nearly cubic symmetry and consequently, a weak anisotropy. On the contrary, although the DMA+ cations are farther away than the
oxygens, they create a low-symmetry crystal field around Mn2+.
Secondly, in the HT phase, the DMA+ cations are considered to be undergoing hindered rotation
enough, the cation appears frozen. This is the rigid limit, which is the case for X-band measurements at low temperature (170K<T<200K) and Q-band measurements at all temperatures.
In the slow-motion regime:
Intriguingly, at higher temperatures (>200K) in X-band measurements, the lineshape is different compared to the one in Fig. 2.
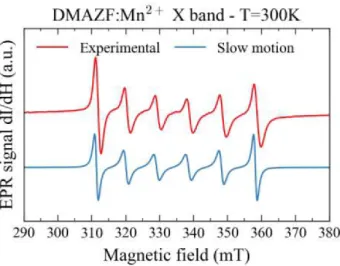
Figure 3: X-band EPR spectra of the Mn2+ spin probe in DMAZnF, recorded at room
temperature. The experimental data (red) are compared to the EPR signal expected in the slow-motion regime (blue).
Figure 3 shows the X-band EPR spectrum of DMAZF:Mn2+ at room temperature. The
forbidden transitions disappear and the linewidths are smaller for the outer lines (mI=±5/2) than
for the central lines (mI=±1/2). The rigid-model simulation did not yield the experimental
lineshape at room temperature, for any chosen values of fit parameters. This is because the rigid limit assumes that the crystal field is constant in time (i.e. the atoms are fixed) and the linewidth is included phenomenologically, as a distribution of crystal fields, in the Hamiltonian. On the contrary, in the HT phase, the DMA+ cation can occupy one of three equivalent positions and
is almost free to move between these positions. Depending on the rate, the motion of DMA+
must be taken into account and the rigid limit is no longer valid. The snapshot described before is now blurred by the motion of the cation, which is comparable or fast compared to the timescale of the measurement. This model is called the “slow-motion” model and has been used in the past to describe the EPR spectra of viscous solutions34–36. In these papers, the Mn2+ ions
were moving in a viscous solution, causing fluctuation of the anisotropic interaction with the solvent as a function of time. In our case, the Mn2+ ion is fixed but the motion of the DMA+
cations leads to the same effect as that observed for Mn2+ spins surrounded by a viscous
solution.
As is known34–36, the choice of model is based on the correlation time (t
c) of the process
modulating the ZFS. Depending on the value of tc relative to the timescale of measurement
(inverse of the microwave frequency), the DMA+ is seen as either rigid or moving. If tc< 1/f,
then during the timescale of the measurement, the DMA+ appears to be moving between the
three possible positions: this is the slow-motion regime. If tc> 1/f, then the DMA+ appears to
be frozen in one of the three positions during the measurement: this is the rigid limit mentioned above. Figure 3 shows the simulation in the slow-motion regime, using D=250MHz, A=265MHz and tc =2.10-9 s. This model describes the room-temperature spectrum accurately.
In order to support our model, we acquired EPR spectra of DMAZF:Mn2+ at a lower frequency
(S-band – 4GHz), where the effect of motional broadening is expected to be enhanced. Unfortunately, the sensitivity of the S-band spectrometer is about 2 orders of magnitude lower than at X-band. As a consequence, the signal-to-noise ratio of the measurements is poor and the signals are noisy.
Figure 4: S-band (4 GHz) EPR spectra of the Mn2+ spin probe in DMAZnF, recorded at room
temperature. The experimental data (red) are compared to the slow-motion regime (blue) and the rigid model (green). Good agreement with the slow-motion regime is clearly evident.
Figure 4 shows a spectrum recorded at S-band at room temperature. The purpose of this measurement was to compare the two models describing the X-band results. The blue line is the simulated spectrum corresponding to the slow-motion regime, obtained using the correlation time extracted from X-band results (Fig. 3). The green line is the simulated spectrum corresponding to the rigid limit, obtained using the Hamiltonian parameters extracted from Fig. 2 (g=2.01, A=-265MHz and D=B02/3=250MHz and DD~150MHz). Although the linewidth is
slightly overestimated, the slow-motion regime describes the experimental data much more accurately than the rigid limit.
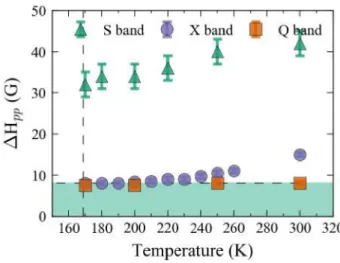
Figure 5: Peak-to-peak linewidth of the rightmost EPR line, recorded between 300K and 170K for the three frequencies used. The vertical dashed line is the structural transition temperature. The horizontal dashed line is the inhomogeneous linewidth.
Finally, Fig. 5 compares the linewidths for the three frequencies as a function of temperature. At Q-band, we find the linewidth of 8 G to be nearly independent of temperature. At X-band, the linewidth starts at 15 G at room temperature and then decreases with temperature, finally reaching a minimal value of about 8 G. At S-band, the linewidth is about 40 G, and decreases with temperature to 30 G. Applying the slow-motion model36 with tc =2.10-9 s ( at T=300K),
we obtained linewidths of 46 G at S-band, 15 G at X-band, and 1 G at Q-band. While the simulated linewidths at S-band and X-band are in good agreement with experimental results, those at Q-band are not. This is because the timescale of Q-band measurements is very fast compared to the correlation time of the motion of the DMA+ ion. Thus, the system is best
described by the rigid-limit model, in which inhomogeneous broadening of the linewidth has been estimated to be 8 G. This value is the threshold below which slow-motion broadening is hidden by the inhomogeneous broadening discussed previously. At X-band, both regimes occur. At high temperature, slow-motion broadening is dominant. Upon decreasing the
temperature, the correlation time increases and below about 220K, the DMA+ cation appears
frozen at the measurement timescale and the rigid limit is reached.
The timescale of spectroscopy is an important parameter to take into account, especially if the motion inside the system is important. This is the case in the DMA formate family, in which the nature of the multiferroicity is directly connected to the motion of DMA+. In high-energy
spectroscopy (X-ray, neutron), the timescale is extremely short and the DMA+ ions appear
frozen in the HT phase, giving the reported result of three equivalent positions of nitrogen7. On
the other side, in low-energy spectroscopy, the DMA+ appears to be moving, irrespective of the
experimental temperature19. Dielectric susceptibility measurments18 have shown that the
motion of the dipoles, which is directly related to the motion of the DMA+ ions, has a
characteristic frequency f0=2.97x10¹³ Hz and energy Ea= 3600K (0.31 eV) . These values lead
to a correlation time of the dipole tc = 1/f0 exp(Ea/kT), of 5.10-9 s at T=300K. This is in
reasonably good agreement with the value of the EPR correlation time of 2.10-9s. It also agrees
with the correlation time obtained by a recent 15N NMR study37.
CONCLUSION:
This work extends earlier EPR studies of the phase transition of the metal-organic framework compound DMAZnF, using the Mn2+ (S = 5/2) paramagnetic ion as a spin probe. Emphasis is
laid on understanding the relative signal intensities of the hyperfine peaks in the HT, paraelectric phase of this compound; which is the parent of this class of MOFs, as detailed in the Introduction. In particular, Simenas and coworkers17 have used pulsed EPR , ENDOR, and
CW EPR to probe the motion of the DMA+ cation , but these studies focused more on the order
parameter than on the large spread in the value of the D parameter in the paraelectric phase. The authors did perform an Arrhenius analysis of the motional effect based on temperature variation of the linewidth, but a quantitative analysis of the rate of motion was not described.
We argued that the timescale of the motion is slow enough that going to frequencies lower than X-band might provide fruitful information about this motion. Indeed, S-Band (4 GHz) EPR spectra yielded clear signatures of the slow motion of both the formate and the DMA+ groups;
the rate of hindered rotation of DMA+ is well described by the correlation time of 2.10-9 s at
ambient temperature. Additionally, the unusual result that ΔD, i.e. the spread in D, is larger than D itself can be rationalized by our DFT calculations. We anticipate that our studies will spark new interest in lower-frequency EPR , which can be combined with DFT studies to understand the role of molecular motion in the mechanism of the ferroelectric phase transition in these hybrid MOFs.
SUPPORTING INFORMATIONS:
Crystallographic structure of the LT phase. Minimal model used for the DFT calculation and the results of the 14 configurations used.
ACKNOWLEDGEMENTS
We thank CNRS’ research infrastructure RENARD (FR3443) for EPR facilities, and the US National Science Foundation, via Award CHE-1464955. The NHMFL is supported by the Co-operative Agreement Grant No. DMR-1157490 and the State of Florida.
REFERENCES
(1) Eerenstein, W.; Mathur, N. D.; Scott, J. F. Multiferroic and Magnetoelectric Materials. Nature 2006, 442, 759–765.
(2) Cheetham, A. K.; Rao, C. N. R. There’s Room in the Middle. Science (80-. ). 2007, 318, 58–59.
(3) Ramesh, R. Materials Science: Emerging Routes to Multiferroics. Nature 2009, 461, 1218–1219.
(4) Zhang, W.; Xiong, R.-G. Ferroelectric Metal–Organic Frameworks. Chem. Rev. 2012, 112, 1163–1195.
(5) Li, W.; Wang, Z.; Deschler, F.; Gao, S.; Friend, R. H.; Cheetham, A. K. Chemically Diverse and Multifunctional Hybrid Organic–Inorganic Perovskites. Nat. Rev. Mater.
2017, 2, 16099.
(6) Asadi, K.; van der Veen, M. A. Ferroelectricity in Metal-Organic Frameworks: Characterization and Mechanisms. Eur. J. Inorg. Chem. 2016, 2016, 4332–4344. (7) Jain, P.; Dalal, N. S.; Toby, B. H.; Kroto, H. W.; Cheetham, A. K. Order−Disorder
Antiferroelectric Phase Transition in a Hybrid Inorganic−Organic Framework with the Perovskite Architecture. J. Am. Chem. Soc. 2008, 130, 10450–10451.
(8) Jain, P.; Ramachandran, V.; Clark, R. J.; Zhou, H. D.; Toby, B. H.; Dalal, N. S.; Kroto, H. W.; Cheetham, A. K. Multiferroic Behavior Associated with an Order−Disorder Hydrogen Bonding Transition in Metal−Organic Frameworks (MOFs) with the Perovskite ABX 3 Architecture. J. Am. Chem. Soc. 2009, 131, 13625–13627.
(9) Mączka, M.; Gągor, A.; Macalik, B.; Pikul, A.; Ptak, M.; Hanuza, J. Order-Disorder Transition and Weak Ferromagnetism in the Perovskite Metal Formate Frameworks of [(CH3)2NH2][M(HCOO)3] and [(CH3)2ND2][M(HCOO)3] (M = Ni, Mn). Inorg. Chem. 2014, 53, 457–467.
(10) Sánchez-Andújar, M.; Gómez-Aguirre, L. C.; Pato Doldán, B.; Yáñez-Vilar, S.; Artiaga, R.; Llamas-Saiz, A. L.; Manna, R. S.; Schnelle, F.; Lang, M.; Ritter, F.; et al. First-Order Structural Transition in the Multiferroic Perovskite-like Formate
[(CH3)2NH2][Mn(HCOO)3]. CrystEngComm 2014, 16, 3558.
Organic Perovskite Dimethylammonium Manganese( <scp>ii</Scp> ) Formate. Dalt. Trans. 2016, 45, 4380–4391.
(12) Clune, A. J.; Hughey, K. D.; Lee, C.; Abhyankar, N.; Ding, X.; Dalal, N. S.; Whangbo, M.-H.; Singleton, J.; Musfeldt, J. L. Magnetic Field-Temperature Phase Diagram of Multiferroic [(CH3)2NH2]Mn(HCOO)3. Phys. Rev. B 2017, 96, 104424.
(13) Hughey, K. D.; Clune, A. J.; Yokosuk, M. O.; Al-Wahish, A.; O’Neal, K. R.; Fan, S.; Abhyankar, N.; Xiang, H.; Li, Z.; Singleton, J.; et al. Phonon Mode Links Ferroicities in Multiferroic [(CH3)2NH2]Mn(HCOO)3. Phys. Rev. B 2017, 96, 180305.
(14) Abhyankar, N.; Bertaina, S.; Dalal, N. S. On Mn 2+ EPR Probing of the Ferroelectric Transition and Absence of Magnetoelectric Coupling in Dimethylammonium
Manganese Formate (CH 3 ) 2 NH 2 Mn(HCOO) 3 , a Metal–Organic Complex with the Pb-Free Perovskite Framework. J. Phys. Chem. C 2015, 119, 28143–28147. (15) Šimėnas, M.; Ciupa, A.; Ma̧czka, M.; Pöppl, A.; Banys, J. EPR Study of Structural
Phase Transition in Manganese-Doped [(CH3)2NH2][Zn(HCOO)3] Metal–Organic Framework. J. Phys. Chem. C 2015, 119, 24522–24528.
(16) Šimėnas, M.; Kultaeva, A.; Balčiu̅nas, S.; Trzebiatowska, M.; Klose, D.; Jeschke, G.; Ma̧czka, M.; Banys, J.; Pöppl, A. Single Crystal Electron Paramagnetic Resonance of Dimethylammonium and Ammonium Hybrid Formate Frameworks: Influence of External Electric Field. J. Phys. Chem. C 2017, 121, 16533–16540.
(17) Šimėnas, M.; Macalik, L.; Aidas, K.; Kalendra, V.; Klose, D.; Jeschke, G.; Ma̧czka, M.; Völkel, G.; Banys, J.; Pöppl, A. Pulse EPR and ENDOR Study of Manganese Doped [(CH 3 ) 2 NH 2 ][Zn(HCOO) 3 ] Hybrid Perovskite Framework. J. Phys. Chem. C 2017, 121, 27225–27232.
(18) Abhyankar, N.; Kweon, J. J.; Orio, M.; Bertaina, S.; Lee, M.; Choi, E. S.; Fu, R.; Dalal, N. S. Understanding Ferroelectricity in the Pb-Free Perovskite-Like Metal–Organic
Framework [(CH 3 ) 2 NH 2 ]Zn(HCOO) 3 : Dielectric, 2D NMR, and Theoretical Studies. J. Phys. Chem. C 2017, 121, 6314–6322.
(19) Besara, T.; Jain, P.; Dalal, N. S.; Kuhns, P. L.; Reyes, A. P.; Kroto, H. W.; Cheetham, A. K. Mechanism of the Order-Disorder Phase Transition, and Glassy Behavior in the Metal-Organic Framework [(CH3)2NH2]Zn(HCOO)3. Proc. Natl. Acad. Sci. 2011, 108, 6828–6832.
(20) Sánchez-Andújar, M.; Presedo, S.; Yáñez-Vilar, S.; Castro-García, S.; Shamir, J.; Señarís-Rodríguez, M. A. Characterization of the Order−Disorder Dielectric Transition in the Hybrid Organic−Inorganic Perovskite-Like Formate Mn(HCOO) 3 [(CH 3 ) 2 NH 2 ]. Inorg. Chem. 2010, 49, 1510–1516.
(21) Neese, F. The ORCA Program System. Wiley Interdiscip. Rev. Comput. Mol. Sci. 2012, 2, 73–78.
(22) Perdew, J. P. Density-Functional Approximation for the Correlation Energy of the Inhomogeneous Electron Gas. Phys. Rev. B 1986, 33, 8822–8824.
(23) Perdew, J. P. Erratum: Density-Functional Approximation for the Correlation Energy of the Inhomogeneous Electron Gas (Physical Review B (1986) 34, 10 (7406)). Physical Review B. 1986, p 7406.
(24) Becke, A. D. Density-Functional Exchange-Energy Approximation with Correct Asymptotic Behavior. Phys. Rev. A 1988, 38, 3098–3100.
(25) Schäfer, A.; Huber, C.; Ahlrichs, R. Fully Optimized Contracted Gaussian Basis Sets of Triple Zeta Valence Quality for Atoms Li to Kr. J. Chem. Phys. 1994, 100, 5829– 5835.
(26) Neese, F. Metal and Ligand Hyperfine Couplings in Transition Metal Complexes: The Effect of Spin-Orbit Coupling as Studied by Coupled Perturbed Kohn-Sham Theory. J. Chem. Phys. 2003, 118, 3939–3948.
(27) Weigend, F. Accurate Coulomb-Fitting Basis Sets for H to Rn. Phys. Chem. Chem. Phys. 2006, 8, 1057.
(28) Pantazis, D. A.; Chen, X.-Y.; Landis, C. R.; Neese, F. All-Electron Scalar Relativistic Basis Sets for Third-Row Transition Metal Atoms. J. Chem. Theory Comput. 2008, 4, 908–919.
(29) Sinnecker, S.; Neese, F. Spin−Spin Contributions to the Zero-Field Splitting Tensor in Organic Triplets, Carbenes and BiradicalsA Density Functional and Ab Initio Study. J. Phys. Chem. A 2006, 110, 12267–12275.
(30) Wolga, G.; Tseng, R. Forbidden Transitions in the Paramagnetic-Resonance Spectrum of Mn2+ in Cubic MgO+. Phys. Rev. 1964, 133, A1563–A1567.
(31) Sorokin, P.; Gelles, I.; Smith, W. Multiple Quantum Transitions in Paramagnetic Resonance. Phys. Rev. 1958, 112, 1513–1515.
(32) Bertaina, S.; Groll, N.; Chen, L.; Chiorescu, I. Tunable Multiphoton Rabi Oscillations in an Electronic Spin System. Phys. Rev. B 2011, 84, 134433.
(33) Stoll, S.; Schweiger, A. EasySpin, a Comprehensive Software Package for Spectral Simulation and Analysis in EPR. J. Magn. Reson. 2006, 178, 42–55.
(34) McLachlan, A. D. Line Widths of Electron Resonance Spectra in Solution. Proc. R. Soc. A Math. Phys. Eng. Sci. 1964, 280, 271–288.
(35) Goldammer, E.; Zorn, H. Electron-Paramagnetic-Resonance Study of Manganese Ions Bound to Concanavalin A. Eur. J. Biochem. 1974, 44, 195–199.
(36) von Goldammer, E.; Muller, A.; Conway, B. E. Electron Paramagnetic Relaxation and EPR-Line Shapes of Manganese Ions in a Sulfonated Polystyrene Ion-Exchange Resin at Various Degrees of Hydration. Berichte der Bunsengesellschaft Phys. Chemie 1974, 78, 35–42.
G.; Ma̧czka, M.; Pöppl, A.; Banys, J. Spectroscopic Study of [(CH 3 ) 2 NH 2 ][Zn(HCOO) 3 ] Hybrid Perovskite Containing Different Nitrogen Isotopes. J. Phys. Chem. C 2018, 122, 10284–10292.
TOC Graphic
TOC : Effect of the motion of the DMA cation on the EPR spectrum of the Mn2+ probe. Left