RESEARCH OUTPUTS / RÉSULTATS DE RECHERCHE
Author(s) - Auteur(s) :
Publication date - Date de publication :
Permanent link - Permalien :
Rights / License - Licence de droit d’auteur :
Institutional Repository - Research Portal
Dépôt Institutionnel - Portail de la Recherche
researchportal.unamur.be
University of Namur
Results on Testing a SOA Domain Model through an empirical study - Executive Summary
Ricken, Jan
Publication date:
2009
Document Version
Early version, also known as pre-print
Link to publication
Citation for pulished version (HARVARD):
Ricken, J 2009, Results on Testing a SOA Domain Model through an empirical study - Executive Summary. University of Namur, Namur, Belgium.
General rights
Copyright and moral rights for the publications made accessible in the public portal are retained by the authors and/or other copyright owners and it is a condition of accessing publications that users recognise and abide by the legal requirements associated with these rights. • Users may download and print one copy of any publication from the public portal for the purpose of private study or research. • You may not further distribute the material or use it for any profit-making activity or commercial gain
• You may freely distribute the URL identifying the publication in the public portal ?
Take down policy
If you believe that this document breaches copyright please contact us providing details, and we will remove access to the work immediately and investigate your claim.
University of Namur, Computer Science Department
PhD Thesis on SOA Methodologies for Process Oriented
Implementation
“Testing the SOA domain model for a model driven
and process-oriented SOA implementation”
Executive Management Summary & Technical Report
Jan Ricken
PReCISE Research Center
Computer Science Department, University of Namur
March 2009
Supported by:
1. Introduction
The report summarizes information provided by 54 respondents who took the PhD survey in November 2008 until January 2009. It analyzes the responses and it compares them with the findings out of the PhD topic state-of-the-art analysis. Overall, the results show clear tendencies and underline statements from the state-of-the-art analysis and will certainly allow readers to get good ideas or hints for the own plans to implement SOA. A validated version through real industrial case studies will be available at the end of the thesis.
The report is structured in two main sections: Section A is summarizing on a management level, whereas section B is providing in very detail the questionnaire results with extended charts. Both sections can stand for their own presenting the results on their level. To provide an easy way of reading, recap statements made in the management summary can be verified in detailed by following interactive links to the mentioned reference.
I want to thank all respondents having taken the time to contribute as well as BPtrends, IT nation and SOA Know-How for supporting the survey by providing links on their web-site to their communities.
A part of the results have been condensed for an academic paper and submitted to the worldwide leading Business Process Management conference with an acceptance rate for papers of 14% only. The conference will take place in September 2009 in Ulm, Germany. For more information, please visit http://www.bpm2009.org/
Should you have any questions related to the content or any queries for advice in your specific SOA case, please do not hesitate to contact me by email at [email protected]. It would also be a good opportunity to share your feedbacks to my research and discuss your comments.
Section A
Management Summary
A 1.1. Rapid Conclusions
The conclusions drawn from this survey can not be applied to all industries and type of organizations, but only to the interested companies and organizations attracted by BPtrends, IT nation and SOA Know-How. However, the population of 54 respondents qualify certain trends and verification on testing hypothesis for the PhD objectives. The mayor objective of this questionnaire was to prove the complexity of the subject and the fact that the available SOA implementation methodologies are de facto not known and also significantly not used.
Overall, the results show clear tendencies and underline statements from the state-of-the-art analysis and will lead into three detailed real life case studies to apply the SOA domain model [1] for further refinement. The study results have shown that:
a.) 90,66% of respondents rate the presented SOA Domain model as complete
b.) Two out of three top issues related to SOA are “complexity of subject” and “Missing Methodology and where to start”
c.) 91,1% rate BPM as critical for SOA Implementation d.) A clear trend shows which process model notations are
successfully used for SOA implementations.
e.) Process knowledge will in the future be re-used by 36,96 % to do process-oriented web-service construction.
f.) Academic SOA Implementation Methodologies are de facto unknown in industry and unfortunately also not used.
Regarding the validation and completeness of our SOA domain model, 90,66% of respondents agree that the presented model is reflecting all domains to consider for an exhaustive SOA implementation methodology based on a process-oriented approach. Within the 9,44% not agreeing, respondents were pointing to change management or top management support. However, the mentioned issues are already addressed in our model as a part of the SOA project management domain.
A 1.2. The Respondents Context for SOA
98 % of the participants know the SOA concept, whereas nearly 50% started to know about SOA within 2005 and 2006.
96,2% of respondents will use the SOA concept against 3,8% who decided not to use the SOA paradigm in the IT Strategy. This ratio shows clearly the relevance of thinking more in detail about possible ways of usage in the organizations. Out of the 96,2% of respondents deciding to go for SOA, 50% have planned to go for the project 26% are involved in an ongoing SOA project, 10% have already finished the project and 14% are in the discovery phase of SOA (investigating what it is and how it can be tackled in the best way). In summary, 64% have not started whereas 34% have started or finished.
If we examine the 10% of respondents with already implemented SOA project, these are very big companies with a clear business case and a high level of education and maturity around SOA technology and Business Process Management.
More Information about respondents structure (geography, size, profile etc.) in B1.
A 1.3. Perceived SOA Benefits and Challenges
When asking for the benefits the SOA can bring to organizations and companies, the usual benefits are nominated. The interesting result is the ranking starting with the strongest argument for the implementation of SOA:
1. Flexibility and Agility in IT Architecture and the possibility to re-use services
2. Business and IT alignment by common views and language 3. Reduction of IT cost
4. Enforcement to think in processes
5. Re-utilization of Business Process content 6. Enforcement of data quality
Opposed to benefits SOA is also facing challenges. Here are the challenges starting with the most important challenge:
1. ROI difficult to calculate 2. Complexity of subject
3. Missing approach and where to start 4. Tangible benefits hard to identify 5. Knowledge & right profiles
6. Organizational alignment 7. Change Management 8. Top-Management Buy-In 9. SOA Governance
Interestingly the respondents were much more aligned on what are the biggest advantages than on the challenges. Also interesting is the fact that the three highest ranked advantages as well as the first four highest ranked challenges have a clear distance to the remaining possible answers.
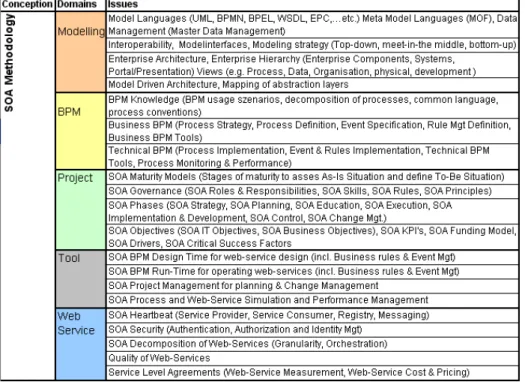
A 1.4. SOA Domain Model in a Nutshell
The survey tested also the SOA domain model for completeness (see B3). All to SOA related issues should be found as an orientation guide within that model.
The presented 5 domains Modelling, BPM, SOA Project, Tool and Web-Service with related issues need to be addressed within SOA implementation. Details on SOA Domain Model can be found in [1]. Issues per domain are marked in bold.
A 1.4.1. SOA Domain: Modelling
Most of the respondents argue to prefer the top-down approach, meaning to start with strategy and to end with code (56,5%). The survey shows clearly the respondents preference for specific modelling notations (per abstraction level) in the context of SOA implementation:
For strategy, the most known and used model type is the Balanced Scorecard (BSC) model and Value Added Chain model. Most of business requirements are captured through Business Process Modelling Notation (BPMN), Business Process Modelling Language (BPML), Event Driven Process Chain (EPC), Integration Definition for Function Modelling (IDEF), Unified Modelling Language (UML) Activity Diagram. For IT or technical implementation languages, Business Process Execution Language (BPEL), Web Service Description Language (WSDL), Workflow Process Definition Language (WPDL) are particularly often known and used.
The automated or semi-automated model translation seems to be a very difficult activity to realize. Just very few have tackled this issue with success.
Enterprise Architecture (EA) is preparing the ground or can be considered as
an enabler as the frameworks force the organization to think about the links between strategy, processes, data and application. The most known and used EA frameworks are Zachmann , ARIS and RUP.
Data modelling and Master Data Management (MDM) are also important
issues to address as data is omnipresent in organizations. Without control on organizations data, major risks for SOA Implementation will occur. The interfacing of data from one system to another is mastered by 47,37%. Details in B2.1.
A 1.4.2. SOA Domain: BPM
The knowledge of BPM is considered as strategic asset for the preparation of SOA. Besides the well-known scenarios e.g. documentation or cost improvement, a considerable amount of respondents have planned to use BPM also for the development of web-services. If this is linked to a top-down approach, the analysis of processes and related business services is a must. Most (84,4%) of respondents manage their processes through real BPM programmes. Details in B2.2.
A 1.4.3. SOA Domain: Project Management
SOA Maturity models are only used by 20,5% of respondents. Half of these
have their own model; the other half is using the GARTNER model. It seems to be more and more important to tailor these approaches to the organizations context and culture. This is also valid for the project management
methodology. Most use their own developed methodology. The crucial part is to
define and quantify the real benefit of SOA implementation: 77,10% did not succeeded to calculate the Return of Investment (ROI). Just 44,22% argue to have a real business case for SOA implementation. Key Performance
Indicators and metrics need to be defined to measure the business case and to
calculate the ROI. The respondent’s answers show clearly that this is not trivial at all. As for all IT projects, challenges e.g. top mgt. buy-in, change management etc. need to be addressed. SOA Governance seems not to be the critical challenge as sometimes reported in articles. Details in B2.3.
A 1.4.4. SOA Domain: SOA Tools
To be able to manage complexity, enforce process conventions, provide single data repository and to link Enterprise Architecture components, a BPM tool to enable SOA implementation is considered as critical success factor. We distinguish “Design-Time” and “Run-Time” Tools. Requirements for both types of tools are very different and need to be evaluated carefully. Also here, some are more known and used than others. The “run-time” tools (Most known and used: IBM, ORACLE, SAP) to implement web-service descriptions need to be able to import from “design-time” tools (most known and used: ARIS, VISIO, Casewise) via interfaces business processes and their related services. Then issues on simulation, SOA performance Mgt., orchestration etc. can be resolved. Details in B2.4.
A 1.4.5. SOA Domain: Web Services
The way web services are used and deployed depends on different things e.g. the business model (service orientation concept orientation for 63,16%) or the IT application architecture. A high number (76,32%) of respondents argue to build their web-service top-down, meaning that business is asking for new services to deploy. Web service granularity is considered by 86,68% as a real challenge. This seems not to apply to IT service companies claiming to have the conceptual knowledge and skills to deal with this type of issue. More about Service Level Agreements, web service technology, web service construction, SOA Security and Data Managememt in B2.5.
Section B
Detailed Technical Report
B1: The respondents
The total number of respondents with 79 has been reduced to 54 by eliminating all responses not being complete or inaccurate.
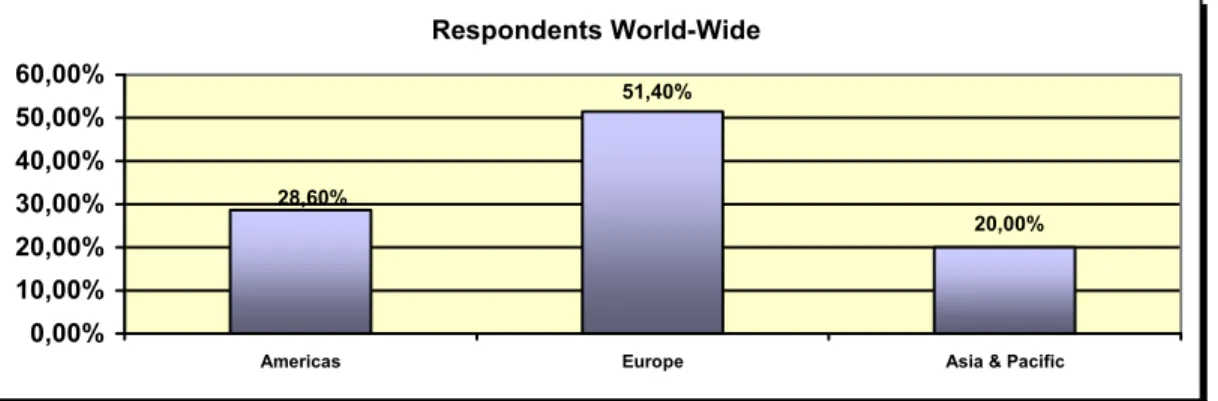
Respondents World-Wide 51,40% 28,60% 20,00% 0,00% 10,00% 20,00% 30,00% 40,00% 50,00% 60,00%
Americas Europe Asia & Pacific
Figure 2: Respondents World-Wide
The top five countries to respond were Luxembourg (17,1%), USA (17,1%), Germany (14,3%), Belgium (11,4%), Australia and Brazil (8,6%).
The mainly high profiles to respond are decomposed as follows:
Profiles CIO/CPO; 22,20% BPM Manager; 22,20% Director; 19,40% CEO; 8,30% Business Analyst; 13,90% Architect; 5,60% Project Manager; 8,30% 0% 20% 40% 60% 80% 100%
Respondents Job Title / Function
72,1% of respondents are Managers, Directors, CIO/CPOs or CEOs. The profiles show clearly that those who responded have a good overview of the subject. Obviously most of the respondents are also profiles who will decide about implementing SOA and how this will be done. The survey provides the perspective of individuals from a wide range of industries as shown in Figure 3. The survey provides the perspective of individuals from a wide range of industries as shown in the following figure:
Type of Industries: Percentage per Industry
5,70% 7,50% 9,40% 13,90% 23,20% 25,00% 5,70% 3,80% 3,80% 3,80% 1,90% 2,00% 1,90% 0,00% 5,00% 10,00% 15,00% 20,00% 25,00% 30,00% Other Electronics Chemical & Pharma Construction & Finishing (Tel)Communication Beverages & Tobacco Logistics Data Processing Energy Financial Services Public Sector Industrial Services IT Solutions
Figure 4: Type of Industries: Percentage per Industry
The ratio between answers coming from headquarters or subsidiaries is 74% vs. 26%.
An important criterion for the utility of SOA implementation is the size of the company/organization. With the size, usually also the number of application is increasing. The panel respondents have the following size and number of applications:
Size of Organization: Percentage per employees category
20,80% 18,90% 1,90% 9,40% 5,70% 22,60% 20,80% 0,00% 5,00% 10,00% 15,00% 20,00% 25,00% <50 50-100 101-500 501-1.000 1.001-1.500 1.501-10.000 >10.000
Figure 5: Size of Organization: Percentage per employee category
Number of Applications: Percentage per application category
11,3 0 % 5 ,7 0 % 7 ,5 0 % 2 4 ,5 0 % 3 4 ,0 0 % 17 ,0 0 % 0,00% 10,00% 20,00% 30,00% 40,00% <10 11 to 25 26-50 51-100 101-500 >500
Figure 6: Number of applications: Percentage per application category
B2: Detailed Results on Testing SOA Domain Model
B2.1. SOA Domain: Modelling
Enterprise Architectures (EA) have been identified as an entry point and play
and important role in the context of SOA implementation. The thought about how an EA can support the IT strategy is a key success factor to include also the SOA concept in the IT strategy. Finally, EA can be considered as an enabler for SOA, as methodology, Process Management, abstraction layers views and linked components need to be considered. The list of EA presented in the questionnaire was populated with the most common in academia and industry.
It is of great value to know which standards are not known at all versus known. If an EA is used, it is interesting to see if the respondents are satisfied or not with it in the practical usage. For this domain, most of the questions asked for one answer among the following possible ones: not known, known, used meeting expectations, used not meeting expectations. The result is clear in the sense that some EA (e.g. CEN ENV 400003, GRAAL, GERAM, TOVE, TEAF, AKM) are not known and therefore not used at all. On the other hand there are clearly EA that are known and used by most of the respondents (e.g. Zachman, ARIS, 4+1 View Model of Architecture, MDA, RUP).
It is interesting to note that there is a relationship between the country of origin of the companies and the known and used EA. Respondents from German speaking countries (e.g. Austria, Germany, Luxembourg) have a clear focus on ARIS, whereas US related respondents are more in favour of Zachman, MDA or RUP, which are standards that have been defined and are maintained in the US. It is important to note that some EA have also regional or country related roots e.g. CIMOSA (France) or ArchiMate (Netherlands). A limitation in this research
question is therefore the under-weighted proportion of French and Dutch respondents.
The following figure seven is giving an overview with the percentages related to the level of EA knowledge and usage:
Respondents and Enterprise Framework
65,96% 65,96% 31,91% 36,17% 25,53% 40,43% 6,38% 14,89% 12,77% 12,77% 14,89% 27,66% 21,28% 27,66% 25,53% 31,91% 40,43% 42,55% 44,68% 8,51% 4,26% 6,38% 8,51% 31,91% 21,28% 29,79% 10,64% 74,47% 63,83% 82,98% 85,11% 82,98% 91,49% 85,11% 2,13% 4,26% 2,13% 2,13% 4,26% 0% 10% 20% 30% 40% 50% 60% 70% 80% 90% 100% GRAAL RM/ODPDoDAF&C4ISR GRAI/GIM CIMOSA Archim ate 4+1 Model Architecture Nolan Norton TOGAF Four Domain Architecture RUP Model Driven Architecture ARIS Zachm ann Framew ork
Not know n Know n Know n,used, m eeting expectations Know n, used, not m eeting expectations
Figure 7: Respondents and Enterprise Framework
Similar to EAs, Modelling Languages are important to analyze in the context of a SOA implementation. Which are the modelling languages suited to accompany conceptual processes with the objective of SOA implementation? Business Processes are considered as critical success factor to identify the processes with related candidate services. A modelling language for instance is e.g. UML whereas a Model type is an UML Activity Diagram. The list of modelling languages and model types was populated with 38 items in alphabetical order. In general, strategic model types (e.g. e3value, Balanced Scorecard (BSC), Value Added Chain Model (VAC) are less known and used than business requirement languages (e.g. Business Process Modelling Notation (BPMN), Event driven Process Chain (EPC), UML Activity Diagram) or technical process implementation languages (e.g. BPML, WSDL)
Some modelling languages & model types are not known and used at all criteria (>85,00% of respondents not knowing/using): Archimate, BOP, EEML, EKS,
Grai/Gim, IEM/Mo2Go, JPDL, Memo, Metis, Meml, Pim4SOA, PIF, PSL Core, SADT, SPEM, Testbed, UEML and Yawl.
Respondents and Modelling Types for SOA
5 3 , 1 9 % 5 1 , 0 6 % 3 4 , 0 4 % 3 4 , 0 4 % 2 5 , 5 3 % 1 9 , 1 5 % 1 7 , 0 2 % 1 0 , 6 4 % 8 , 5 1 % 1 2 , 7 7 % 1 7 , 0 2 % 1 7 , 0 2 % 2 5 , 5 3 % 2 7 , 6 6 % 2 5 , 5 3 % 3 4 , 0 4 % 1 9 , 1 5 % 3 6 , 1 7 % 4 8 , 9 4 % 2 7 , 6 6 % 4 6 , 6 8 % 5 1 , 0 6 % 3 6 , 1 7 % 4 4 , 6 8 % 6 5 , 9 6 % 4 , 2 6 % 6 , 3 8 % 2 7 , 6 6 % 1 0 , 6 4 % 1 4 , 8 9 % 3 6 , 1 7 % 2 5 , 5 3 % 2 9 , 7 4 % 4 4 , 6 8 % 4 0 , 4 3 % 2 3 , 4 0 % 2 , 1 3 % 4 , 2 6 % 2 , 1 3 % 7 2 , 3 4 % 8 0 , 8 5 % 7 8 , 7 2 % 7 0 , 2 1 % 6 8 , 0 9 % 6 8 , 0 9 % 5 5 , 3 2 % 4 , 2 6 % 4 , 2 6 % 1 0 , 6 8 % 4 , 2 6 % 2 , 1 3 % 2 , 1 3 % 2 , 1 3 % 2 , 1 3 % 0 , 0 0 % 0 , 0 0 % 0 , 0 0 % 0 , 0 0 % 0 , 0 0 % 2 , 1 3 % 4 , 2 6 % 0 , 0 0 % 2 , 1 3 % 4 , 2 6 % 0 % 10 % 2 0 % 3 0 % 4 0 % 5 0 % 6 0 % 7 0 % 8 0 % 9 0 % 10 0 % e 3 V a l u e P E T R I N E T S X P D L W P D L C O R B A I D L e b X M L I D E F E P C B S C B P M L W S D L V a l u e C h a i n B P M N A R I S U M L B P E L
Not know n Know n Know n,used, m eeting expectations Know n, used, not m eeting expectations
Figure 8: Respondents and Modelling Types for SOA
A clear trend can be shown on modelling languages with the highest usage on the three different levels of abstraction (Strategy, Processes, IT).
For Strategy, the most known and used model type is the BSC model and Value Added Chain model. The last type of model states between both levels as high level process views can link strategic objectives and process details.
Most of business requirements are captured through BPMN, BPML, EPC, IDEF, UML Activity Diagram.
For IT or implementation languages, BPEL, WSDL, WPDL are particularly often known and used.
Regarding modelling strategy and the way SOA is implemented, 56,5% of respondents have chosen the top-down approach, 19,6% meet-in-the-middle and 15,2% Bottom-up. The result shows a clear trend towards top-down approach and even more decide for meet-in-the-middle than for bottom-up.
Respondents Way of implementing SOA 19,60% 56,50% 15,20% 0,00% 10,00% 20,00% 30,00% 40,00% 50,00% 60,00%
Top-Down Meet-In-The-Middle Bottom-Up
Figure 9: Respondents Way of implementing SOA
The result shows a clear trend towards top-down approach and even more decide for meet-in-the-middle than for bottom-up.
58,7% of respondents argue to use management methods e.g. BSC, Management Cockpit etc. to derive from business objectives also IT and Process objectives. This is necessary to integrate SOA as a strategic element within IT Strategy. 41,3% do not derive from business strategy the IT strategy and process strategy. (In the respondents of 41,3% answering “no”, all respondents from Luxembourg (=100%) are included in this group)
The Model Driven Architecture (MDA) approach of the OMG for software development is gaining popularity. The way abstraction levels are defined and what types of models are used is also important for the context of SOA implementation. Most of respondents know MDA for software development (45,65%) and also use it with satisfaction (17,39%), not meeting expectations (2,17%) and a bit more than a third (34,79%) do not know about MDA. In the context for SOA developments the knowledge about MDA is similar and approximately 13% claim also to use it in this specific context.
Notably, MDA is known and used successfully by the respondents coming from the leading worldwide IT service providers. They have a high level of knowledge and maturity in software development and also apply MDA to their SOA implementation approach.
A principle of MDA is the automatic transformation of technical models (such as UML models) into code. The automation paradigm is also advocated in the context of SOA. The question has been answered by 30,0% of respondents, but most of them rated the question as not applicable. Still, on a very low level, it can be recognized which translations are used more often than others. Again here, nearly all of the respondents are in the IT industry.
The result shows the trend that for SOA more automation is reached the closer one comes to the detailed level of PIM and PSM (related to MDA method). Out of the small population answering to this question, respondents have successfully
used BPMN2BPEL (25,00%), BPEL2WSDL (20,00%), UML2WSDL (10,00%), EPC2BPEL (10,00%), EPC2BPMN (10,00%), UML2BPEL (10,00%), EPC2UML (5,00%).
B2.2. SOA Domain: BPM
BPM is considered as critical success factor and enabler [2]. Therefore, 84,4%
manage completely (46,7%) or partly (37,8%) their processes in a real BPM programme including strategy, design, implementation & controlling.
Generally, the BPM knowledge is rated as very important with 91,1% for SOA implementation. Only 8,9% of the respondents rate it neutral (6,7%) or as not important (2,2%).
Within their BPM, the following usage scenarios are covered:
Respondents and BPM Usage Szenarios
36,96% 28,26% 17,39% 21,74% 17,39% 84,78% 36,96% 32,61% 52,17% 39,13% 50,00% 23,91% 15,22% 45,65% 45,65% 32,61% 19,57% 0% 10% 20% 30% 40% 50% 60% 70% 80% 90% 100% Process-Driven Web Service Contruction Process-Driven Application Development Cost Improvement Risk Mgt. Certification Documentation Yes Planned No
Figure 10: Respondents and BPM Usage Szenarios
Most of respondents have already documented processes (84,44%) and use BPM also as a tool for the achievement of other objectives e.g. certification (36,96%), Risk Mgt. (32,61%), cost control (50,00%), process driven application mgt. (52,17%) and process-driven web-service construction (39,13%). In the context of SOA, it is very interesting to observe the planned scenario for the two
last cited with 28,26% and 36,96%. So nearly 75% of respondents are using or have planned to use processes for the web-service identification and construction. Furthermore, the planned process-driven web service construction of 36,96% is the highest value for the planned usage scenarios in BPM. This is clearly the area with the biggest increasing potential of re-utilisation of BPM content.
B2.3. SOA Domain: SOA Project Management
Maturity models can help to identify the current status and can support thoughts
on targeted maturity and the way to get there. Originally developed by CMMI, maturity models are these days also proposed for SOA maturity. Only 20,5% of respondents use a maturity model for SOA. Exactly half of these respondents (10,5%) declare to use the Gartner SOA Maturity model, the other half (10,5%) is using their own developed model.
The Return Of Investment (ROI) is a key figure for IT projects decision making. The biggest challenge as indicated by the respondents in section A1.3. is also substantiated in the following result: 77,10% of respondents did not succeeded in calculating the ROI.
Respondents Return On Investment calculation
0.00% 5.70% 11.50% 77.10% 5.70% 0.00% 20.00% 40.00% 60.00% 80.00% 100.00%
Did not suceed to calculate ROI
Yes, ROI 1-2y Yes, ROI 2-3y Yes, ROI 3-5y Yes, ROI > 5y
Figure 11: Respondents ROI calculation
The ROI calculation is related to the business case the companies/organizations have for SOA: 47,22% argue to have a strong business case for SOA. 51,43% of respondents are claiming to possess the right skills to understand SOA and 45,71% are arguing to have the right skills to implement SOA. 47,22% of respondents need external consultants to implement SOA. An important issue to address is IT project management that could be adapted to manage the SOA project. 71,8 % use their own project management methodology, 17,9% follow PMI and 10,3% follow Prince2. Within the 71,8%, a considerable number of respondents has adapted and mixed PMI and Prince2 for their specific needs. The respondents were asked to evaluate a list of SOA
methodologies that resulted from our state-of-the-art analysis of all current SOA
methodologies in the academic and practice worlds, as shown in Figure 12:
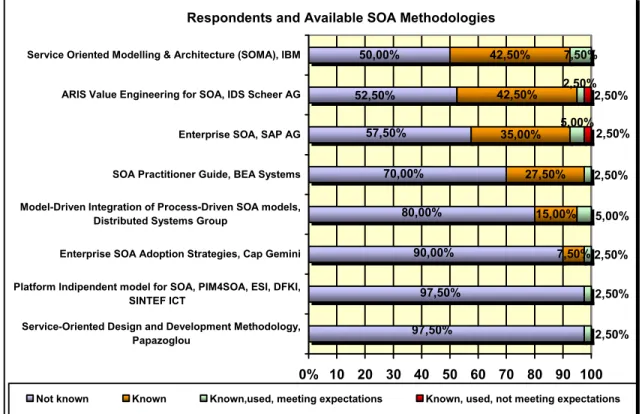
Respondents and Available SOA Methodologies 50,00% 7,50% 15,00% 27,50% 35,00% 42,50% 42,50% 7,50% 52,50% 57,50% 70,00% 80,00% 97,50% 97,50% 90,00% 5,00% 2,50% 2,50% 2,50% 2,50% 5,00% 2,50% 2,50% 2,50% 0% 10 % 20 % 30 % 40 % 50 % 60 % 70 % 80 % 90 % 100 %
Service-Oriented Design and Development Methodology, Papazoglou
Platform Indipendent model for SOA, PIM4SOA, ESI, DFKI, SINTEF ICT
Enterprise SOA Adoption Strategies, Cap Gemini Model-Driven Integration of Process-Driven SOA models,
Distributed Systems Group
SOA Practitioner Guide, BEA Systems Enterprise SOA, SAP AG ARIS Value Engineering for SOA, IDS Scheer AG Service Oriented Modelling & Architecture (SOMA), IBM
Not known Known Known,used, meeting expectations Known, used, not meeting expectations
Figure 12: Respondents and available SOA methodologies
In general, most of respondents are not aware of the wide range of existing methodologies. The most known methodologies are industrial ones e.g. IBM (known by 42,50%), IDS Scheer (42,50%), SAP (35,00%) and BEA (27,50%). The academic proposals are even less known than the industrial SOA methodologies. Unfortunately, the number of reported successful application of such methodologies is too low to deduct reliable findings. IBM was the first IT company to invest in SOA run-time engines and SOA methodology (SOMA). Therefore, their solutions and methodologies are more known than these of the competitors.
The root cause for the weak knowledge on SOA methodologies is related to the fact that 87,18 % of respondents rate SOA methodology as a very complex issue and not easy to tackle at all. If IT-service providers are taken out of the panel, the figure is increasing up to 97,49%. As already mentioned, the IT service-providers have a good understanding of mainly technical SOA knowledge and therefore see in most of the cases no huge complexities to solve.
An important aspect to accomplish successfully SOA projects is related to identification of specific SOA objectives, Key Performance Indicators (KPIs), SOA drivers and Critical Success Factors. Only if this strategic part is well understood and formalized, SOA can become a real success story. Without clear
objectives and ways to measure it, the business case will be weak and the calculation of ROI very difficult. Within the respondents, 16,2% have this
formalized strategic SOA dimension, 37,4% have it partly and 10,8% have
planned to establish it. 35,7% have no such written objectives.
Out of these (35,70%) respondents, 71,51% have not started yet their SOA project. For the remaining 29,49% of respondents, they might be at risk as formalized objectives and measurement metrics are considered as an important issue to solve.
B2.4. SOA Domain: Design Time Tools & Runtime Tools
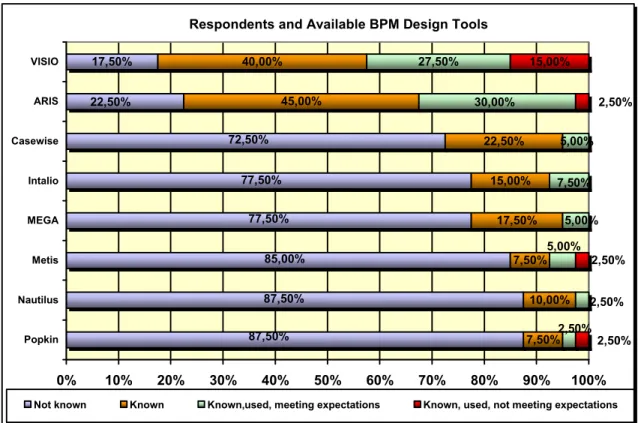
BPM is a key enabler for SOA. Therefore processes need to be supported by robust tools. This is true for the so called “design time” environment as well as for the “runtime environment” What tools or platforms are known and successfully used on both levels? The following chart gives an overview of the respondent’s situation:
Respondents and Available BPM Design Tools 17,50% 7,50% 17,50% 15,00% 22,50% 45,00% 40,00% 27,50% 22,50% 72,50% 77,50% 77,50% 87,50% 87,50% 85,00% 7,50% 10,00% 5,00% 30,00% 2,50% 2,50% 5,00% 5,00% 7,50% 2,50% 15,00% 2,50% 2,50% 0% 10% 20% 30% 40% 50% 60% 70% 80% 90% 100% Popkin Nautilus Metis MEGA Intalio Casewise ARIS VISIO
Not known Known Known,used, meeting expectations Known, used, not meeting expectations
Figure 13: Respondents and available BPM Design Tools
On the “design time”, it clearly shows ARIS platform ahead as well as known and also used successfully. Furthermore, Visio is also well known and used, but with a higher rate of non-satisfaction related to BPM and SOA modelling. Visio is still
more considered as drawing tool that can be used and mastered very quickly than a real BPM design tool.
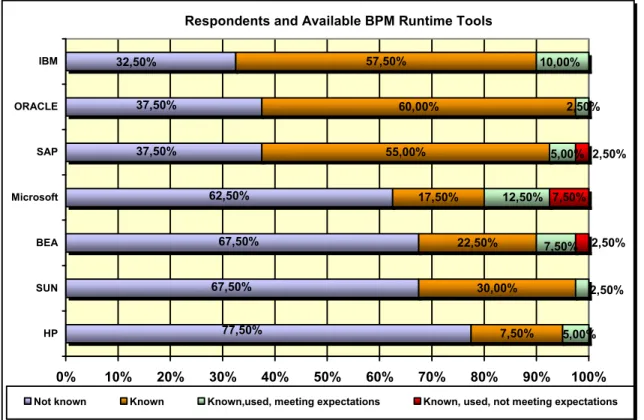
Respondents and Available BPM Runtime Tools
22,50% 17,50% 55,00% 60,00% 57,50% 32,50% 37,50% 37,50% 62,50% 67,50% 77,50% 67,50% 7,50% 30,00% 2,50% 10,00% 5,00% 2,50% 7,50% 12,50% 5,00% 2,50% 7,50% 2,50% 0% 10% 20% 30% 40% 50% 60% 70% 80% 90% 100% HP SUN BEA Microsoft SAP ORACLE IBM
Not known Known Known,used, meeting expectations Known, used, not meeting expectations
Figure 14: Respondents and available BPM Runtime Tools
On the “runtime environment”, IBM, Oracle and SAP are most known and used for implementing and running BPM. The BEA product has been taken over by Oracle, which consolidates a bit the runtime environment providers. Within other runtime environments, e.g. Mircosoft, Sun and HP are cited.
B2.5. SOA Domain: Web Service
A central domain in the SOA paradigm is for sure the service concept. Related to services, 63,16% of respondents answered that service orientation is part of their business strategy. This is partly true for 21,05 and 15,79% argue their business strategy is not service oriented.
Respondents and Service Orientation 21.05% 63.16% 15.79% 0.00% 10.00% 20.00% 30.00% 40.00% 50.00% 60.00% 70.00%
Services part of business strategy Partly service oriented Not service oriented
Figure 15: Respondents and Service Orientation
Interesting in that context is the IT situation of respondents: 34,21% are in full outsourced mode, 5,26% partly and 60,53 have their IT in-house. If we analyze the other way around, more than a third of respondents (answers: “yes” 26,32% and “partly” 10,53) deploy business web services measured by a Service Level
Agreement (SLA) to other companies.
81,6% of respondents use already web service technology, 18,4% don’t. web
service technology can well be used just to interface applications. It is not an indicator for a web service oriented architecture.
An always discussed question in this context of web-service development is the approach of web service construction: Is the business asking for new services (top-down) or is the IT developing services to present these to the business (bottom-up)? The respondents agree with 76,32% that business is asking for new web-services (top-down) to better support their business processes.
Web service security is also considered as an important issue to tackle. Within
SOA security management authentication, authorization and identity management need to be addressed. The following graphic illustrates the results:
Respondents SOA Security (Authentication, Authorization, Identity Mgt)
33.33% 35.90% 30.77% 28.00% 30.00% 32.00% 34.00% 36.00% 38.00%
Full security Partly implemented Not realized
All respondents having answered “no” have so far not started their SOA project.
Web service granularity and decomposition is still for 86,68% a major issue.
Only 13,32% think this is no issue for them. Again, 100% of these respondents arguing granularity is not an issue are within the group of IT service providers having already implemented SOA.
Data itself is an important part of SOA management and implementation. Therefore it is useful to master and control data appropriately. The following results were gathered about Data Management:
36,84% have a data management programme implemented, whereas 31,58% have it partly. (No data management for 31,58%)
47,37% of respondents claim to master the interfaces between applications, whereas 39,47% do partly. (No interface mastering for 13,16%)
Only 36,48% have automated application interfaces, 47,37% have it partly. (No interface automation for 16,15)
B3: SOA Domain Model
Finally the outcome of the state-of-the-art analysis needed to be tested on completeness related to industrial experience.
90,66% of respondents agree that the presented SOA Domain Model is reflecting all domains to consider for an exhaustive SOA implementation methodology based on a process-oriented approach. Within the 9,44% not agreeing, respondents were pointing to change management or top management support. The mentioned issues are part of the SOA project management domain and are addressed in the model. Some other respondents were pointing to related approaches e.g. Web-Oriented Architecture (WOA) or Representational State Transfer (REST) approach.
Respondents about proposed SOA Domain Model
9.44% 90.66% 0.00% 20.00% 40.00% 60.00% 80.00% 100.00%
Agree, SOA Domain Model Complete Do not agree, SOA Domain model incomplete
Some other respondents were pointing to related approaches e.g. Web-Oriented Architecture (WOA) or Representational State Transfer (REST) approach.
WOA, like SOA, is an architectural approach to system design, though WOA is resource-oriented rather than service-oriented. While the core SOA design unit is a reusable service that fulfils a distinct business function, resource-oriented services are more limited and data-focused. SOA and WOA work at different layers of abstraction. SOA is a system-level architectural style that tries to implement new business capabilities so that they can be consumed by many applications. WOA is an interface-level architectural style that focuses on the means by which these service capabilities are exposed to consumers. Governance, quality of service, security, and management are of equal importance, whether the functionality is being delivered via SOA or WOA. [3] Therefore, WOA and REST are approaches standing for their own. They could certainly add value for specific questions.
B4: Closing Remarks
Regarding the statistical significance of the respondents, a more world-wide participation would have been valuable. Unfortunately, the objective of benchmarking the results between different industries has not been achieved because the total respondents’ number per industry was in total too low to get statistical significant results. We take the assumption that several reasons have impacted the number of respondents.
First, the effort to respond to the questionnaire was demanding in time as 36 questions needed to be answered.
Second, respondents needed a deep level of knowledge, high maturity and a fair understanding of the topic to contribute seriously to the survey.
Third, the financial crisis stroked just in the period of launching of the questionnaire and induced, as we could observe in our contacts with the sector, a swap of priorities from strategic IT investments (of which “SOA implementation” projects) towards a more “IT cost control” focus.
B5: References
[1] Ricken, J.; Petit M.: Characterization of Methods for Process-Oriented Engineering of SOA, in:
Procedures of Collaborative Business Processes Workshop. BPM2008, 01.09 – 04.09, Milano, Italy (2008) [2] Ricken, J.: Top-down Modeling Methodology for Model-Driven SOA construction, In: Proc. Of the On the Move Doctoral Consortium, Springer, Nov (2007)
[3] Information Week,