HAL Id: hal-01166362
https://hal.archives-ouvertes.fr/hal-01166362
Submitted on 22 Jun 2015
HAL is a multi-disciplinary open access
archive for the deposit and dissemination of
sci-entific research documents, whether they are
pub-lished or not. The documents may come from
teaching and research institutions in France or
abroad, or from public or private research centers.
L’archive ouverte pluridisciplinaire HAL, est
destinée au dépôt et à la diffusion de documents
scientifiques de niveau recherche, publiés ou non,
émanant des établissements d’enseignement et de
recherche français ou étrangers, des laboratoires
publics ou privés.
Comparative study of metallic silicide–germanide
orthorhombic MnP systems
Damien Connétable, Olivier Thomas
To cite this version:
Damien Connétable, Olivier Thomas. Comparative study of metallic silicide–germanide orthorhombic
MnP systems. Journal of Physics: Condensed Matter, IOP Publishing, 2013, vol. 25 (n° 35), pp. 1-6.
�10.1088/0953-8984/25/35/355403�. �hal-01166362�
To cite this version : Connétable, Damien and Thomas, Olivier
Comparative study of metallic silicide–germanide orthorhombic MnP
systems. (2013) Journal of Physics: Condensed Matter, vol. 25 (n° 35).
pp. 1-6. ISSN 0953-8984
Open Archive TOULOUSE Archive Ouverte (OATAO)
OATAO is an open access repository that collects the work of Toulouse researchers and
makes it freely available over the web where possible.
This is an author-deposited version published in :
http://oatao.univ-toulouse.fr/
Eprints ID : 13983
To link to this article : doi:
10.1088/0953-8984/25/35/355403
URL :
http://dx.doi.org/10.1088/0953-8984/25/35/355403
Any correspondance concerning this service should be sent to the repository
administrator:
[email protected]
Comparative study of metallic silicide–
germanide orthorhombic MnP systems
Damien Conn´etable
1and Olivier Thomas
21CIRIMAT, CNRS-INP-UPS UMR 5085, ´Ecole Nationale d’Ing´enieurs en Arts Chimiques et Technologiques (ENSIACET) 4, all´ee ´Emile Monso, BP 44362, F-31030 Toulouse Cedex 4, France 2Aix-Marseille Universit´e, CNRS, IM2NP, UMR 7334, Campus de St J´erome, F-13397 Marseille Cedex, France
E-mail:[email protected]
Abstract
We present a comparative study of the structural, energetic, electronic and elastic properties of MX type MnP systems (where X = Si or Ge, and M = Pt, Pd or Ni) using first-principles calculations. The optimized ground state properties of these systems are in excellent
agreement with the experimental values. A detailed comparative study of the elastic properties of polycrystalline structures is also presented. We analyze the relationship between the composition and the properties of the systems. Finally, we present the properties of NiSi1−xGexalloys. We show that these properties depend linearly on the Ge content of the
alloy. This work has important consequences for semiconductor devices in which silicides, germanides and alloys thereof are used as contact materials.
1. Introduction
Transition metal silicides are important contact materials for advanced field effect microelectronic devices. These materials are significant because of their metallic character and compatibility with silicon. More recently, SiGe alloys have been used to increase the mobility of charge carriers [1] or as sources of stresses in silicon channels, which also increase the mobility of the charge carriers [2]. Germanium or silicon–germanium alloys are contacted by forming transition metal germanides or silico-germanides. Most transition metals form isotopic silicides and germanides as full or extended solid solutions. In this study we focus on MX silicides or germanides (where M = transition metal and X = Si or Ge) that crystallize into orthorhombic MnP type structures. This behavior is especially observed for NiSi and NiGe, which are intermetallics that are currently used for contacting advanced electronic devices.
The NiSi structure has been studied at ambient pressure [3] and high pressures [4]; however, the effects of varying the composition (of the metal and/or the Si atoms) have not been investigated. The purpose of this study is to
investigate the elastic properties of the MX-MnP systems and how the metal and/or Si/Ge affects these properties.
In section2, we present the computational details for this study. The ground state properties (i.e., the lattice parameters, the formation energies and the electronic properties) of each alloy are presented and compared to each other in sections3and4. In section5, the elastic properties (mono- and polycrystalline) of all of the MX phases are presented. The anisotropies of these phases are then presented and compared with each other. We conclude in section6with a discussion on the energetic and elastic properties of NiSi1−xGexalloys.
2. Computational details
The ground states of MX-MnP and the reference states (fcc and diamond phases) have been optimized by imple-menting DFT VASP [5]. Projected augmented wave pseudo-potentials [6] were used. The spin-polarized version of the Perdew–Burke–Ernzerhof [7] (PBE) generalized gradient approximation (GGA) was used for the exchange–correlation functional. The structures were optimized by sampling the Brillouin zones using Ŵ-centered 25 × 25 × 25 and
Figure 1. Schematic of the MnP structure: the metal atoms are shown in gray and the Ge/Si atoms are shown in black. Table 1. Ground state properties of the reference states: lattice parameters (ao, in ˚A), cohesive energies (Ecoh, in eV/atom), magnetic moments (µB, measured in Bohr units) and bulk modulus (Bo, in GPa); experimental data (from Kittel [9]) are provided for comparison. ao Ecoh µB Bo Ni fcc Theo. 3.52 4.76 0.62 198 Exp. 3.52 4.44 0.62 186 Pd fcc Theo. 3.96 3.71 0.33 163 Exp. 3.89 3.89 0.0 181 Pt fcc Theo. 3.97 5.45 0.0 251 Exp. 3.92 5.84 0.0 278 Si diam Theo. 5.47 4.56 0.0 90 Exp. 5.43 4.63 0.0 99 Ge diam Theo. 5.77 3.74 0.0 57 Exp. 5.68 3.85 0.0 77
15 × 25 × 15 Monkhorst and Pack grids [8] for the fcc and diamond systems and the MnP structures, respectively. Cut-off energies of 600 eV were used. We adopted the finest tetrahedron of 20 × 30 × 20 grids to calculate the electronic density of states (eDOS) and the formation energies for MnP systems.
The pseudo-potentials were tested on the reference phases. Table1shows that the lattice parameters, the cohesive energies, the magnetism and the bulk modulus are in good agreement with the experimental and theoretical literature. Two cases should be noted: Ge and Pd. We obtain a ‘large’ lattice parameter for germanium, which results in a softer bulk modulus than the experimental result. Our results for fcc-Pd are in agreement with previous theoretical work [10] on magnetism. We assumed that magnetic properties of the Pd alloys were not related to the results for fcc-Pd. All of the alloys were found to be non-magnetic.
3. Structural properties
The MX intermetallics, where M = Ni, Pt or Pd, and X = Si or Ge, crystallize in the MnP orthorhombic structure (space group 62, Pnma-D162h, B31). The primitive cell is composed of eight atoms (oP8), where both atoms (M and X) are located in 4c Wyckoff positions (ux,1/4, uz). Figure1is a schematic of
the MnP structure.
Table2 provides the optimized atomic positions which are weakly dependent on the compositions (of M and X).
Table 2. Wyckoff data for MnP systems, showing atoms in the 4c position (ux,1/4, uz). ux uz NiSi [3] Ni 0.0085 0.1889 Si 0.1795 0.5843 PdSi Pd 0.0039 0.1912 Si 0.1771 0.5732 PtSi Pt 0.9964 0.1941 Si 0.1791 0.5825 NiGe Ni 0.0058 0.1908 Ge 0.1905 0.5855 PdGe Pd 0.0040 0.1907 Ge 0.1859 0.5766 PtGe Pt 0.9996 0.1925 Ge 0.1859 0.5865
Table 3. Lattice parameters (in ˚A) and formation energies (in meV/atom) for MnP systems compared to experimental data.
ao bo co Ef NiSi 5.179a 3.365a 5.613a −496a 5.15b 3.35b 5.60b PdSi 5.638 3.469 6.177 −537 5.65b 3.40b 6.15b PtSi 5.663 3.629 5.998 −671 5.600c 3.584c 5.924c −670c 5.61b 3.60b 5.95b −620d NiGe 5.419 3.464 5.864 −313 5.40b 3.45b 5.85b PdGe 5.970 3.565 6.367 −458 5.80b 3.50b 6.36b PtGe 5.842 3.743 6.187 −475 5.75b 3.72b 6.11b
aTheo. PBE [3].bExp. [11].cTheo. LDA [12]. dExp. [13].
Table 3 shows that the optimized lattice parameters, in contrast, depend strongly on the species. The lattice parameters are in excellent agreement with the low temperature experimental data [11]. In all of the cases, the GGA simulations produce slightly higher lattice parameters than the experimental results, unlike the results obtained using LDA functionals. For PtSi, Beckstein et al [12] found lattice parameters smaller than those reported here or those obtained from experimental measurements. These differences lead to significant changes in the PtSi properties and the elastic properties in particular (see below).
Comparing the results for all of the systems shows that the lattice parameters of each phase are highly dependent on the phase composition. Steric effects may be used to explain the primary changes in the lattice parameters of the MGe/Si systems. We illustrate this result by evaluating the relative decrease in the lattice parameters between Si and Ge (a(Si)/a(Ge)) for each of the three metals. For all of the systems, we find a ratio of approximately 0.97 between Si and Ge, which is equivalent to the one found for the Si/Ge diamond structure.
We also find that all of the phases are highly stable with respect to their reference states: the stability increases with
Figure 2. Electronic density of states of MX-MnP; the NiSi values are plotted from the results in [3].
Table 4. Density of states at the Fermi level (N(Ef), in states eV−1) for different elements.
X\M Ni Pd Pt Si 2.20 2.16 1.99 Ge 2.44 2.24 2.19
the weight of the metal atom. All of the structures are metallic (see the electronic properties given above) and non-magnetic.
4. Electronic properties
Figure2shows the electronic density of states (eDOS). Note that all of the eDOSs are extremely similar, especially for the same metal, suggesting that the metal controls the electronic properties.
We analyze each system more precisely by projecting the density of states (pDOS) onto the orbitals (not shown here). The pDOSs are extremely similar to those reported for NiSi in [3]. At low energies, we find the M and X s shells; near the Fermi level, the p shells of X and d orbitals of the metals are hybridized. The p and s shells of the Ge systems are slightly more contracted, thereby inducing a larger gap in the valence bands. At the Fermi level, the density of states is always localized near a minimum. Table4shows the density of states
at the Fermi level (N(Ef)) for reference. For all of the systems,
N(Ef)is approximately 2 states eV−1 and is approximately 10% larger for Ge systems than for Si systems.
5. Elastic properties
The elastic constants were calculated using the same methodology as the one presented in [3]. The elastic properties of orthorhombic systems are characterized by nine elastic constants, corresponding to the six diagonal terms (Cii,
where i = 1, . . . , 6) and three off-diagonal terms (C12, C13
and C23). The elastic constants and the bulk modulus are listed
in table5.
The elastic constants of the Pd alloys are smoother (by 10–15%) than those for Ni and Pt systems (as for the reference states). The elastic constants for the Ge alloys are also approximately 20% smoother than those for Si systems. This evolution can be related to the decrease in the lattice parameters across the systems.
Our results for PtSi are clearly different from those reported by Beckstein [12], i.e., our results are 10% smaller than Beckstein’s results. This difference can be attributed to two main effects: the differences between the lattice parameters and overestimates of the binding energy, i.e., bonds are stronger within the LDA.
We deduce the mono- and polycrystalline elastic properties of the system from these data and analyze the anisotropies. Following [3], we compute the elastic properties of the polycrystalline structures: the shear and bulk moduli (G and B) using the Voigt, Reuss and Hill approximations, Young’s modulus (Y), Poisson’s ratio (ν), and the bulk modulus along different axes. The results are summarized in table6.
Note that the ‘average’ mechanical properties, i.e., ν, G and B, depend weakly on the alloy composition. In contrast, and as reported in our results for the lattice parameters, the bulk modulus along the crystallographic axes and the Young’s modulus are strongly anisotropic. This anisotropy is illustrated in figure 3. The anisotropic values are given in table7. The anisotropy decreases when going from Ni to Pt (see table8). Germanides are softer than silicides, which is consistent with the lower melting points of germanides relative to silicides. However, germanides exhibit a slightly more pronounced anisotropy than silicides. The Young’s modulus is smallest along the [010] direction and largest along the [111] direction (see table7): the anisotropy ratio ranges
Table 5. Elastic constants (Cij) and bulk modulus (B) (in GPa) of MnP systems. C11 C22 C33 C44 C55 C66 C12 C13 C23 Bv NiSi [3] 272 222 229 106 128 126 166 94 149 171 PdSi 228 167 230 77 90 75 126 104 142 152 PtSi 259 240 274 88 89 50 136 101 136 169 [12] 298 269 308 100 104 66 156 132 165 198 NiGe 193 167 172 71 102 104 136 92 116 136 PdGe 179 139 175 60 74 69 112 87 110 124 PtGe 202 192 199 68 73 53 124 102 112 141
Table 6. Isotropic values of the shear and bulk moduli (in GPa) using the Voigt, Reuss and Hill approximations (which are labeled as V, R, and H, respectively); Young’s modulus (in GPa), the Poisson’s ratio (ν) and the bulk modulus (in GPa) along the crystallographic axes a, b and c (see [14], appendix) are also provided.
GR GV GH BR BV BH E ν Ba Bb Bc NiSi [3] 65 93 79 168 171 170 205 0.30 486 957 352 PdSi 50 65 57 150 152 151 153 0.33 532 298 702 PtSi 67 72 69 169 169 169 183 0.32 469 537 517 [12] 77 82 80 198 198 198 211 0.32 572 575 639 NiGe 68 68 56 134 136 135 147 0.32 419 605 292 PdGe 39 53 46 123 124 124 122 0.33 455 283 418 PtGe 56 56 54 141 141 141 144 0.33 445 449 381
Figure 3. 3D representations of the Young’s modulus.
from 1.5 to 3.5, depending on the composition. Analysis on the anisotropy in the shear factors (see table8) results in the same conclusion.
All of these results suggest that the anisotropy is controlled mainly by the nature of the metal.
We conclude our analysis of the anisotropy in MnP systems with a discussion of the Poisson’s ratio, ν. In cubic systems, ν lies within the range [−1,12]. However, many studies have shown (see for example [15]) that the Poisson’s ratio in non-cubic systems is not bounded from either above or below. In the appendix, we present the equations for computing the Poisson’s ratio in a direction (m) perpendicular to a different stress direction (n). In table9, we report νnm, where m and n are along the main directions (x, y and z).
Table 7. Young’s modulus (in GPa) along different crystallographic directions. E100 E010 E001 E111 E111/E010 NiSi [3] 146 78 127 235 3.0 PdSi 133 58 109 183 3.1 PtSi 179 140 194 193 1.4 [12] 201 150 200 226 1.5 NiGe 83 51 91 177 3.5 PdGe 88 45 88 146 3.2 PtGe 115 100 127 164 1.6
Table 8. The anisotropy in the shear elastic factor (Ai, where i =1, 2, 3), the anisotropy in the directional bulk modulus (ABa, ABc) and the anisotropy in the compressibility and the shear
modulus (ABand AGin %). A1 A2 A3 ABa ABc AB AG NiSi [3] 1.35 3.37 3.13 0.51 0.37 1.0 17.7 PdSi 1.23 3.19 2.10 1.78 2.36 0.6 13.6 PtSi 1.06 1.47 0.87 0.87 0.96 0.04 3.6 NiGe 1.55 3.84 4.67 0.69 0.48 0.7 22.5 PdGe 1.34 3.18 2.96 1.60 1.47 0.2 15.5 PtGe 1.39 1.75 1.44 0.99 0.85 0.06 3.3
The elastic behavior observed under a uniaxial strain is clearly different from the elastic behavior of cubic systems. In some cases, the value of ν is larger than 0.5 (as in ν1,0,00,1,0, for example). Moreover, when the system is stressed along n = a (or c), a strong contraction (ν1,0,00,1,0>0.5) is observed along the bdirection, whereas the system expands slightly (ν1,0,00,0,1<0) along the c axis for NiSi, PdSi, NiGe and PdGe. These results may be correlated with the thermal expansion of the lattice parameters: the b axis contracts and the a and c axes expand over the temperature range between 293 and 700 K [11,16] for these systems; however, a clear explanation is not yet available.
6. Effect of the composition on the elastic properties
in NiSi
1−xGe
xIn this section, the effect of the composition on the elastic properties of NiSi1−xGexalloys is presented. Variations in the
Table 9. Anisotropy in the Poisson’s ratio, νm
n, for m and n along the {x, y, z} axes. ν1,0,00,1,0 ν0,0,11,0,0 ν0,1,01,0,0 ν0,1,00,0,1 ν0,0,11,0,0 ν0,1,00,0,1 NiSi 0.84 −0.14 0.45 0.47 −0.12 0.76 PdSi 0.78 −0.03 0.34 0.46 −0.02 0.87 PtSi 0.50 0.12 0.39 0.35 0.13 0.49 NiGe 0.83 −0.03 0.51 0.41 −0.04 0.72 PdGe 0.83 −0.02 0.42 0.42 −0.02 0.81 PtGe 0.51 0.23 0.45 0.33 0.25 0.42
Table 10. Lattice parameters (in ˚A), volume (Vo, in ˚A 3
), and formation energies (Ef, in meV/atom) of NiSi1−xGexsystems, for various values of the Ge content x.
x Ef ao bo co Vo 0 −503 5.165 3.378 5.621 98 0.25 −446 5.247 3.376 5.700 101 0.50 −400 5.346 3.393 5.742 104 0.75 −353 5.358 3.435 5.806 107 1 −313 5.419 3.464 5.864 110
were studied further by sequentially replacing a Si atom by a Ge atom.
Ground state properties. Calculations were performed on a primitive cell (eight atoms), and all of the configurations (at each Ge content) were used to evaluate the effect of the composition on the ground state properties. Equivalent results were obtained for each configuration studied at a given Ge content (the difference in energies and lattice parameters is negligible); therefore we only list the results (the lattice parameters and the formation energies) for one configuration in table 10. Substituting Si with Ge induces a monotonic change in the energy. To illustrate this result, we use a linear regression to fit the formation energy as a function of the Ge content (x, in %). We obtain the following expression (with a correlation factor of R2=1):
Ef(x)= −497 + 189x. (1)
An equivalent relation can be found for the evolution of the volume. We find that the volume of the cell increases linearly with the Ge content: ∼98 + 12x (in ˚A3).
To confirm these results, we investigate the ground state properties for larger supercells. Intermediate Ge(Si) contents, i.e., Ni32SixGe32−x, are simulated using 2 × 2 × 2 supercells.
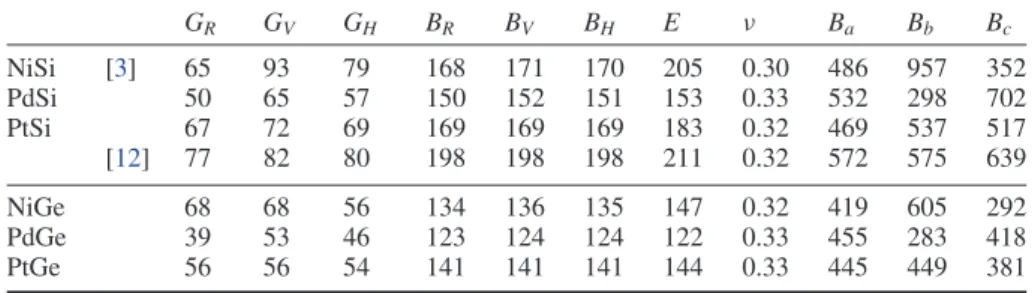
For x ranging from 0 to 32, we consider only one configuration (the inter-atomic forces and the stresses on boxes are also
Figure 4. Evolution of the lattice parameters in NiSixGe1−x systems as a function of x; the dashed lines represent data computed using a primitive cell, and the lines represent data for the lattice parameters computed using 2 × 2 × 2 supercells.
fully relaxed). The orthorhombic symmetries of the supercells are almost completely preserved in the final structures, which exhibit a low crystalline anisotropy (i.e., less than 10−4)
even at intermediate Ge(Si) contents. The evolutions of the formation energies and the volumes with the Ge content are found to be equivalent using the primitive cell and the supercell. Figure 4 shows that the lattice parameters do not evolve monotonically, despite the overall increase in the lattice parameters for the systems containing Si. These results confirm that the evolution of the lattice parameters is mainly controlled by steric effects.
Evolution of elasticity for systems containing Ge.Our results for the ground state properties suggest that the elastic properties of these systems should change monotonically with the Ge content. We computed the elastic constants for three intermediate Ge contents using the primitive cell (corresponding to one configuration for each content value). Table11shows the results of these simulations (Cij). Figure5
shows the evolution of these elastic constants. The elastic constants clearly evolve linearly with x. Within a first-order approximation, the properties of MSiGe alloy (where M = Pt or Pd) structures can be interpolated linearly from extreme systems (NiSi and NiGe).
7. Conclusion
In this study, we have presented first-principles calculations of the ground states (X = Si or Ge, and M = Ni, Pd or
Table 11. Evolution of the elastic constants (in GPa) with the Ge content in NiGexSi1−x. x C11 C22 C33 C44 C55 C66 C12 C13 C23 Bv 0 272 222 229 106 128 126 147 94 149 171 0.25 248 202 218 95 123 120 153 85 138 158 0.50 222 186 201 88 114 113 149 97 134 152 0.75 208 179 188 79 109 111 144 98 127 146 1 193 167 172 71 102 104 136 92 116 136
Figure 5. Evolution of the elastic constants with the Ge content.
Pt) of MX-MnP structures. The structural, electronic and elastic properties of ideal structures were calculated using density functional theory. We showed that the main structural differences between Si and Ge systems can be attributed to steric effects. These systems exhibit a strong elastic anisotropy, which fades upon changing the metal species from Ni to Pt.
To illustrate these steric effects, we performed simula-tions on NiSi1−xGexalloys. We showed that the properties of
these alloys can be satisfactorily linearly interpolated based on the Ge content. We propose that these results can be extrapolated to Pt and Pd alloys.
Acknowledgments
This work was granted access to the HPC resources of CALMIP (CICT Toulouse, France) under the allocation 2012-p0912.
Appendix. Anisotropy in Poisson’s ratio
In general, Poisson’s ratio (ν) in non-cubic systems is considered to be an ‘average’ value, which is computed as follows:
ν= 3B − 2G
2(3B + G). (2) However, ν depends on the transverse contraction under the application of a uniaxial stress. Boulanger et al [17] have shown that Poisson’s ratio (ν = νnm) depends on the direction nof the applied tension and m, which is orthogonal to n. We can calculate Poisson’s ratio for the application of a stress along the x, y or z axis in orthorhombic systems as follows:
ν1,0,00,cos θ,sin θ =C12C33− C13C23 C22C33− C223 cos2θ +C13C22− C12C23 C33C22− C223 sin2θ (3) ν0,1,0sin θ,0,cos θ =C23C11− C12C13 C33C11− C213 cos 2θ +C12C33− C23C13 C11C33− C213 sin2θ (4) ν0,0,1cos θ,sin θ,0= C13C22− C12C23 C11C22− C122 cos2θ +C23C11− C12C13 C11C22− C212 sin2θ (5)
where θ represents the direction of m in the plane perpendicular to n, i.e., m = (0, cos θ, sin θ ).
References
[1] Thompson S E et al 2004 IEEE Electron Device Lett.25191
[2] Patton G L, Iyer S S, Delage S L, Tiwari S and Stork J M C 1988 IEEE Electron Device Lett.9165
[3] Conn´etable D and Thomas O 2009 Phys. Rev. B79094101
[4] Vocadlo L, Wood I G and Dobson D P 2012 J. Appl. Crystallogr.45186–96
[5] Kresse G and Hafner J 1993 Phys. Rev. B47558
Kresse G and Hafner J 1994 Phys. Rev. B4914251
Kresse G and Furthm¨uller J 1996 Phys. Rev. B5411169
Kresse G and Furthm¨uller J 1996 Comput. Mater. Sci.615
[6] Kresse G and Joubert D 1999 Phys. Rev. B591758
[7] Perdew J P, Burke K and Ernzerhof M 1996 Phys. Rev. Lett.
773865
Perdew J P, Burke K and Ernzerhof M 1997 Phys. Rev. Lett.
781396
[8] Monkhorst H J and Pack J D 1976 Phys. Rev. B135188
[9] Kittel C 1996 Introduction to Solid State Physics (New York: Wiley)
[10] Chepulskii R V, Barabash S V and Zunger A 2012 Phys. Rev. B85144201
[11] Brondeel L and Detavernier C 2009 Report on ‘In situ’ XRD thermische expansie van materialen
[12] Beckstein O, Klepeis J E, Hart G L W and Pankratov O 2001 Phys. Rev.B63134112
[13] Chandrasekharaiah M S, Margrave J L and O’Hare P A G 1993 J. Phys. Chem. Ref. Data221459
[14] Ravindran P, Fast L, Korzhavyi P A, Johansson B, Wills J and Eriksson O 1998 J. Appl. Phys.844891
[15] Ting T C T and Chen T Y 2005 Q. J. Mech. Appl. Math.
5873–82
[16] Wilson D F and Cavin O B 1992 Scr. Metall. Mater.268
![Figure 2. Electronic density of states of MX-MnP; the NiSi values are plotted from the results in [3].](https://thumb-eu.123doks.com/thumbv2/123doknet/14622371.733852/5.892.83.432.100.381/figure-electronic-density-states-nisi-values-plotted-results.webp)