MÉMOIRE PRÉSENTÉ À
L'UNIVERSITÉ DU QUÉBEC À TROIS-RIVIÈRES
COMME EXIGENCE PARTIELLE DE LA MAÎTRISE EN GÉNIE ÉLECTRIQUE
PAR
DANIEL FELIPE HERRERA VEGA
ANALYSE ÉLECTROTHERMIQUE EFFICACE, ESTIMATION DE L'ÉNERGIE RÉSIDUELLE ET DU TEMPS DE DÉCHARGE POUR UNE BATTERIE LI-ION À DES
TEMPÉRATURES INFÉRIEURES À ZÉRO DEGRÉ CELSIUS
Université du Québec à Trois-Rivières
Service de la bibliothèque
Avertissement
L’auteur de ce mémoire ou de cette thèse a autorisé l’Université du Québec
à Trois-Rivières à diffuser, à des fins non lucratives, une copie de son
mémoire ou de sa thèse.
Cette diffusion n’entraîne pas une renonciation de la part de l’auteur à ses
droits de propriété intellectuelle, incluant le droit d’auteur, sur ce mémoire
ou cette thèse. Notamment, la reproduction ou la publication de la totalité
ou d’une partie importante de ce mémoire ou de cette thèse requiert son
autorisation.
MEMORY PRESENTED AT
UNIVERSITY OF QUEBEC AT TROIS-RIVIERES
AS PARTIAL FULFILLMENT OF THE MASTER IN ELECTRICAL ENGINEERING
BY
DANIEL FELIPE HERRERA VEGA
EFFICIENT ELECTROTHERMAL ANALYSIS, RESIDUAL ENERGY AND DISCHARGE TIME ESTIMATION FOR A LI-ION BATTERY IN
TEMPERATURES BELOW ZERO DEGREE CELSIUS
L'électrification des transports présente notamment des avantages en termes d'émissions polluantes (gaz à effet de serre et particules) vis-à-vis des véhicules conventionnels, mus uniquement par un moteur à combustion interne. Cependant, la localisation des véhicules électriques hybrides (Hybrid Electric Vehicles - HEVs) et des véhicules électriques à bat-terie (Battery Electric Vehicles - BEVs) dans les systèmes de transport, pour les zones géo-graphiques où la saison d'hiver est extrêmement longue et froide, nécessite le développement de méthodes d'estimation fiables et efficaces de l'énergie et du temps de décharge.
La température d'opération est un facteur clef pour les performances de tous dispositifs électrochimiques. La quantité d'énergie servant à propulser le BEV dépend directement de leur température d'opération (en particulier à températures inférieures à a°C). De plus, les basses températures ont une influence sur la variation de la résistance ohmique de la batterie, du telles variations conduisent à une réduction de la puissance délivrée, ainsi que de l'énergie disponible. Dans les environnements où la température est très faible, les batteries doivent atteindre leurs conditions de fonctionnement normal dans le plus bref délai afin de maintenir ses performances optimales.
Avant de penser à la façon de prévenir la formation de glace sur la batterie lorsque la batterie est exposée à des températures négatives, il est important, dans un premier temps, de bien comprendre le comportement de la batterie et de déterminer, d'une façon fiable, la quantité d'énergie disponible lors de son utilisation. Dans les applications réelles, les constructeurs automobiles prennent des mesures préventives en actionnant les mécanismes de démarrage du véhicule : généralement, il s'agit d'un système de chauffage de la batterie qui
à la propulsion du véhicule. Dans la plupart des cas, telle estimation se fait en utilisant des tables de consultation. Nous soulignons la nécessité d'étudier le comportement thermique des batteries Li-ion dans des conditions hivernales. Des techniques, à la fois simples et efficaces, capables d'estimer l'énergie résiduelle devraient être considérées pour augmenter ainsi la capacité et la durée de vie de la batterie. Il est également nécessaire de développer du méthodes servant à une meilleure estimation du temps de décharge de la batterie; cette valeur servira comme référence à l'utilisateur sur la quantité d'énergie qui peut être extraite.
À partir de la problématique identifiée précédemment, l'objectif principal de ce travail de recherche est d'accroître l'efficacité énergétique d'une batterie Li-ion et de permettre au système et à l'utilisateur d'avoir une prise en compte de la consommation d'énergie de la batterie lorsque le véhicule électrique est exposé à des conditions de basse température (allant de 0 oC à -40 oC), ce qui se traduira par une augmentation de la durée de vie de la batterie. Dans ce contexte, les contributions apportées s'articulent autour des points suivants:
• L'instrumentation et la mise en œuvre d'une stratégie pour l'étude des performances des batteries en conditions hivernales: cette stratégie prévoit une méthode qui combine les équations thermiques et électriques régissant le modèle, l'impact de la température extérieure sur les performances de l'ensemble de cellules, et les contraintes opéra-tionnelles imposées par le système de gestion de l'énergie de la batterie au Li-ion. Par ailleurs, les phénomènes d'échange de chaleur qui se produisent au niveau des cel-lules du batterie seront pris en compte pour augmenter la performance de l'algorithme d'estimation d'énergie;
• Le développement d'une méthode simple qui favorise l'identification des paramètres du modèle de la batterie au Li-ion (résistance interne, chaleur spécifique, capacité calori-fique massique) à partir de la mesure de la tension en circuit ouvert tout au long du cycle de fonctionnement. L'intérêt d'une telle méthode réside dans la possibilité d'effectuer
trique;
• La conception de deux méthodes permettant l'estimation de l'énergie résiduelle de la batterie. Il est à souligner qu'une méthode doit faciliter le traitement des données en temps réel;
• Le développement d'un algorithme qui permet l'estimation en ligne du temps de décharge de la batterie. Ceci prend une importance particulière au moment où le courant de décharge n'est pas constant et l'amplitude du courant moyen varie au fil du temps.
La méthodologie suivie tout au long de ce travail se déroulera en six étapes de la façon suivante:
Configuration du banc d'essai:
Le banc d'essai est composé d'une charge électronique pilotable permettant la décharge de la batterie sur plusieurs profils de conduite; une source d'alimentation permettant la charge de la batterie; une chambre de refroidissement dédiée à la régulation en température de la batterie (de 0 oC à -40 OC) ; un système d'acquisition "National Instruments DAQ system" et un logiciel de commande développé sous "LabVIEW". Ce logiciel permet aussi de contrôler la charge électronique et d'afficher et enregistrer les paramètres tels que la température, le courant et la tension.
L'ensemble des cellules de la batterie Li-ion est construit par CrossChasm pour sa mo-toneige électrique et utilisé pour des études de recherche sur l'environnement à la Fondation nationale pour la science des États-Unis "Summit Station" au Groenland. L'ensemble com-prend dix cellules raccordées électriquement en série fabriquées par la société allemande "GAIA Advanced Battery Systems" et les cellules sont classifiées en Amérique du Nord comme "MIL SPEC" (grade militaire).
avec son correspondant de température ambiante optimale. Des essais à différents courants constants (50 A, 125 A et 200 A) et à différentes températures (24 oC et de 0 à -30 oC) ont été menés pour décharger la batterie. L'estimation de l'énergie résiduelle au cours de la décharge et à très basse température constitue une originalité majeure de ce projet de recherche. Cet aspect est souvent négligé, mais s'avère crucial pour l'autonomie des véhicules électriques. En outre, la décharge sous cette température constitue un défi technologique clairement iden-tifié par le Département de l'Énergie des États-Unis. Toutes ces expériences ont été réalisées au niveau de l'ensemble de cellules. Cette étape de la méthodologie nous a permis de car-tographier l'énergie de la batterie au Li-ion dans des conditions hivernales tout en permettant de comprendre la sévérité des dégradations de performances jusqu'à la fin de l'estimation du temps de décharge.
Conception du modèle électrothermique :
L'étude d'un modèle électrothermique, présenté au troisième chapitre, comprend les con-traintes du projet. À ce stade, toute représentation mathématique contenant les principes électriques et thermodynamiques a été exprimée afin de définir les équations et leurs vari-ables. Le lien entre les équations électriques et thermiques issues des paramètres tels que la tension de circuit ouvert, la masse thermique, la chaleur spécifique, la capacité calorifique de la batterie sera établi.
Estimation de l'énergie résiduelle:
Cette phase a eu pour objectif principal d'identifier la quantité d'énergie résiduelle dans la batterie au Li-ion en utilisant deux méthodes d'estimation: d'une part en appliquant un algorithme d'apprentissage par réseaux de neurones artificiels (Artificial Neural Networks -ANN) et d'autre part en appliquant une méthode directe qui permet l'estimation en temps
neurones. L'ANN a eu en entrée les valeurs de la tension et de la température et en sortie les courbes d'énergie prises lors de la caractérisation de la batterie.
Estimation du temps de décharge final:
À partir du modèle électrothermique précédemment défini et de l'estimation de l'énergie résiduelle de la batterie, un algorithme pour estimer le temps de décharge a été mis en œuvre. En effet, cela nous a permis de savoir combien de temps de conduite reste avant que la batterie soit complètement déchargée. L'algorithme développé doit être capable de fonctionner en temps réel en tenant compte les paramètres de fonctionnement du véhicule électrique (tels que le voltage, le courant, la température, l'estimation de l'énergie résiduelle) et en utilisant
un minimum de ressources informatiques pour exécuter chaque tâche. En sus de ce qui précède, il convient de prendre en considération les restrictions suivantes: (i) la quantité d'énergie disponible déterminée par la méthode d'estimation de l'énergie résiduelle doit être
respectée; (ii) la durée pendant laquelle le véhicule électrique est arrêté et hors tension sera préalablement défini par l'utilisateur et doit être respectée; et (iii) le système de contrôle thermique doit s'adapter en permanence à la valeur de la température ambiante.
Validation expérimentale:
Chaque étape de la méthodologie proposée a été évaluée expérimentalement au sein de l'Institut de Recherche sur l'Hydrogène afin de vérifier les résultats du calcul et de valider l'exactitude des algorithmes quant à l'estimation du temps de décharge.
Après avoir exposé la méthodologie de ce travail de recherche, nous listons les résultats obtenus comme suit:
La Figure 2.5 présente les résultats obtenus lors de la caractérisation de la décharge de la batterie. À partir de ces résultats, nous pouvons observer une tendance similaire dans le
référence pour tous les résultats obtenus au cours de ce travail.
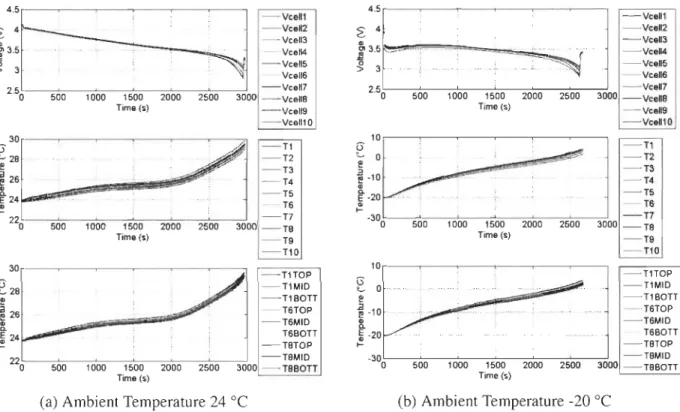
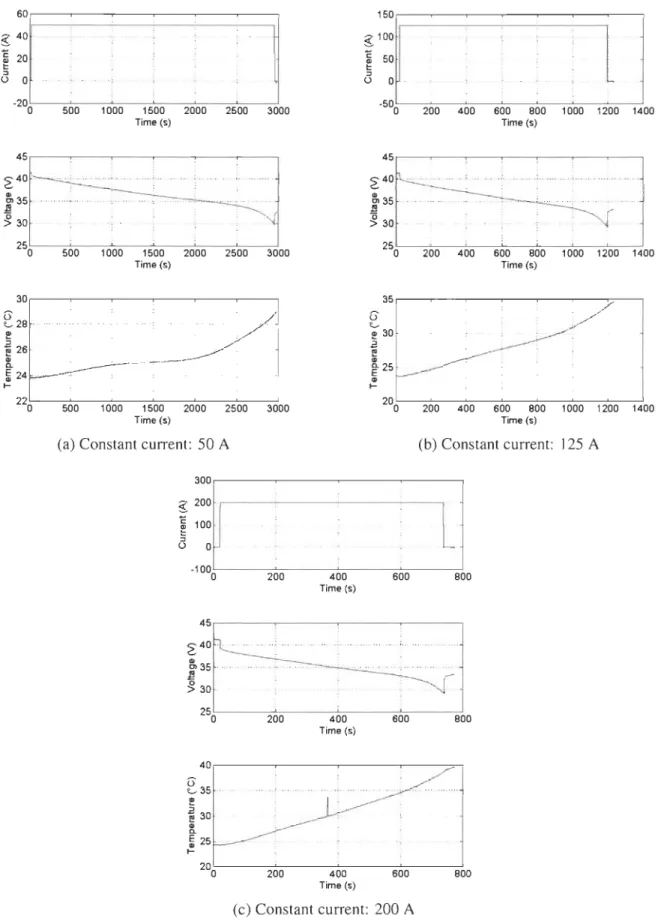
La Figure 2.8 nous présente le comportement de la batterie lors de sa caractérisation dans des conditions de basse température. Une chambre de refroidissement a été mise en place
pour simuler les différentes conditions de température ambiante. Des essais expérimentaux,
à trois valeurs différentes de courant constant, ont été menés pour comparer l'effet de la température ambiante par rapport à l'effet de l'augmentation du courant sur la batterie, voir Figure 2.9. Nous pouvons observer qu'il existe une forte influence de l'amplitude de courant sur le temps de décharge de la batterie, cependant l'effet de la température s'avère
néglige-able. En outre, la Figure 2.9 nous montre une chute de tension, ceci est provoqué par le comportement de la résistance interne de la batterie, qui a subi une forte augmentation de sa valeur due aux basses températures. Également, les tensions de fonctionnement sont réduites du fait qu'un environnement froid allonge la diffusivité de Li+ dans la cellule.
La comparaison du delta de température (.~T) devient un point fort, car il permet de
comprendre le comportement de la température dans la batterie, ce qui pourrait être utile
pour résoudre le problème du démarrage à froid. Par exemple, une amplitude de courant
de décharge élevée peut être appliquée pour réchauffer les cellules. Cependant, l'étude du
comportement au courant de grande amplitude doit être prise en considération vis-a-vis d'une
accélération de la dégradation des cellules et une réduction de la durée de vie de la batterie.
La Figure 3.2 présente le modèle électrothermique. L'estimation des paramètres telles que la résistance interne, la chaleur spécifique et le coefficient de chaleur convective de la batterie se font grâce à la mesure de la tension en circuit ouvert au fil du temps. La tension en circuit ouvert a été présentée sur la Figure 3.5 et le tableau 3.2 regroupe les résultats de chaleur convective multiplié par la surface de la batterie.
La Figure 3.6 nous présente l'estimation de la chaleur spécifique et la résistance interne de la batterie. Après avoir estimé ces paramètres, nous avons obtenu des résultats semblables
Une méthode a été présentée pour obtenir l'énergie résiduelle de la batterie. Pour ce faire,
nous avons pris en considération les pertes thermiques lorsqu'on effectue l'estimation de l'énergie, voir le Tableau 3.3 et la Figure 3.8. Cela nous a permis d'avoir une approximation
plus précise de l'énergie résiduelle par rapport à l'estimation obtenue par un simple comptage
de Coulomb.
Un réseau de neurones artificiels a été développé en fonction de la température et de la tension. L'énergie résiduelle estimée précédemment pour certaines températures ambiantes
a été utilisée comme sortie du réseau de neurones. Comme prévu, l' ANN nous a permis de généraliser et de calculer l'énergie résiduelle de la batterie pour chaque entrée de données de tension et de température, voir la Figure 3.12. Les résultats nous montrent une bonne conver-gence, la marge d'erreur quadratique moyenne est acceptable, aussi bien que les régresseurs qui s'approximent vers l, voir la Figure 3.13.
L'algorithme d'estimation du temps de décharge final (End Of Discharge - EOD) a été
présenté et mis en œuvre. Ceci en reliant la variation du courant et de l'énergie résiduelle finale. Les résultats obtenus grâce à la méthode proposée ont été satisfaisants, l'erreur relative est faible entre la mesure réelle et l'estimation du temps EOD, voir la Figure 3.18.
Pour conclure, dans ce travail nous avons proposé une méthode servant à augmenter
l'efficacité énergétique d'une batterie au Li-ion lorsque le véhicule électrique est exposé à des conditions de basse température. Plus précisément, cette méthode permet au système et à l'utilisateur d'avoir une meilleure prise en compte de la quantité d'énergie consommée et du temps restant avant que la batterie se décharge complètement, ce qui à la fin se reflète dans une amélioration de sa durée de vie.
En résumé, les principales contributions peuvent être énumérées comme suit: (i) afin de déterminer la résistance interne, la chaleur spécifique et la capacité calorifique de la batterie au Li-ion, un modèle simple intégrant les équations thermiques et électriques régissant son
comportement a été développé et analysé, tout en mesurant la tension de circuit ouvert au fil
de l'ensemble des batteries a été considéré, aussi bien que les contraintes d'opération imposée pour le système de gestion; et (iii) la conception d'un algorithme qui pennet l'estimation en ligne du temps restant avant la décharge totale de la batterie a été mise en œuvre.
Mots clés: Batteries au lithium, analyse thennique, stockage d'énergie, gestion d'énergie, estimation de l'énergie résiduelle, réseaux de neurones artificiels, temps final de décharge.
The electrification of transportation presents particular benefits in terms of emissions
(greenhouse gases and partic1es) compared to convention al vehic1es powered by internaI
com-bustion engines.
The operating temperature is a key factor for the performance of aIl electrochemical
de-vices. The amount of energy that can be extracted from batteries depends directly on their
operating temperature (especial1y in extremely low temperatures) and it becomes necessary
to provide an electrothermal model that do not requires a huge quantity of computational
re-sources to run. In addition, it is also necessary to provide a method that al10ws to estimate the
amount of energy extracted from the battery and the quantity of time left before the battery is
fully discharged. This helps to seek a better understanding of the battery's degradation under
low temperature conditions.
The project itself will be divided into six phases: first, the instrumentation of a battery
pack and its test bench; second, the characterization and study of the battery's performance in
winter conditions with different discharge currents; third, the identification of an
electrother-mal model of the battery with its corresponding parameters estimation; fourth, the estimation
of the residual energy in the battery by using a direct method and a trained method; fifth, the
end of discharge time estimation by relating the variance of the current and the final residual
energy in the battery; and sixth, the experimental validation.
The characterization will be studied in discharge and will be set a specific profile for
the charge with its correspondent optimal ambient temperature. Tests at different currents
(50A, 125A and 200A) and different temperatures (+24 oC to -30 oC) will be carried out to
crucial for electric vehicles' autonomy. The consideration ofthese multi-physical interactions represents a major technological challenge. Furthermore, discharging under this temperatures is a technological challenge clearly identified by the US Department Of Energy. AlI these experiments will be performed with a pack and not a single cell. In conclusion, this work will map the battery's energy in winter conditions while helping to understand the severity of the degradation through the end of discharge time estimation.
Keywords: Lithium batteries, Energy management, Energy storage, Energy consump-tion, Residual Energy, Artificial neural networks, Feedforward neural networks, Thermal analysis, Resistance, Thermal resistance, Temperature, End Of Discharge time.
First, l would like to thank my director, Professor Loïc Boulon, for his comments and
constructive criticisms at different stages of my research, they helped me focus my ideas and
l am grateful to him for holding me to a high research standard and enforcing strict validations
for each research result.
l want to thank my co-director, Professor Sousso Kelouwani, for his priceless
contri-butions to make this work possible. He encourages and guides his students to meet high
standards. l am indebted to him for his continuous encouragement and guidance. His
pa-tience and support helped me overcome many crisis situations and allowed me to finish this
work.
l am grateful to Professors Y. Dubé, D. Massicotte, M. Doumbia and A. Skorek for their encouragement and practical advice. l also want to thank to aIl my colleagues at the Hydrogen
Research Institute for the nice working environment and all the different good times shared. Thanks to my friends during my master studies at Trois-Rivières, for the tons of fun
during this years, special thanks to my friends Julien, his family and Antonella for the movies, drinks, dinners, the night time deep talks and aIl great times they shared with me, and huge thanks to Elvira for your patience, the several contributions to my work and overall thank you for the million of great times during this years.
Last but not the least, l would like to thank my family: my parents Hugo and Judith, my
brother Sebastian and my cousin Bibiana. Mom, as many battles we have fought side by side, this is one that l dedicate you completely and for what l want to thank you greatly, thanks for
never let me down.
1 Introduction 1
1.1 Context 2
1.2 Problematic 7
1.3 Objectives . 9
1.4 Methodology 1 1
1.4.1 Test Bench Set Up Il
1.4.2 Battery Characterization 12
1.4.3 Electrothermal Model l3
1.4.4 Residual Energy . . . 13
1.4.5 Discharge Time Estimation . 13
1.4.6 Experimental Validation 14
1.5 Memory Overview . . . 14
2 Li-ion Battery Characterization 15
2.1 Test Bench Description 16
2.2 Discharge Algorithm 18
2.3 Charge Profile . . . . 20
2.4 Battery Discharge Tests . 20
2.4.1 Voltage and Temperature Distribution 22
2.4.2 Optimal Ambient Temperature . 24
2.4.3 Low Ambient Temperatures
.
.
272.6
Conclusion . . . .32
3 Li-ion Battery: Model, Energy and Time 34
3.1
Battery's Electrothermal Model .34
3.1.1
Context .. . .35
3.1.2
Selected Battery Model .36
3
.1.3
Convective Heat Transfer Coefficient CaJculation40
3.1.4
Open Circuit Voltage . . . . . . . . .44
3.1.5
InternaI Resistance and Heat Capacity45
3.2
Residual Energy . . . . . . . . . .47
3.2.1
Simple Residual Energy Estimation48
3.2.2
Residual Energy With Trained Algorithm50
3.3
End of Discharge Time55
3.3.1
Driving Profile56
3.3
.
2
Current Variance and Residual Energy .59
3.3.3
EOD Time Results60
3.4
Conclusion...
.
64
4 General Conclusions and Perspectives 65
A Tests Results for Low Temperature Battery Discharge 75
B Complementary Tables 79
C Equipment Data-sheet 81
1.1 Canada GHG emissions 1990-2012, by economic sector [1] . 2
l.2 Basic technical performance of batteries used in EVs [2] 5
1.3 Energy cost savings - FleetCarma [3] . . . 6
1.4 1981 to 2010 Canadian temperatures, Trois-Rivieres, Quebec [4] 8
2.1 Discharge algorithm. . . . . 19
2.2 Results variation due to Tamb 31
2.3 Characterization discharge energy 31
3.1 Sorne of Nusselt number cases 43
3.2 hs for electrothermal model . . 44
3.3 Discharge energy comparison . 49
3.4 EOD time algorithm
...
61B.l Data of the most representative EVs models on the market [5] . . . 80
C.I List of Equipment Specifications . . . . . . . . . . . . . . . . . . . . . . 81
1.1 HEYs configurations [6] 1.2 BEYs configuration [2]
1.3 Average range reduction - FleetCarma [3]
1.4 Outside temperature at Summit Station in one year [7]
1.5 CrossChasm electric snowmobile [8] .. . . .. . . . .
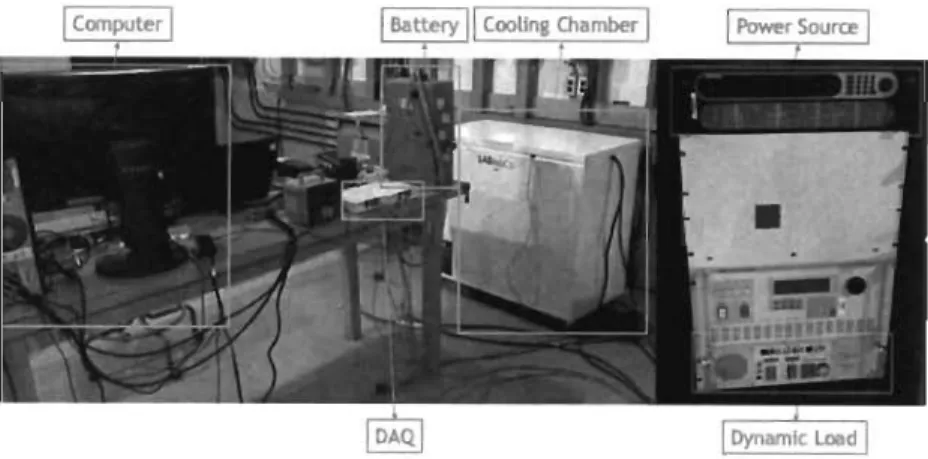
2.1 General workbench photo. .
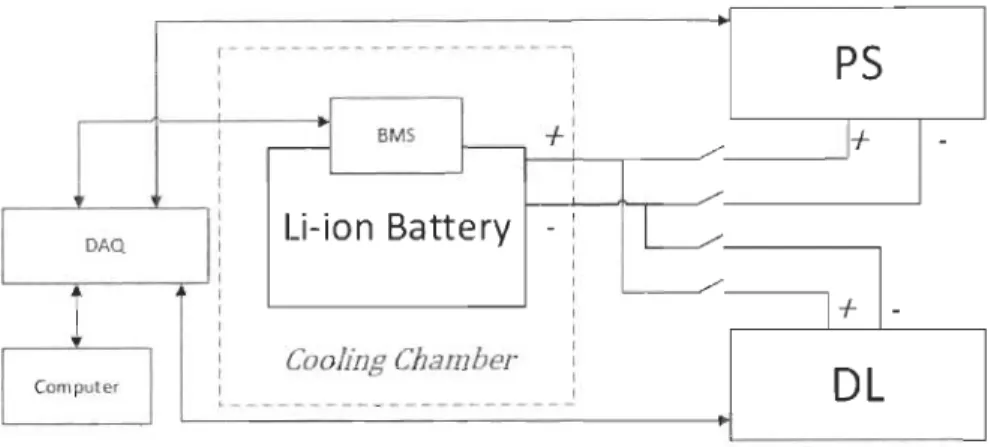
2.2 General workbench schema .
2.3 Temperature sensors distribution for the battery
2.4 Charge profile for Li-ion battery . . . . . . . .
2.5 Temperature and voltage distribution of the battery pack
2.6 Characterization with ambient temperature of 24 oC
2.7 Discharge comparison at 24 oC .. . . .
2.8 Characterization resu!ts for all currents and temperatures
2.9 Discharge comparison for ail currents and temperatures
3.1 Approximated battery model . .
3.2 E!ectrothermal mode! flow chart
3.3 Curve of battery's exposure to cold .
3.4 Current over time . . . . . . . . . .
3.5 Measured CUITent and Yocv at Tamb = - 20°C. 3.6 Estimated values of Ro and specific heat
3.7 Battery temperature . . . . XVlll 3 4 5 Il 12 16 17 18 21 23 25 26 28 30 37 40 41 44 45 46 47
3.10 ANN - MSE for neUl'ons in the hidden layer 51
3.11 ANN training curves 53
3.12 ANN mesh result
..
543.13 ANN regression results 55
3.14 Current profile of the snowmobile 57
3.15 Driving profiles with iBmean
=
50 A and Tamb=
-20 oC 583.16 Variance Vs Residual Energy . . . 59
3.17 Variance and FRE with T amb
= -
20 oC 623,18 EOD time estimation with Tamb
=
-20 oC . 63A.I Characterization with 50 A constant current 76
A.2 Characterization with 125 A constant current 77
A.3 Characterization with 200 A constant current 78
Abbreviations Description
Artificial Neural Network
Battery Electric Vehicle
Battery Management System
Data Acquisition
Dynamic Electronic Load Electric Vehicle
End of Discharge
Feed-foeward back-propagation network
Final Residual Energy Gasoline Vehicle
Greenhouse Gas High amplitude current Hybrid Electric Vehicle InternaI Combustion Engine Levenberg-Marquardt Algorithm Low amplitude current
Mean Squared Error Medium amplitude CUITent
Particle Filtering
Plug-in Hybrid Electric Vehicle
Power Electronic Source
Residual Energy
Snowmobile Current Profile State of Charge
State of Health Greek Letters
Description
Characteristic length of the geometry Coefficient of volume expansion Kinematics viscosity of the ftuid Mean value Thermal relation xx Symbol ANN BEV BMS DAQ DL EV EOD FBN
FRE
GV GHG HAC HEV ICE LMA LAC MSE MAC PF PHEV PSRE
SCP SOC SOH Symbola
f3
v
Il 'rDescription Symbol
Ampere A
Capacity C
Carbon Dioxide C02
Cents of a U.S. Dollar
rt
Degrees Celsius oC Degrees Fahrenheit oF Degrees Kelvin K Energy W Kilogram kg Kilometer km Lead-Acid Pb-acid Lithium Li Lithium-ion Li-ion Minutes min Nickel-Cadmium NiCd
Nickel-Metal Hydride NiMH
Prandtl number Pr Seconds s Sodium Na Volt V Watt W XXI
Introduction
Low temperatures al ways have been a big challenge for any type of electrical and elec-tronic equipment. The exposure of electric vehicles to this harsh condition is not an excep-tion, especially in the Canadian weather. The components of vehicles tend to change their normal behavior in relation with optimal temperature conditions 1. One important component that is basically the heart of electric vehicles is the battery. This component goes through huge chemical reactions in order to provide the energy requested by the vehicle. But, how important is the effect of the temperature in this component? Is it possible to know wh en is it going to be discharged after being exposed to low temperatures? This last question gets high importance due to constant problematic of cold start of electric vehicles.
In order to solve this questions, it is necessary to have a solid and well defined basis for the entire project. AIl work covered in this document is conveniently presented in chapters and its corresponding subsections. This first Chapter will determine the general basis of the research subject, the problematic, objectives and methodology on which the main work is supported.
1 In this document, the optimal or ideal temperature condition is defined by the manufacturer of each com-ponent. It is usually a temperature between 15°C and 30°C.
1.1 Context
Human being activities largely causes climate change to occur, which is a significant risk for a board range ofhuman and natural systems. Over the past several decades research efforts have being increasing to provide a wealth of information to decision makers about the known problems and potential risks posed by climate change. It is not just necessary to have enough research to support strategies for limiting climate change, but also, effective information and decision-support systems that can contribute to improved understanding and more effective decision making flexible enough to identify and pursue emerging research challenges [10].
Currently, the transportation sector represents a very significant percentage of the total greenhouse gas (GHG) that is emitted globally. As can be seen in Table 1.1, just in Canada for 2012 transportation sector represents almost 24 % of total GHG emissions. AIso, al-most 28 % of U.S. GHG emissions can be attributed to the transportation sector, with the overwhelming share in the form of C02 emitted from combustion of petroleum-based fu-e]s. The transportation sector also emits other pollutants that endanger human health. The transportation sector thus stands at the nexus of climate change, human health and economic
Table 1.1: Canada GHG emissions 1990-2012, by economic sector [1]
Greenhouse Gases 1990 2000 2005 2008 2009 2010 2011 2012
Mt C02 equivalent§
NATIONAL GHG TOTAL 591 721 736 731 689 699 701 699
Oil and Gas 101 151 159 162 161 163 164 173
Electricity 94 129 121 113 97 99 92 86
Transportation 128 155 168 166 163 167 166 165
Emissions Intensive and Trade Exposed Industriest 95 92 89 88 75 76 80 78
Buildings 70 82 84 84 82 79 85 80
Agriculture 54 66 68 71 66 68 67 69
Waste and Otherst 48 46 47 48 45 46 47 47
t The Emissions Intensive and Trade Exposed Industries represent emissions arising from non oil and gas mining
activities, smelting and refining, and the production and processing of industrial goods such as paper or cement. :j: "Others" includes coal production, light manufacturing, construction and forest resources.
Note: Totals may not add up due to rounding.
Estimates presented here are under continuaI improvement. Historical emissions may be changed in future
publications as new data become available and methods and models are refined and improved.
§ Ml C02 equivalent, i.e. Million metric tons of carbon dioxide equivalent is a measure used to compare the emissions from various greenhouse gases based upon their global warming potential.
growth [1 1].
In order to electrify transportation it is necessary to understand the types of existent
tech-nologies that are being currently in use or in research state and briefly understand what is
the difference between them and in that way to start seeking what could be the technical or
economical problematic to be solved. Two big technology alternatives to petroleum-fueled
internaI combustion vehicles are the biofuel vehicles and electrical vehicles. The second
technology is the one in which this document is going to be focused.
Biofuel vehicles are basically vehicles that uses bioethanol or biodiesel as a fuel and this
fuel is produced from plant materials or other forms of biomass. Despite that this technology
is already widely used in nations worldwide, there are two big reasons why it can be said that
this technology is not a really good option for replacing the petroleum-fuels: First, analysis
that looks at GHG levels emitted along the biofuel production chain reveals that C02 emission
has no reduction relative to petrol and diesel production and actually emissions levels will
rise; Second, in land matters biofuel crop growth spells economic and environmental disaster,
because not only will the earth run out of food to eat, but cutting down forests that act as
carbon purifiers will exacerbate climate change [12].
(a) Series HEVs
:;3
.,
=ê
.
'" '"ë
,
= (c) Complex HEVs Figure 1.1: HEVs configurations [6]lCE (b) Parallel HEV s :;3 '"
=
3
~. o'=
:;3.,
=
3
<:n' '" o' =In the other hand, electric vehicles (EVs) are a really good alternative when it cornes to
C02 reductions since they consume a little bit of fuels or in sorne cases nothing, depending
in the type of electric vehicle. EVs use electric motors to obtain propulsion and there are
three main different types of EVs: First, there are Hybrid Electric Vehicles (HEVs) that have
both an internaI combustion engine (ICE) and an electric motor for propulsion, which can be
configured in series, parallel or both series/paraI leI, as it can be seen in Figures 1.1 a, 1.1 b
and 1.1 c respectively. In this vehicles the battery is recharged by conversion of breaking
energy; Second, there are Plug-in Hybrid Electnc Vehicles (PHEVs) that are like the HEVs
but the only difference is that the battery can be recharged by external power sources; and
Third, Battery Electric Vehicles (BEVs) that have only electric propulsion and a rechargeable
battery pack [13] that can be recharged by conversion of breaking energy and/or by external
power sources.
To understand more deeply the BEVs, in [2] can be found an introduction of how BEVs
work and it explains their basic configuration as shown in Figure 1.2. Through that article are
also explained the four types of batteries commonly used in EVs with sorne of its technical
specifications, like the ones shown in Table 1.2 and a deeper overview of the four types of
Lithium-ion (Li-ion) batteries that exists.
The use of EVs brings a lot more advantages than just GHG emissions reduction, for
instance money expenses reduction due to lower or zero fuel consumption through time.
Mechanical
Table 1.2: Basic technical performance of batteries used in EVs [2]
Battery Type Lead-acid Ni-Cd Ni-MH Li-ion
Energy Density t (W. kg-I ) 30-50 45-80 60-120 110-160
Power Densityt 180 150 250-1000 1800
Nominal Voltage 2V 1.25 V 1.25 V 3.6 V
Overcharge Tolerance High Moderate Low Very Low
Self Discharge Low Moderate High Very Low
Operating Temperature -20 oC to 60 oC -40 oC to 60 oC -20 oC to 60 oC -20 oC to 60 oC
Cycle Life§ 200-300 1500 300-500 500-1000
t Chargeable electric energy per weight of battery pack
:j: Proportion of dischargeable electric energy to charged energy § The number of charging/discharging cycles in battery's entire life
With this kind of advantages it is necessary to have a huge support from companies to
start spreading EVs into the market and a clear view of this are research and development
companies. At beginning of 2014 the company FleetCarma took it a few steps further. They
made an analysis focused not on the differences within electric vehicle models, but the
dif-ferences between electric and gasoline vehicles as ambient temperature drops. They looked
through FleetCarma's real world database to find out how much the fuel economy of each
vehicle changes under freezing temperatures [3].
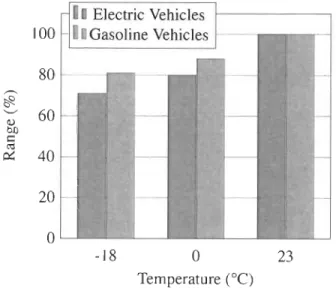
Figure 1.3 shows the average range reduction for electric and gasoline vehicles due to
temperature decrease. When ambient temperature decreases the actively heating components
01 Electric Vehicles
100 Gasoline Vehicles 1- -____ ---.,---1
-18
o
Temperature (oC) 23
Table 1.3: Energy co st savings -FleetCarma [3]
ELECTRICITY COST GASOLINE COST ELECTRIC
PER MILE PER MILE SAVINGSt
73 oF / 23 oC 2.6i 15.0i 12.4i
32 OF / 0 oC 3.3i 17.2i 13.9i
o
oF / -18 oC 3.8i 18.6i 14.8it Per mile averages
are started, like the battery heater for instance, which produces more energy expenditure and hence there is a reduce of range for the vehicles. This figure shows an average range reduction
of 19 % for gasoline vehicles (GVs) and 29 % for EVs when ambient temperature drops from
23 oC to - 18 °C and when it drops from 23 oC to 0 oC there is an average range reduction
of 12 % for GV sand 20 % for EV s. The big gain for electric vehicles can be seen in energy
costs savings, for instance, in Table 1.3 is emphasized how EVs payback improves at lower temperatures, making of it very attractive for the market.
Other companies like Hydro Quebec had a major initiative in the roll out of charging
infrastructure needed to support the arrivaI of plug-in vehicles with the project "The Electric
Circuit", the largest public charging network for EVs in Quebec. Also, they announced the
addition of Quebec's first 400 V fast charge station. The charging station is installed at a
restaurant on Rue Albanel, Boucherville, is accessible to drivers of all-electric vehicles with
quick-charging capability. With ideal charging conditions2, a fast charge to 80 % of battery
capacity will take only about 30 minutes for each one of the BEVs. With cold temperatures
during the winter, it can take significantly longer to charge an EV at a charging station of 400
V, unlike a 240 V station, which is not affected by ambient temperature.
Hydro-Quebec's Boucherville pilot project was Canada's largest field test of BEVs. It
was conducted in collaboration with the City of Boucherville and Mitsubishi Canada. As a
result of this project they find out that the range is strongly related to ambient temperature
and it can be 40 % less in winter. So it can be said that energy consumption depends greatly
on ambient temperature3 [14-16].
To have a wider view of the huge effort that companies are making to spread EVs is
necessary to show a qualitative idea of how popular EVs have become and how EVs have
been spreading through the market, the Table B.I in the Annexe B shows a survey of EVs
on the market. This table is organized by the year in which the EV was released into the market for first time and it shows that for recent years there is a high tendency to use
Li-ion batteries in EV applicatLi-ions. Simply Because, as explained in [17], lithium is the metal
with the highest negative potential and lowest atomic weight, batteries using lithium have the greatest potential for attaining the technological breakthrough that will provide EVs with the
greatest performance characteristics in terms of acceleration and range. Each manufacturer
creates its own Li-ion battery packs and they configure the cells of the pack in series, parallel
or as usually seen, their own series-parallel configuration.
This table also let us know how Li-ion batteries play an important roll to be considered as
domain of research to be widely studied not only in optimal atmospheric conditions, but also
in extreme weather conditions to guarantee the best performance of EVs at all times.
As it was said before and as it will be seen in the subsequent chapters, this work will be
focused in studying the behavior of Li-ion batteries for EVs wh en the vehic1e is exposed to
an ambient temperature below zero degrees Celsius and in the next section will be itemized
the problematic to be studied.
1.2
Problematic
The literature tells us that the characteristics of performance in Li-ion batteries are
sensi-tive to the cell operating temperature. The recoverable power and capacity can be reduced
significantly wh en batteries are operated or stored at low temperatures [18]. These low
tem-peratures also lead to variate the ohmic resistance that reduce the deliverable power and the
extractable energy is significantly reduced. For example, in [19] was discussed that poor
performance of Li-ion batteries at low temperatures is linked to poor charge transfer at the electrode/electrolyte interface. Hence, it is imperative that Li-ion batteries used in BEVs and
HEVs applications be held at temperatures below 50 oC but rapidly heated or self-heated
through cycJing between acceptable limits prior to operating at cold temperatures. In cold temperature environments, batteries must be heated rapidly to improve both cycle life and
energy extraction.
Research in thermal issues for Li-ion battery need further exploration. New, simple and
efficient techniques of energy estimation should be considered to limit capacity fade due to
cold storage. Temperature control to improve performance and better discharge time esti-mation to have a reference in how to increase the amount of energy that can be extracted.
The location of HEVs and BEVs in transport systems for geographic areas where winter
season is extremely long and cold (Quebec cJimate for example, see Table 1.4), requires the
development of reliable and efficient estimation methods for energy and discharge time to reduce the risk of irreversible damage of the battery.
Indeed, exposure of the battery to temperatures below zero degrees for a considerable pe-riod oftime without operation will cause that the internaI temperature ofthe battery gets down
slowly or quickly depending on the characteristics of thermal insulation layers implanted on
it. Previews work have proved that convective heating requires the least heating time, while
mutual pulse heating can consume the least battery capacity. Mutual pulse heating has the additional advantage of uniform internaI heating and is free of convective heat transfer
sys-tem [20]. In addition, long before the lowest temperature is reached (-40 oC typically), the
battery performance degrade rapidly. Thus, autonomy and dynamic performances of vehicJes
Table 1.4: 1981 to 2010 Canadian temperatures, Trois-Rivieres, Quebee [4]
Jan Feb Mar Apr May Jun Jul Aug Sep Oct Nov Dec
Daily Average eC) -12.1 -9.7 -3.6 4.8 12.3 17.6 20 18.9 14.2 7.4 0.5 -7.4 Extreme Minimum eC) -41.1 -35.6 -35 -17.2 -6.1 -1.5 3.5 1.1 -7.2 -10.6 -25.6 -35.5
are greatly diminished [18,19,21,22].
Before thinking in how to prevent the formation of ice wh en the battery is exposed to freezing conditions, first it is important to understand weIl the battery and learn with how much energy we can really work. In real applications, car manufacturers like Honda or Toyota take preventive measures by implementing mechanisms to assist in starting through auxiliary heating system to minimize degradation of the battery [23,24]. But the problem here is that they do not know exactly how much energy is left in the battery or at least how much has been consumed, they are usually based in simple look up tables.
The need of time to prepare the battery to start properly brings an additional complexity in the energy management module of the battery pack. Indeed, this module should be able to know how much energy can give the battery to allow sorne of this energy to be use for the cold start of the EV.
Therefore, in this research project as first necessity is the development of an effective,
simple and approximative electrothermal model that prepares the battery to supply power properly after the EV has been turned off for a period of time in low temperature conditions [25-27].
Since the thermal management of the battery will require to know how much energy it has left, it would be then a second necessity to develop a simple algorithm that estimates the
consumed energy.
A third and last necessity concerns the on-line estimation of the discharge time of the battery by selecting a robust and simple method that can be fitted in any computer of an EV, all this without consuming a large amount of energy from the battery pack.
1.3 Objectives
This work proposes a comprehensive strategy for thermal management and energy man-agement of a Li-ion battery wh en the EVs are exposed to cold weather conditions. This
strategy could generate an optimal and efficient temperature control of the battery, seeking the best electrical performance. All this without forgetting the amount of energy and the physical and temporal limitations of battery pack involved.
The ultimate goal is then to obtain a high energy efficiency by allowing the system and user to have a better acknowledgment of the energy consumption from the battery pack and the available discharge time of the battery wh en the EV is exposed to low temperature con-ditions, which at the end will be reflected in the improvement of battery's life time.
The following secondary objectives are defined according to the problematic previously identified before:
• The development of a strategy and algorithm for temperature control of the battery:
This strategy contemplates an efficient and optimal method to joint the thermal and
electrical equations that rule the battery model, the impact of outdoor temperature on
the thermal evolution of the pack must be taken into account and also the operating constraints imposed by the battery energy management system. Furthermore, different heat exchange phenomena that occur in the pack will be considered to increase the performance of the energy estimation algorithm;
• The analysis and development of a simple method to identify the internaI resistance,
the specific heat and the heat capacity of the battery by measuring the open circuit
voltage through time. For instance, this will let to know how to manage the energy of
the battery required to perform the cold start of the EVs;
• However, it is necessary to have a comprehensive strategy and algorithm to estimate
the residual energy in the pack by using a trained method or even a direct method that allows processing the data in real time;
• The development of an algorithm that allows the on-line estimation of the end of
dis-charge time of the battery pack. This takes special importance wh en the disdis-charge CUITent amplitude varies through time.
1.4 Methodology
The University of Quebec at Trois-Rivières (Université du Québec à TroisRivières -UQTR) is proud to have one of Canada's leading institutions in hydrogen research called
the Hydrogen Research Institute (Institut de Recherche sur l'Hydrogène - IRH) established
in 1994 [28]. Its mission is to advance science and technology for the establishment of a
sustainable energy system for HEVs and BEVs and particularly in the field of energy storage,
its safety and use. This facility also gives the perfect environment to research in the field of
batteries, due to the specialized equipment for performing the battery discharge and recharge
and a cooling cham ber acquired for cold weather environment simulation. AlI the studies for
this work will be performed in the IRH including research and experimental validations.
This work has six different phases to be consider:
1.4.1 Test Bench Set
Up
The test bench will consist of a dynamic electronic load that will permit ta discharge the battery with any profile needed; a power electronic source that allows to recharge the battery with any profile needed; a cooling chamber or specialized industrial refrigerator that will
allow to set its temperature as low as -40 oC; a data acquisition system to receive the signaIs
of the temperature sensors, voltage and cUITent; and finally a workstation computer that will
process and record all the data acquired. All this equipment will be necessary to experiment
on a battery pack formed by ten cells connected in series.
Outside Temperatu re ~r---:---~---:---'r--;~~~~r-~ 4J 20 'Qj L:. ~ -20 oC -40
œ
-60 , , ... -..., ... _ ., .... _---. , ... -.-.... ... _-_ ... . -... . , , -80~----~~~----~~~----~~~----~~~--~7-~~--~~ Jul-15 Sep-15 Nov-1S03/0312015 -03/02/2016
CrossChlsm Electric Snowmobile usee! al us NatIonII ScI8Iœ founûllan c_1 SI
Currently the only snowmobile allowed ln "clean air ~ (of envtronmental _wch studles.
Figure 1.5: CrossChasm electric snowmobile [8]
The battery cells used in this work are manufactured by the German company "GAIA Ad-vanced Battery Systems" and they are classified in America as MIL-SPEC (military grade). The battery pack is composed by ten GAIA battery cells connected in series. The battery pack is constructed by CrossChasm for its Electric Snowmobile used at US National Science Foundation research base named Summit Station in Greenland. In Figure 1.4 is seen the outside temperature at the station with an average value of -22.5 oF or -30.3 oC.
The CrossChasm EV is currently the only snowmobile allowed in "clean air zone" for environmental research studies, see Figure 1.5. CrossChasm is a company with headquarters in Waterloo, ON and also based in Montreal, QC. The focus of this company is to help vehicle manufactures build best-in-class hybrid, electric and plug-in vehicles and guide large-scale end users of those vehicles, such as fleet managers and fleet owners in accurately assessing the fulllife cycle costs of next generation vehicle adoption [29].
More detailed explanation of the test bench will be given in Chapter 2.
1.4.2 Battery Characterization
In this stage the battery will be characterized recording different discharge tests. The tests will be done with five different temperatures and three different currents of discharge. The
characterization will start with low current4 and from ideal temperature5 to low temperature
conditions. AIso, the recharge cycle will be measured once at ideal temperature and taken
into account to characterize the battery.
1.4.3 Electrothermal Model
The study of the electrothermal model will include the constraints of the project. In this
stage, all mathematical representation with electrical and thermodynamic principles will be
expressed in order to define the equations and their variables. For instance, those equations
include variables such as thermal mass of the battery, specifie heat, heat capacity, voltage,
CUITent and so on.
1.4.4 Residual Energy
This phase will have as main objective to identify the residual energy in the battery using
two efficient estimation methods, for instance a trained method like the artificial neuronal
networks (ANN) and a direct method, the results of this methods will be highly necessary
for the next phase of the methodology. The ANN will have as a main inputs the voltage
and temperature and as output will be given sorne curves of energy obtained from the direct
method, this curve estimations are based on measurements taken from the characterization of
the battery.
1.4.5 Discharge Time Estimation
Using the electrothermal model previously defined and the estimation of residual energy
in the battery, it will be created an algorithm to estimate the discharge time. This will allow
to know how much time the driver has before the battery is completely discharged. This
algorithm must be able to run in real time taking into account the data inputs from the EV
4 A CUITent close to the nominal value given by te battery manufacturer
(such as voltage, current, temperature, residual energy estimation) and without requiring a lot of processing resources. Thus, in this phase must be taken into account sorne restrictions:
• The amount of energy available determined by the residual energy estimation method must be respected;
• The time that the EV is going to be stopped and shut down will be previously set by the user and must be respected;
• The thermal system control must adapt continually to the ambient temperature at every instant of time.
1.4.6 Experimental Validation
Every single phase of the methodology proposed will be tested experimentally at the IRH to corroborate previous calculations and to validate if the algorithms and the models proposed are accurate and if the time prediction is satisfactory.
1.5 Memory Overview
This work is organized as follows: Chapter 2 will help the reader to understand more the context of this work and the battery characterization will be introduced and explained, including the general test bench design, the discharge algorithm and the recharge profile; Chapter 3 will give a brief update in the state of art for the concerning topics of this work and the selected battery model will be presented, including the electrothermal equations for the model, also will be presented the residual energy estimation of the battery and the estimation of the discharge time with its respective experimental validation; and finally in Chapter 4, the general conclusions and the perspectives for this work will be presented.
Li-ion Battery Characterization
If we start by defining a battery we find that it is basically a device that converts the
chemical energy contained in its active materials directly into electric energy by means of an electrochemical oxidation-reduction reaction. In the case of a rechargeable system, the battery is recharged by a reversaI of the process. This type of reaction involves the transfer of electrons from one material to another through an electric circuit [30].
The electrolyte of a battery can be a liquid, gel or solid material. Batteries such as lead-acid (Pb-lead-acid), nickel-cadmium (Ni Cd) have used a liquid electrolyte. This electrolyte may either be acidic or alkaline, depending on the type of battery. In many of the advanced
batteries developed for EV applications, the electrolyte is a gel, paste, or resin. These battery types are usually sealed Pb-acid, NiMH, and Li-ion batteries [17].
A Li-ion battery is a primary or secondary battery, depending on its application, with an
organic solvent electrolyte and positive and negative electrodes which utilize an intercalation compound in which lithium is stored [31]. As mentioned before in Chapter 1, the Li-ion batteries have great features as batteries for EVs, for instance: high-energy density can be
at-tained with one charge, this provides a long range or mileage; the high-energy density makes it possible to attain stable power with deep discharge characteristics, this allows
accelera-tion and ascending power capability of the EV; long cycle life with maintenance free and
high safety mechanisms built into the battery; wide acceptance as a recyclable battery from
batteries [17].
As we can see, these great features make Li-ion batteries a perfect choice for EVs ap-plications. However, in Section 1.2 it was questioned that wh en ambient temperature drops drasticalIy, can it be possible to withdraw the same amount of energy from the battery or is the battery going to be completely discharge in the same expected time? This thermal
is-sues need further exploration and new techniques should be explored to avoid cold storage
to limit capacity fade of the battery. In order to solve this issues, it is necessary to start by understanding and characterizing the battery.
In this second chapter is presented the characterization of the battery: It is explained the design of the test bench; the discharge algorithm is introduced and explained; since the battery requires to be not only discharged but also charged, then the charge profile is introduced; the discharge tests at different temperatures and currents are presented and explained; and conclusions are discussed at the end of chapter.
2.1 Test Bench Description
AlI simulations, calculations and estimations presented in this work are based on recorded
test bench data. A detailed description of this test ben ch is provided in this section to picture the data acquisition process properly.
r---~
PS
1 1 1 1 1 .1 1 1-1
BMS+
:
1
+
J
-1 1 1 1 1 1 1Li-ion Battery
1~
-DAQ - 1 11+
I-I 1 1 ~ 1 1 1 1 1 Cooling Chamber 1 1DL
Computer 1-Figure 2.2: General workbench schema
As shown in Figure 2.1 and Figure 2.2, the test ben ch will consist of six main elements: one Li-ion battery pack with a simple Battery Management System (BMS); one data acquis i-tion (DAQ) system to receive the signaIs of the temperature sensors, voltage and current; the DAQ system will be connected to a workstation (Computer) that will process and record ail the data acquired; one power electronic source (PS) that gives up to 100 V - 100 A in order to recharge the battery; one dynamic electronic load (DL) that will permit to request a total power of up to 12 kW if necessary; and a cooling chamber or specialized industrial freezer that will allow to set its temperature as low as -40
o
c.
For this specific case, the Li-ion battery pack is formed by ten cells connected in series and the BMS is dedicated only to security measures such as extreme over heating or extreme high currents that can not be supported by the cells. Each battery cell has a cathode of lithium nickel cobalt oxide (LiNix.xCox.x02) and an anode of graphite. As shown in Figure 2.3, each
cell has a temperature sensor on the positive electrode and three cells have three temperature sensors installed on the walls. These sensors will allow to see the thermal behavior of the cells and the battery pack in general, this will be further explained in Section 2.4.1.
In Figure 2.2 are shown the power outputs of DL and PS connected in parallel to the battery electrodes through security power switches. The DL current and the PS on/off output signaIs are controlled from the computer through the DAQ system. In addition, the DAQ system receives the measurements from ail the equipment, such as the DL voltage and current,
(a) Right Lateral View (b) Left Lateral View
Figure 2.3: Temperature sensors distribution for the battery
the battery voltage, CUITent and temperature (through the BMS), and the PS voltage and CUITent output. The software LabVIEW Il is installed in the workstation computer to control and process aIl the information acquired by the DAQ system. The cooling chamber is set to a defined temperature manually between 0 oC and -40 oC depending on the test required.
More technical detail of the battery cells and equipment can be found on the specifications
listed in Appendix C.
2.2 Discharge Aigorithm
The discharge process is conducted with the algorithm shown in Table 2. l, and an outline of the main step is synthesized hereafter. It is important to follow this procedure in order to not damage the battery due to over passing the limits of design established by the manufac-turer, especially because the goal of the characterization is not to degrade the battery, but to know how it behaves in between its ranges of operation.
Table 2.1: Discharge algorithm
Algorithm 1. Discharge test.
Set
-Restriction values VSm;n and T max
- Sample time of 1000 ms Specify
- Type of discharge for is: Driving CUITent profile or constant CUITent profile
Inputs
- Vs(t), is(t), T(t) voltage, CUITent and temperature of the battery, respectively
1: Initialization of elapsed time t to zero
2: Start discharge
3: Apply selected CUITent profile
4: Measure and record is(t), Vs(t) and T(t)
5: Compare and verify, if Vs(t) < VSm;n then go to step 7, if not then go back to step 4 6: Compare and verify, if T(t) > T max then go to step 7, if not then go back to step 4
7: End of discharge
First are set the restriction values of the minimum voltage and the maximum temperature supported by the battery and also the sampling time is set. The restriction values are given by the battery cell manufacturer, see Appendix C. Then, it is demanded to the battery a current profile that can be either constant or a specified driving profile from an EV. This current profile will be imposed by the DL. At every sample time the voltage, current and temperature are measured and recorded. Then it is compared the battery voltage against the minimum restriction value and the battery temperature against the maximum restriction value. If any of those values are under or over, respectively, then the DL will stop requesting current and the discharge will be completely finished.
In this algorithm T(t) is the temperature measured through time, is(t) is the current, VB (t)
is the voltage of the battery, V Bmin is the minimum voltage recommended by the manufacturer
and T max is the maximum temperature recommended by the manufacturer. The sample rate
of the algorithm is equal to one second, this value was chosen in order to have the maximum available data without overloading memory and machine resources of the workstation.
2.3 Charge Profile
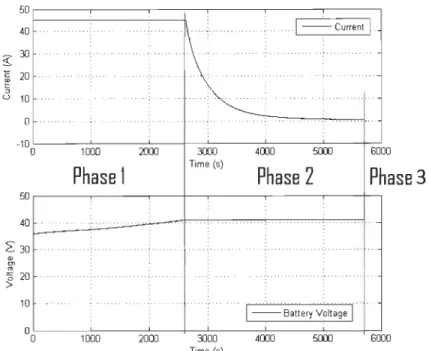
As mentioned before in Section 2. 1, the PS can be programed or controlled remotely to impose any desired profile to charge the battery. In this case the profile of charge recom-mended by the manufacturer is the weIl known charging regime constant current -constant voltage or also known as CC/CV charging regime, the explanation of the charging algorithm for Li-ion batteries is weIl explained in [32].
After the battery was completely discharged we proceed to charge it. Since the scope of this work is not focused in the effect of the charge at low temperatures, then the charge only starts wh en the battery is under optimal ambient temperature conditions and its internaI temperature is within the optimal recommended temperature range, this to ensure the lowest degradation possible for the battery.
In Figure 2.4, a recorded charge cycle made to the battery with the test bench shows the three main phases of the charge protocol. In the first phase the PS gives a constant current to the battery icc = 1 C, where C is the nominal capacity of the battery in Ah (C
=
45 Ah), and the voltage starts to raise. The second phase starts when the maximum recommended voltage of the battery is reached V Brnax = 41.7 V. The PS keeps this voltage constant and lets thecurrent to decrease with a slope required by the battery. Finally, the third phase starts when the current of the battery has reached iccmin = C /100. When the battery is in the third phase we can say that the battery is fully charged and the charging process stops.
This same procedure was used every time that was required to charge the battery.
2.4 Battery Discharge Tests
There were used three different currents to test and characterize the battery. The three val-ues of this currents were established considering the normal current operation range required by the snowmobile and the recurrence of the mean currents used by it. Since 50 A is the typical average current used by the snowmobile, there were selected the following currents:
~.---~----.---.-.---,,---,----~ 40 _30 ~ ]i 20 . ~ ( j 10 o .
1
- -
Curren!r
·
-10 L -_ _ _ _ '__ _ _ _ _ _'__ _ _ +-_'__ ____ ___'_ ____ _'_ __ _+-::-::' o 1000 2000 3(()J 4000 SIDJ 6roJPhase 1
lime (5)Phase 2
Phase
3
50,---~----~--r_~----._---,--_+~ ~30 · ~ '" -'520 . . . i··· > 10 O~----'---'----~-'---'---'----+~ o 1000 2000 3000 4000 SIDJ 6000 lime (5)
Figure 2.4: Charge profile for Li-ion battery
1.1 C
=
50 A, 2.7C=
125 A, 4.4C=
200 A. It is necessary to remark that the battery shouldnot have any difficulties to deliver this currents because the maximum discharge current
es-tablished by the manufacturer is 10C
=
450 A and the recommended discharge current forregular use is 2C
=
90 Al.During the characterization was introduced the distribution of temperature and voltage of
the cells. It was also studied the effect of the ambient temperature on the behavior of the
battery. The battery was considered completely discharged wh en it reached the minimum voltage of V Bmin = 27 V or VSmincell = 2.7 V jcell, this applies for aIl the tests performed
dur-ing this work.
With the aim of comparing the results, it was required a discharge protocol. This protocol
ensures that the discharge cycle is al ways executed under the same conditions and it was
conformed by 5 stages:
1. Starting with the battery completely charged, the cooling chamber temperature is set to
the low ambient temperature required for the test;
2. Meanwhile, the battery is kept in the cham ber until its temperature reaches thermal equilibrium, i.e. the temperature test, if the temperature test is 24 oC then the cooling chamber is not required;
3. This step is the core of the discharging protocol. Here is performed the discharge of the battery. The aim of this test is to fully investigate the discharge behavior of the cell, however battery's degradation is crucial as regards [33] and because of this, the recommended limits of the battery will be monitored at all times.
4. Once the discharge cycle is done, the cooling chamber is set to room temperature. The battery is left inside warming slowly until it has the same temperature of the room;
5. The charge process is performed with the protocol presented in Section 2.3. Since the temperature of the battery rises during the charge, then it is necessary to let the battery to cool down until it reaches the same room temperature before the next discharge test. It is also important to remark that all the data and figures presented in this entire work are comparable between each other. In the following subsections are explained in detail the tests of the third step of the protocol made to characterize the battery.
2.4.1 Voltage and Temperature Distribution
As mentioned in Section 2.1 there are three temperature sensors on the walls of three cells and one sensor in each positive node of the cells that will allow to see the thermal behavior of the cells and the battery pack in general. The sensors on the walls of the cells were located at
the top, middle and bottom. The cells chosen to have sensors on the walls were the number one, six and eight. This three cells were chosen due to their location inside the battery pack,
since the number one is located at the top, number six is located at the bottom and number eight is located at the middle, see Figure 2.3.
In literature [34] has been discussed that other authors have proven the non-uniformity of the temperature of the core (Tcore ) along the cell core, but a more sophisticated model, such
![Table 1.1: Canada GHG emissions 1990-2012, by economic sector [1]](https://thumb-eu.123doks.com/thumbv2/123doknet/14616991.733202/24.918.195.825.728.950/table-canada-ghg-emissions-by-economic-sector.webp)
![Figure 1.2: BEYs configuration [2]](https://thumb-eu.123doks.com/thumbv2/123doknet/14616991.733202/26.918.404.611.812.1052/figure-beys-configuration.webp)
![Figure 1.4: Outside temperature at Summit Station in one year [7]](https://thumb-eu.123doks.com/thumbv2/123doknet/14616991.733202/33.918.183.841.875.1062/figure-outside-temperature-at-summit-station-one-year.webp)
![Figure 1.5: CrossChasm electric snowmobile [8]](https://thumb-eu.123doks.com/thumbv2/123doknet/14616991.733202/34.918.275.741.108.401/figure-crosschasm-electric-snowmobile.webp)