HAL Id: hal-02588927
https://hal.inrae.fr/hal-02588927
Submitted on 15 May 2020HAL is a multi-disciplinary open access
archive for the deposit and dissemination of sci-entific research documents, whether they are pub-lished or not. The documents may come from teaching and research institutions in France or abroad, or from public or private research centers.
L’archive ouverte pluridisciplinaire HAL, est destinée au dépôt et à la diffusion de documents scientifiques de niveau recherche, publiés ou non, émanant des établissements d’enseignement et de recherche français ou étrangers, des laboratoires publics ou privés.
Aquastress D2.1.2 - Final report
M. Manez, D. Inman, S. Schmidt, K. Tarnacki, E. Preziosi, P. Koundouri, S.
Loubier, C. Sullivan, S. Panebianco, I. van den Wyngaert, et al.
To cite this version:
M. Manez, D. Inman, S. Schmidt, K. Tarnacki, E. Preziosi, et al.. Report on current state of the art and major knowledge gaps to characterize water stress in different sectors. Aquastress D2.1.2 - Final report. irstea. 2006, pp.36. �hal-02588927�
AQUASTRESS
Mitigation of Water Stress through new Approaches to Integrating Management, Technical, Economic and Institutional Instruments
Integrated Project
D2.1-2
R
EPORT ON CURRENT STATE OF THE ART AND MAJOR KNOWLEDGE GAPS TO CHARACTERIZE WATER STRESS IN DIFFERENT SECTORSDue date: 31-03-06
Actual submission date: 06-07-06
Start date of project: 1-02-05 Duration: 48 months
Deliverable Lead contractor:
(Organisation name) USF
Participant(s) (Partner short names) ALTERRA, CEMAGREF, CNR. IRSA, CRANFIELD,
NERC-CEH, RWTH, UHANN, UoR, USF
Author(s): M. Manez, D. Inman, S. Schmidt, K. Tarnacki, E.
Preziosi, P. Koundouri, S. Loubier, C. Sullivan, S. Panebianco, I. van den Wyngaert, M. Bauer, E. Moors, A. Olsthoorn
Contact for queries: Dr. Maria Manez
USF-Barbarastrasse 12-G66 49076 Osnabrück (Germany) tel. +49-541-9692424
mmanez@usf.uos.de
Dissemination Level (1): PU
Deliverable Status: Final Report
(1)
(PU=PUblic, PP=Restricted to other Programmes Participants, RE=REstricted to a group specified by the consortium, CO=COnfidential only for members of the consortium)
Doc Name: Deliverable ID: WP 2.1 D2.1-2.pdf Date: 06/07/2006
Dissemination level: PU – Final Report 1
CemOA
: archive
ouverte
d'Irstea
Table of Contents
A
QUAS
TRESS...1
Table of Contents ...2
State of the art of water stress in the different sectors ...3
1.1 State of the art of water stress in the domestic sector... 3
1.1.1 Domestic Water Use...3
1.1.2 Determination of water use efficiency...4
1.2 State of the art of water stress in the agricultural sector... 5
1.3 State of the art of water stress in the industrial sector ... 9
1.3.1 Industrial water use...9
1.3.2 Determination of water use efficiency...12
1.3.3 Water stress in the industrial sector ...12
1.3.4 Reasons for industrial water stress ...13
1.3.5 Strategies to cope with water stress within the industrial sector ...13
1.4 State of the art of water stress in the tourist sector ... 13
1.4.1 Overview of impacts of tourism on freshwater sources ...14
1.4.2 Causes...16
1.4.3 Tourism activity and trends in water consumption...17
1.4.4 Opportunities to reduce tourism water consumption and its impacts on the environment 18 1.5 State of the art of water stress in the environment... 19
1.5.1 Critical levels, loads and resilience...19
1.5.2 Assessment of ecosystem condition, integrity or health...20
2.
Major knowledge gaps to characterize water stress in the
different sectors ...21
2.1 General comments on gaps ... 21
2.1.1 In regard to water availability ...21
2.1.2 In regard to seasonal variation ...21
2.1.3 How much of the recharge can be accounted for as available groundwater resource? .22 2.1.4 In regard to quality of waters ...22
2.2 Knowledge gaps to characterize water stress in the different sectors ... 23
2.2.1 Domestic sector ...23
2.2.2 Agricultural sector ...26
2.2.3 Industrial sector ...27
2.2.4 Tourism (service industry) ...29
2.2.5 The environment...30
2.3 What next? Using the results of the Aquastress WSM ... 31
Acknowledgements...32
Reference list...32
Annex ...36
Doc Name: Deliverable ID: WP 2.1 D2.1-2.pdf Date: 06/07/2006
Dissemination level: PU – Final Report 2
CemOA
: archive
ouverte
d'Irstea
State of the art of water stress in the different sectors
1.1 State of the art of water stress in the domestic sector
This section discusses the state of the art and major knowledge gaps in characterising water stress in the domestic sector. One of the major barriers to understanding domestic water demand, and therefore a barrier to mitigating domestic water stress, is the high level of disaggregation of end-uses (Michelson et al, 1999; Renwick and Green, 2000; Turner et al, 2004). This means that intensive data collection, which usually requires the installation of individual meters in households, is necessary in order to understand domestic water consumption patterns. Absolute demand in any one year will not prove useful because it does not account for other factors such as climate variables or restrictions which can significantly change household demand from year to year. This problem, which is unique to the domestic sector due to the large number of individual end-users, underlies many of the knowledge gaps discussed below.The following section (Section 1.1) first introduces the concept of minimum human requirements using a number of referenced examples. We then compare average water demand in various European countries using data supplied by the European Environment Agency (EEA, 2003) as a comparison to the minimum human requirements.
1.1.1 Domestic Water Use
The simplest indicator of domestic water demand efficiency is daily, monthly or annual volumetric per capita use. A simple measure of water use efficiency can use a comparison between water uses in different regions or a hypothetical comparison between basic human needs and actual water consumption. Basic human needs vary for different regions due to climate, cultural, and economic factors. One approach is to use a volume based on the minimum human water requirements. The WHO/UNICEF (2000) adopt a figure of 7.3 m3/capita/year (20 l/day/capita) accessible from a source within 1 km of a user's dwelling as achieving "reasonable access" to water. Because of economic and cultural reasons, the volume of water consumed in any society varies significantly and the WHO/UNICEF figure is far below the level of domestic water use in most developed countries and makes no allowance for the needs to maintain even a non-agricultural economy. A figure of 18.3 m3/cap/year (50 l/day/capita), as suggested by Gleick (1996) could be taken as a minimal domestic water requirement, but this figure makes no allowance for industrial needs since it is based only upon estimates of the amounts of water required for drinking, sanitation, bathing and food preparation at a minimal acceptable basic level. For this reason, when estimating the cost of supplying an adequate volume of potable water to all people at all times, the figure of 125 m3/capita/year could be adopted, as proposed by Shuval (1992). Domestic needs as well as
modest industrial and gardening needs are incorporated in this figure.
The total water use for domestic purposes in Europe is 56,458 Hm3/year which amounts for 18 % of total abstraction. During the period 1993-1999 the urban use per capita slowed down from 285 to 271 litres/per capita/day. Over this period, many changes occurred which influenced the patterns of urban water use. Changes include: increasing urbanisation, changes of population habits, use of more efficient technologies and water saving devices, use of alternative sources of water (desalination, wastewater re-use), increasing metering, and the use of economic instruments (water charges and tariffs). Connection of the population to water supply systems has also increased, especially in Mediterranean countries. Nevertheless there are important variations between regions and countries (EEA, 2003).
Water use per capita in the Nordic countries is higher than in Central Europe and varies between 290 litres/per capita/day in Sweden to 771 litres/per capita/day in Iceland. Some studies suggest that this high use is related to personal washing and dishwasher use. In Central Europe the variations are between 186 litres/per capita/day in Germany to 342 litres/per capita/day in Ireland. These variations reflect differences between the structure of water supply systems and water saving measures applied. The northern Accession Countries use 26 % of their abstraction for urban purposes. Baltic countries have the lowest water use per capita, together with Czech Republic, Poland and Hungary. The
Doc Name: Deliverable ID: WP 2.1 D2.1-2.pdf Date: 06/07/2006
Dissemination level: PU – Final Report 3
CemOA
: archive
ouverte
d'Irstea
restructuring of the economy and the institutional framework in these three countries accounts for the decline. Bulgaria, Romania and Slovenia with 805, 336 and 339 litres/per capita/day respectively, have the highest urban water use per capita. The high levels of use in Romania and Bulgaria can be explained by the number of breakdowns in water-supply networks, water losses and water wastage. The southern Accession Countries use 13 % of their abstraction for urban purposes. There is a consistent decrease in the late 1990s (from 224 litres/per capita/day in 1995 to 183 litres/per capita/day in 1999) with the exception of Cyprus, where the urban water use increased steadily throughout the whole period considered. The share of urban water in southern Europe is 16 % of its total abstraction, the lowest in Europe with the southern Accession Countries. The relative high use per capita in Mediterranean countries, around 350 litres/per capita/day in 1999, reflects their hot climate (increase in water for showering, garden use, public services), and the trend reflects mainly changes in lifestyle derived from increasing urbanisation (EEA, 2003).
1.1.2 Determination of water use efficiency
The main causes of variation in regional domestic per capita demand are variation in affluence (i.e. higher affluence = more water intensive goods = higher consumption), household occupancy, outdoor use, rural/urban types, and also unaccounted for water (UFW) (i.e. system leakage). The graphs overleaf show how water demand in the UK varies according to household characteristics such as micro-component use (Figures 1) and occupancy (Figure 2) impact on per capita consumption. Household occupancy, and other variables, can significantly affect the aggregate consumption levels in a region. However, the exact cause of the frequency of different levels of demands, shown in Figure 3, requires intensive data collection and analysis. Regression analysis is often used to identify correlations between the variables mentioned above and water demand (e.g. Kanakoudis, 2001, Baumann et al, 1998). Micro-component use can also be used to measure domestic water use efficiency. The data in Table 1 was collected from a number of sources (Ofwat, 2002). Most significantly it shows that outdoor water use and high volume toilets can contribute significantly to high domestic demand.
Table 1: MICRO-COMPONENT USE IN SIX COUNTRIES (OFWAT, 2002)
and Wales England Scotland Finland Switzerland USA Australia
Toilet flushing 33 31 14 33 11 20
Bathroom 20 32 29 32 8 26
Kitchen 17 35 34 19 16 20
Miscellaneous 27 <1 21 14 7 -
External 3 1 2 2 58 34
Doc Name: Deliverable ID: WP 2.1 D2.1-2.pdf Date: 06/07/2006
Dissemination level: PU – Final Report 4
CemOA
: archive
ouverte
d'Irstea
Figure 1: Per capita water demand vs. household size (Jacobs, 2004)
Figure 2: Frequency Histogram of per capita demand (Jacobs, 2004)
1.2 State of the art of water stress in the agricultural
sector
Several reasons justify crop irrigation. First of all, the irrigation makes it possible to increase yields and to get an insurance against climatic risks thus guaranteeing higher and less variable incomes for farmers. The irrigation also makes it possible to diversify the production and thus to make the farmers less dependent on the conditions of market than in the event of monoculture. Lastly, for a few decades, the recourse to the irrigation has been often justified by the need for increasing the quality of the products and for limiting variability of it in order to ensure itself of the outlets near the food industries or the intermediaries of the distribution. For many countries, the control of the irrigation is then a considerable stake in terms of agricultural development, national food security and more
Doc Name: Deliverable ID: WP 2.1 D2.1-2.pdf Date: 06/07/2006
Dissemination level: PU – Final Report 5
CemOA
: archive
ouverte
d'Irstea
generally in terms of economic development. By the past, irrigation played a major role in the satisfaction of food needs, in the poverty reduction and in the development of life conditions in rural areas. The irrigation extended horizontally in term of surface where the conditions of production are less favourable and vertically by a rise of the production per unit of ground by intensification (Pereira 1995).
In 40 years, the world irrigable area tripled. It accounts for 1/6 of the actual agricultural area and provides 1/3 of the food supply (Waggoner 1994). In 1990, Rangeley estimated that during the last 25 years, 50% of the increase in food production did come from irrigated lands and FAO (1996) forecasts that during the next 50 years, 60% of the new needs will have to be satisfied by irrigated agriculture. However, the growth of the irrigation is constrained by two key factors which are the availability of the resource and the scarcity of the capital to finance the new projects more and more costly. Indeed, Seckler et al. (1999) estimate that a quarter of the world population lives in areas which will have to face extreme scarcity of water during the first 25 years of this century. In the field of hydraulic infrastructures, the cost of new schemes is high and rising. In 30 years, the irrigated area doubled in India and Indonesia, it tripled in Sri Lanka, it increased by 50 % in the Philippines and 40 % in Thailand (Carruthers et al.. 1997). The rising costs, the decline of cereals prices (partly due to the agricultural policies of the OECD countries) and the disengagement of international donors, leads to a low profitability rate of new irrigation systems (Carruthers et al.. 1997).
A prospective analysis of the water requirements for various countries at the horizon of 2025 was carried out by IWMI (Seckler et al.. 1998). This study relates to 118 countries gathering 93 % of the world population and holds account of the evolution of the domestic, industrial and environmental needs. Two scenarios of efficiency of irrigation were tested: reproduction of the efficiency of 1990 and improvement of efficiency. Without holding account of the constraints of mobility of the resource, it appears that to satisfy the food requirements in 2025, according to scenarios', the irrigated surface should grow from 13 to 60 % and the requirements out of water for 23 to 56 %, i.e. an improvement of the efficiency of irrigation would make it possible to satisfy 50 % of the future water requirements (Seckler et al.. 1999). The 118 studied countries were classified in 5 groups (Figure 1) according to an optimistic scenario of improvement of the efficiency of irrigation.
Group 1regroups countries which will have to reduce the agricultural withdrawals and consequently to import foodstuffs of the 4 other groups (Seckler et al.. 1998; FAO 2002). Groups 2, 3, 4 are groups which will have to increase their consumption, therefore their infrastructures, respectively of more than 200 %, 25 to 100 % and less than 25 %, whereas group 5 can, according to cases, reduce its consumption till 2025. Seckler et al.. (1999) studied India and China separately, fault of not having been able to classify these vast and heterogeneous countries in one of the previous groups. According to these authors, world food safety should depend on the capacity of India to increase its efficiency of irrigation and of China to transfer its water from north to south.
Figure 1: Indicator of relative water scarcity (Source: (Seckler 1999)
Doc Name: Deliverable ID: WP 2.1 D2.1-2.pdf Date: 06/07/2006
Dissemination level: PU – Final Report 6
CemOA
: archive
ouverte
d'Irstea
Groupe de pays 1 (17) 2 (24) 3 (35) 4 (19) 5 (21) Chine et Inde (2)
But this study neglects two essential constraints: climatic change and the relative scarcity of the capital of each group for at the same time investing in the infrastructures and developing programmes of improvement of the efficiency of irrigation.
However, the increase in the hunger in the world at the horizon of 2060 would lie between 0 and 300 % according to climatic scenarios' tested (Chen et al.. 1994). The climatic change should increase the outputs in the countries with high and average latitudes and reduce them to the weaker latitudes, in particular in the near total of the African continent (Parry et al.. 1999). In spite of the positive effects that a CO2 rise would have on the outputs, Lal et al.. (1998) estimate that those would be more than compensated by the fall of productivity due to the thermal and hydrous stress. But research on the climatic change also neglects, often, to integrate the effects policies aiming at inflecting the climatic change. However, from an energy point of view, one can reasonably make the assumption that irrigation could be in competition with hydroelectricity, arable lands in competition with afforestation (Rosenberg et al.. 1994) and food production in competition with biological fuel production.
Preceding studies, in particular that of Seckler et al.. (1998), project the slowing down of the yields rise already notice during past years, on cereals in particular, and identify this deceleration as being one of the explanatory factors of the food insecurity at the horizon of 2025. This thesis is however not supported by all the authors. Some (FAO 2002) estimate indeed that 2/3 of the food production rise (in 2030) could come from yields improvement and that the growth of the irrigated area could account in 2030 for only 1/3 of the growth noted during the thirty last years.
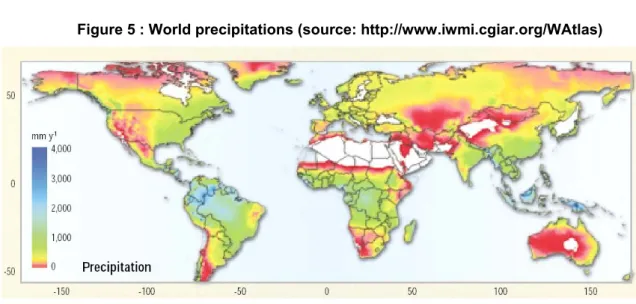
“Sustainable water management is the key factor to countries to achieve sufficient food production. However, irrigation is also associated with negative economic, environmental, social and political consequences. For this reason there is a great deal of interest in meeting future food needs through rainfed agriculture as a partial substitute for irrigation”. The potential for rainfed agriculture (figure4) is derivated from evapotranspiration (figure 5), rainfall (figure 6) and soil maps. “On a global scale, 46% of the earth’s surface is unsuitable for rainfed agriculture due to climatic constraints. This leaves approximately 7 billion ha with a potential for rainfed crop production, of which, 4.7 billion ha is classified as moderate to highly suitable. Researchers are currently refining this preliminary estimate taking into consideration non-climate related factors (e.g. areas not available for conversion to agriculture)”.
Doc Name: Deliverable ID: WP 2.1 D2.1-2.pdf Date: 06/07/2006
Dissemination level: PU – Final Report 7
CemOA
: archive
ouverte
d'Irstea
Figure 3 : Potential for rainfed agriculture on a global scale (source:
http://www.iwmi.cgiar.org/WAtlas)
Figure 4 : World evapotranspiration (source: http://www.iwmi.cgiar.org/WAtlas)
Figure 5 : World precipitations (source: http://www.iwmi.cgiar.org/WAtlas)
Doc Name: Deliverable ID: WP 2.1 D2.1-2.pdf Date: 06/07/2006
Dissemination level: PU – Final Report 8
CemOA
: archive
ouverte
d'Irstea
1.3 State of the art of water stress in the industrial sector
1.3.1 Industrial water use
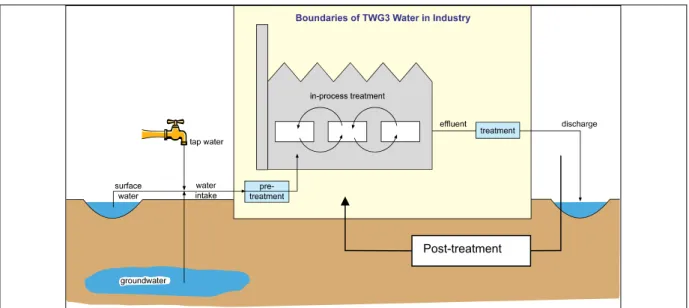
Every year about 25,400 million m³ of water is used in the European Union for industry, excluding cooling, about 14 % of total European water abstraction (EEA, 1999). Large variations can be observed among countries and industrial sectors. In the industrial sector water is used for many very different purposes and depending on the application different requirements on the freshwater quality are set (van de Worp, 2002). Main water users are chemical, iron, steel, metal and pulp and paper industries (EEA, 2000b). The boundaries for industrial water use can be set as in Figure 6, including pre-treatment, in-process treatment for recycling and wastewater treatment before discharge. Water can be part of the product (raw material) as in the food and beverage industry, but also be used as transport or cooling medium in the pulp and paper and metal industry or can be used for washing or rinsing in the metal and textile industry (WSSTP, 2005). Cooling water is mainly returned to the water cycle unchanged, apart from increased temperature and some contamination by biocides. The amount of cooling water exceeds the amount of water used for the rest of industry (EEA, 2000a). In the industry water can leave the system either due to consumption or due to discharge into surface water or sewage network after use and recycling. Evaporative losses and water as part of the product are considered as consumptive use (Figure 7).
In Figure 8 total water abstractions and water consumptions as a percentage of total renewable freshwater resources in Europe are presented. Very high water consumptions compared to total water abstraction are observed in Italy, Spain and Greece where large amounts of water are used for irrigation and often inefficient irrigation systems are applied (Figure 10).
Figure 6: Water in Industry, according to TWG3 of WSSTP (WSSTP, 2005)
Post-treatment
Figure 7: Water use in industry (CH2M Hill, 2003)
Doc Name: Deliverable ID: WP 2.1 D2.1-2.pdf Date: 06/07/2006
Dissemination level: PU – Final Report 9
CemOA
: archive
ouverte
d'Irstea
Industry
Discharge (Contact with Conduct) Discharge (Non.-Contact)Return - Flow
Water Reuse Water Input Evaporative LossesConsumptive use
Water in ProductIndustry
Discharge (Contact with Conduct) Discharge (Non.-Contact)Return - Flow
Water Reuse Water Input Evaporative LossesConsumptive use
Water in ProductFigure 8: Water abstraction and consumption in Europe (EEA, 2000a)
Doc Name: Deliverable ID: WP 2.1 D2.1-2.pdf Date: 06/07/2006
Dissemination level: PU – Final Report 10
CemOA
: archive
ouverte
d'Irstea
Figure 9: Sectoral water use in Europe (EEA, 2000a)
In countries with high industrial water use (France, Czech Republic, Germany, Belgium, Netherlands, Norway etc.) water consumption is comparably low (Figure 8) since water is mainly used for cooling (Figure 10).
Depending on the industry various requirements for water quality are defined. High quality standards are required in the food industry but also for boiler feed water for high pressure tanks (EC, IPPC, BREF Documents) but also in other industry types certain water quality is required or recommended (e.g. in DIN norms). Depending on the application and the industry type water can be contaminated with various pollutants (organic and inorganic substances, heavy metals, hormones, biotoxic substances, micro-organisms, finishing chemicals etc., Figure 10, example for pulp and paper industry, WSSTP, 2005). Especially when water is in direct contact with chemicals and additives its quality is altering and wastewater can not be directly discharged into surface water or be recycled in the process without any additional treatment. Innovative and complex and often very energy and cost intensive treatment technologies are necessary to ensure the removal of all contaminants from the wastewater and high recycling potential (EEA, 2001).
Figure 10: Processes and water flows with contaminants within a kraft pulp mill (EC, IPPC, 2004)
Doc Name: Deliverable ID: WP 2.1 D2.1-2.pdf Date: 06/07/2006
Dissemination level: PU – Final Report 11
CemOA
: archive
ouverte
d'Irstea
Wood
handling Cooking screeningPulp washingPulp Oxygendelign. Washing Bleaching dryingPulp
Bark Fibres Sand Dissolved organic Subst. Toxic Subst. Fibres Dissolved organic substances Fibres Dissolved organic substances Chlorinated substances Chlorate Phosphorous Nitrogen Salts Tanks Recovery boiler Black liquor Temporary emissions Temporary emissions Temporary emissions Fresh water Lime reburning White liquor preparation Dissolved organic substances Condensate treatment Dissolved salts Spills Wood
handling Cooking screeningPulp washingPulp Oxygendelign. Washing Bleaching dryingPulp
Bark Fibres Sand Dissolved organic Subst. Toxic Subst. Fibres Dissolved organic substances Fibres Dissolved organic substances Chlorinated substances Chlorate Phosphorous Nitrogen Salts Tanks Recovery boiler Black liquor Temporary emissions Temporary emissions Temporary emissions Fresh water Lime reburning White liquor preparation Dissolved organic substances Condensate treatment Dissolved salts Spills
Many companies are covering their freshwater demand either with water from public supply system, or surface water or are using own water sources such as own wells or treated wastewater and recycling. The wastewater is often pre-treated in own wastewater treatment plants and after that directly discharged into surface waters or discharged in the sewerage system to be treated with municipal wastewaters. In many countries wastewater qualities are strictly regulated and fees for exceeding the quality limits are risen for the companies to enforce the general compliance of the parameters.
1.3.2 Determination of water use efficiency
Due to the large variety of industrial processes and products, often accompanied by insufficient data availability the determination of water use efficiency is often difficult. Two approaches are mainly used to compare and calculate the water use:
1.) Specific water use related to product (m³ water/t or l product)
2.) Specific water use related to output of the sector in monetary terms (m³ water/ € added value) (EEA, 1999)
1.3.3 Water stress in the industrial sector
One of the main pressures on water stress is high water abstraction for all sectors. Considering the water stress definition used in the AQUASTRESS project (“Water stress occurs when the functions of water in the system do not reach the standards (of policies) and/or perceptions (of the population) of an appropriate quantity and quality, at an appropriate scale and the adaptability for reaching those is not given”, D2.1-1, 2005) water stress in the industrial sector can appear in different forms.
Water stress due to the industrial sector to other sectors:
• Wastewater discharge into the surface waters without adequate treatment • Large water quantities abstracted for industry limit other water users Water stress to the industrial sector:
• Water delivery is not guaranteed, cut-offs, production stops • Not adequate freshwater quality, costly pre-treatment is required
Doc Name: Deliverable ID: WP 2.1 D2.1-2.pdf Date: 06/07/2006
Dissemination level: PU – Final Report 12
CemOA
: archive
ouverte
d'Irstea
Often water consuming industry plants have a bad reputation and regional population has a negative attitude towards industry and its impact on the water cycle, even if this position is not justified. Companies have often to invest a lot of money to be regarded as environmentally friendly and get the population’s acceptance.
Some economically less important industries have to cope with additional problems compared to big companies. The investments to save water and optimize their processes are often too expensive and the companies can not stay competitive.
1.3.4 Reasons for industrial water stress
In many Central and Eastern European countries poor industrial performance and old installations lead to pollution problems. Contaminated wastewaters can be released in an uncontrolled way and adequate treatment can often not be ensured. Inefficient water use and discharge of toxic substances into the environment are promoted by lack of transparency and strict regulations. The main challenge of industry is to make profits without abandoning high environmental standards and often compromises in benefits are required. (Jimenez-Beltran, 2005)
Water intensive and inefficient processes lead to high water abstraction for industry and limit other water users in their activities. Optimization of processes and efficient water management in a plant can lead to decreased water abstractions and saving water.
In some Southern European countries agriculture is the dominant economic sector and industrial activities have to be limited due to high water demand for agriculture. In drought periods water delivery for industry is not guaranteed and cut-offs and production stops are the result.
Due to the use of pesticides in the agriculture and other pollutants in the highly urbanized region ground- and surface waters are polluted and freshwater for industry does not reach required quality level. In this case costly pre-treatment of freshwater is needed and investments are made.
1.3.5 Strategies to cope with water stress within the industrial sector
Water stress in the industrial sector often promotes development of water saving processes and measures, as well as new wastewater treatment technologies for specific pollutants. Guidelines,supporting software tools and decision supporting systems for water and wastewater
management are elaborated to help companies in decreasing freshwater demand and contaminant loads in the wastewater. In the last decades in the European Union stricter regulations on wastewater discharge and industrial water management have been established. European legislation has established with the Directive on Integrated Pollution Prevention and Control (96/61/EC) a common set of rules for industrial processes to prevent and control pollution of the environment. In many cases the positive development can be observed. For example, organic matter discharge from the pulp and paper industry decreased in the last years as more mills now have secondary treatment of their effluents. In order to reduce heavy metal contaminations of surface waters control and reduction of point sources, modernization and construction of sewage treatment plants has taken place (EEA, 2003). Reference Documents on Best Available Techniques for different industrial sectors were developed by expert groups and best practices to prevent pollution are recommended. In the United States the Cleaner Production strategy is promoted.
In water scarce regions water intensive productions are avoided and certain shift of technologies and change of water use patterns is the result. In other processes water is recycled or alternative media to water are searched. The trend in industrial water use is therefore since many years already decreasing.
Charges for abstraction and effluent discharge promote companies to invest in water saving and
pollution prevention. Regulations to reduce pollution lead to reduction of water use as a means to reduce contaminant loads (EEA, 1999; EEA, 2001).
1.4 State of the art of water stress in the tourist sector
The Mediterranean is the main tourist destination in the world. Every year millions of people flock to the Mediterranean coasts, with the number likely to reach between 235 and 355 million people per year by 2025. Tourism activity peaks in summer, coinciding with the time when natural waterDoc Name: Deliverable ID: WP 2.1 D2.1-2.pdf Date: 06/07/2006
Dissemination level: PU – Final Report 13
CemOA
: archive
ouverte
d'Irstea
availability is at its lowest. Storing water in dams and extracting groundwater have, until now, been the solutions to satisfying the ever-increasing thirst for water by ever-increasing numbers of tourists. As a consequence, tourism is making a major contribution to the degradation and destruction of water ecosystems as rivers are being fragmented, groundwater levels are sinking and wetlands are drying out. Lower groundwater levels are not only causing habitats to disappear but are having a negative impact on human communities as the groundwater that is used for drinking water and irrigation is becoming saltier and requires treatment or the total abandonment of the resource.
Every tourist consumes between 300 and 850 litres of water per day. This rate could be reduced by 50%, a daily total of 273.000.000 cubic meters of water basically compensating for the forecasted increase in tourist numbers and associated water consumption by 2025. Hosting, entertaining and supplying the increasing number of tourists along the limited space of the Mediterranean coast will push urban boundaries further inland, most likely destroying in the process the few remaining coastal wetlands and lagoons.
Reducing water consumption and preventing encroachment into wetlands can only be achieved if the tourism industry, the government and individual tourists take concrete measures, such as installing water saving devices, reusing water, enacting water saving policies and adopting a land use plan that respects environmental considerations. Saving water does not have to incur additional costs but can be economically advantageous as hotels save on their water bills. In addition, protecting wetlands means maintaining one of the attractions that people come to see.
Below we give an overview of the current impact of tourism on freshwater resources and freshwater ecosystems and the underlying causes in the Mediterranean. Moreover, facts, data and examples are given for tourism and water consumption in AQUASTRESS-relevant countries.
1.4.1 Overview of impacts of tourism on freshwater sources
Over-exploitation of groundwater. According to Plan Bleu (1999)1, aquifer overexploitation is considerable in many Mediterranean countries: 13 % in Cyprus, 24 % in Malta (in 1990), 29 % in Gaza, 32 % in Israel (in 1994) and 20 % in Spain (25 % in the Júcar basin, 4 % in the Balearic Islands). Aquifer overexploitation was registered also in Egypt, Greece, Libya, Morocco, Turkey, and Tunisia (Plan Bleu, 2004, figure 1). Its main consequence is the decrease in the groundwater table, which negatively affects wetlands whose hydrological dynamics are directly linked to aquifers. Moreover, over-exploitation in coastal aquifers alters the equilibrium of the interface between freshwater and seawater in the groundwater body, which provokes saline water intrusion. Most Mediterranean coastal aquifers suffer from over-exploitation due to the concentration of agriculture and tourism in coastal areas.
Construction of new reservoirs or water transfer schemes. The growth of tourism is often
associated with the search for complementary water sources to satisfy the great demands on water for this economic sector. The combination of water needs for agriculture and tourism has lead to the construction of a significant number of dams. At present, in the Mediterranean basin there are at least 500 big dams, with a combined storage capacity of 230 km3. Countries having the most highly developed dam systems – the highest number of dams, with the highest total stored volume and having come closest to reaching the maximum number of dams the country can hold – are Cyprus, Spain, Italy, France and Egypt (Plan Bleu, 2004). Dams are certainly necessary for water supply, energy production and flood control, but they have negative effects on the environment and on people. The indiscriminate construction of dams is to be avoided. A recent study of the World Resources Institute, (WRI, 2004) highlights that dams alter the dynamics of rivers in terms of water flow regimes and transportation of sediments. Dams reduce the speed of the rivers’ flow and provoke
Doc Name: Deliverable ID: WP 2.1 D2.1-2.pdf Date: 06/07/2006
Dissemination level: PU – Final Report 14
1 The Blue Plan is a process of reflection on the Mediterranean as well as a non-profit organization who leads this process and a research center. The objective of Blue Plan is to promote the sustainable socio-economic development of the Mediterranean region by providing countries with data, studies and proposals for action on the relationships between populations, the environment and development.
CemOA
: archive
ouverte
d'Irstea
water stagnation, which decreases the capacity of the river to break down organic pollutants and therefore to combat water pollution. This leads to changes in the chemical and physical characteristics of rivers that adversely affect fish species, which also suffer from the alteration of their migratory patterns.
Another adverse effect of dams is related to altered water regimes in rivers. The artificial time and volume of water released by dams impacts on waterfalls, rapids and riverbanks and wetlands, which are essential feeding and breeding areas for many aquatic and terrestrial species. Dams hamper the movement of sediments to deltas, estuaries, flood forests, wetlands and lagoons, affecting the composition and productivity of species. Coastal fisheries depend on the rivers’ input of nutrients to ensure good fish productivity.
According to Plan Bleu (2004), the concentration of water use along Mediterranean coasts has also led to the construction of water transfer schemes to the Mediterranean coast in several countries (e.g. Egypt, France, Greece, Israel, Libya, Morocco, Spain). The main water infrastructure of the Spanish Hydrological Plan approved in 2001 (and recently revoked due to social pressure) was a 900 km-long transfer of 1050 hm3/year of water from the Northeast to the Southeast of Spain, where the tourist sector has grown 50% in the last five years (WWF, 2003), increasing its competing role for water with intensive agriculture.
Pollution of surface and groundwater. Insufficient, inefficient or non-existent wastewater treatment
systems have a direct negative impact on the quality of water and therefore on the ecosystems associated with them. According to a study of Ramsar2 sites (Frazier, 1999), pollution, water regulation, and urbanization and settlement impacts are among the five most frequently recorded change factors in Ramsar wetlands over the world. Of these, pollution is the most important one in Eastern and Western Europe. In Greece, for example, hotels located near the coast are often not connected to any sewage system. For this reason, local authorities require hotels to build their own treatment plants, usually designed as pre fabricated units. However, the lack of staff training and the seasonal aspect of wastewater production is causing operational problems, which reduce the effectiveness of treatment (EC, 2000).
Another source of water pollution is leakage from solid waste. In isolated areas or where the normal solid waste disposal system is not able to absorb peaks in waste production caused by the seasonal influx of tourists, the quality of freshwater can be affected by leakages from uncontrolled or inadequate disposal of solid waste. Although Plan Bleu (2004) highlights that it is difficult to give any overview of water pollution due to the high variety of causes and processes (point or diffuse pollution, accidents or chronic pollution) as well as of the variety of temporal and spatial effects of pollution processes, it is clear that the pollution of water has a negative impact both on natural ecosystems and on economic activities directly related to tourism. The pollution of ground or surface water makes it necessary to increase the treatment processes to produce drinkable water and, in some cases, makes it impossible to use water for human supply (e.g. for its high salinity). The contamination of rivers, lakes, wetlands and other aquatic ecosystems, causes the decrease or even the disappearance of many terrestrial and aquatic species, and also prevents local people and tourists enjoying bathing and other leisure activities. Finally, polluted rivers and lakes, together with direct discharges of poorly
2 The Ramsar Convention on Wetlands is an intergovernmental treaty, which provides the framework for national action and international cooperation for the conservation and wise use of wetlands and their resources. The Convention's member countries (Contracting Parties ) commit themselves to:
• Designating at least one wetland that meets the criteria for inclusion in the List of Wetlands of International
Importance (Ramsar List) and ensuring the maintenance of the ecological character of each of these Ramsar
Sites. Parties are encouraged to include in the List as many wetlands that meet the criteria as possible. Listed sites do not necessarily require protected area legal status, provided their ecological character is maintained through a wise use approach;
• Promoting the wise use of all wetlands within their territory through their national land-use planning, including wetland conservation and management;
• Promoting training in wetland research, management and wise use;
Doc Name: Deliverable ID: WP 2.1 D2.1-2.pdf Date: 06/07/2006
Dissemination level: PU – Final Report 15
• Consulting with other Parties about the implementation of the Convention, especially with regard to transfrontier wetlands, shared water systems, shared species, and development projects that may affect wetlands.
CemOA
: archive
ouverte
d'Irstea
treated or untreated wastewater also affect the quality of the seawater into which freshwater drains. EEA (2000) estimated that tourism contributes to 7% of all pollution in the Mediterranean Sea (industrial and urban wastes, including sewage, polluted rivers draining into the sea, crude oil dumped by all activities, detergents, mercury, phosphates, euthrophication). Health problems such as infections of the ear, nose and throat, hepatitis and dysentery can result from swimming in polluted seawaters.
Occupation of wetlands areas. Coastal areas often host unique ecosystems in deltas estuaries and
lagoons, where birds, fish and other aquatic and terrestrial species dwell and breed. More than 50% of the 25,000 plant species in the Mediterranean are endemic to the region (UNDP, 1999). Mediterranean wetlands are also critical areas for migratory birds: it is estimated that about 2 billion migratory birds of 150 species use the Mediterranean wetlands as seasonal sites or as a stopover before crossing the sea or the Sahara desert in their Africa-Palearctic flyway (UNDP, 1999). Over-development of the coast means that attention is directed increasingly towards Mediterranean wetlands for accommodation and recreational facilities. In the Moroccan region of Saïdia Ras El Ma, the planned construction of a tourist resort on the estuary of the Moulouya estuary might severely affect a very important resting site for migratory birds.
Tourism has contributed to a significant occupation of flat shorelines and beaches. Hotel infrastructure, at first concentrated near seaside towns and has proliferated everywhere on the coast. According to estimates, the urbanized coastal areas cover 140 km and tourist areas occupied by hotels and second homes cover 80 km. This adds up to a total of 220 km of artificial coastline (18 % of the total Tunisian coastline). With ongoing projects, about 150 km of the shoreline will be occupied by tourist activities (e.g. hotels, leisure installations, and holiday villas). Building tourist infrastructures too close to the shore and especially on the shore dunes is accelerating the process of beach erosion and the alteration of water dynamics that, for example in case of flash floods, causes significant damage. Hence, urbanized areas and other economic activities are moving to wetlands, especially in coastal areas. Wetland disappearance or degradation contributes to the decline of species that depend on them to survive: the number of water birds has decreased by 46% during the last 15-20 years and twenty globally threatened bird species live in the region (UNDP, 1999).
Degradation of sensitive wetlands. Tourism intensity contributes to the degradation of certain
sensitive wetlands near tourist hotspots. Recreation and tourism is listed as the second major use of Ramsar site wetlands both in Western Europe, Eastern Europe and in Africa (Frazier, 1999). This means that wetlands - especially the protected ones - are a tourist attraction and when their recreational use is not strictly regulated and monitored it can cause negative impacts on species dwelling in the area. Indeed, except for very specific and local cases (e.g. the degradation of small protected wetlands on the dunes of Doñana, Spain for the decrease of groundwater levels due to water supply for the tourist Matalascañas village), wetland degradation is due to a combination of causes (e.g. agriculture, tourist, industrial development). EEA (2003) reports a loss of habitats in transitional and coastal waters related to intense pressures due to “high human population densities”, without specifying how much was lost and due to what. A study on wetland loss by Wetlands International (1996) concludes that it is not possible to draw an overview at a regional level due to the diversity of methodologies used to measure wetland loss, and the lack of coordination between studies in different countries or for different wetland types. According to the same study, in Africa, the only quantitative information arises from the wetland inventory of Tunisia, which reports an overall loss of 15% of wetland area, and 84% loss in the Medjerdah catchment.
1.4.2 Causes
The main causes of the impacts on freshwater ecosystems described in the previous section are:
High water consumption due to population increase. Tourist areas suffer from significant
fluctuations in the number of local dwellers that have to be supplied with freshwater and consumption peaks normally occur in the dry season, when tourist demand overlaps with high water demand by agriculture. In the 1990s, it was estimated that nearly 135 million tourists (international and domestic) visit the Mediterranean coast every year, doubling the local population (EEA, 2000). In certain areas and at certain times of the year the population can increase two, three or even ten or more fold.
Doc Name: Deliverable ID: WP 2.1 D2.1-2.pdf Date: 06/07/2006
Dissemination level: PU – Final Report 16
CemOA
: archive
ouverte
d'Irstea
Higher consumption of water for associated facilities and leisure. Tourists require constant
access to water. A tourist staying in a hotel uses on average one third more water per day than a local inhabitant (EEA, 2000). Moreover, extensive landscaping, water parks, swimming pools and golf courses are typical tourist facilities that require water during the dry season. In Cyprus, where water resources are very limited, eight golf courses are under construction. On average, a golf course needs between 10,000 and 15,000 m3 of water per hectare and year (similar to the requirements of a rice pond!). The surface of a golf course lies between 50 and 150 hectares, which means that the annual consumption of a golf course is around 1 million cubic metres per year or the equivalent of the water consumption of a city of 12,000 inhabitants.
Peaks in wastewater volumes, inefficient or non-existent wastewater treatment facilities.
According to EEA (2000), tourists consume up to 300 litres and generate around 180 litres of wastewater per day. Indeed, the largest proportion of water is not consumed but used and disposed of as waste. The result is large volumes of sewage discharged to sewage treatment plants, or to the sea and rivers, because many tourist facilities are in isolated areas and are not connected to the water treatment network. In all cases, if water is not treated, recycled or disposed of properly, it will cause pollution.
Urban development associated with tourism. Tourism leads to urban development because it
needs facilities not only to host, feed and entertain tourists, but also to transport them, care for them (e.g. hospitals), treat their wastes etc. Moreover, economic growth is normally associated with growth of the local population that provides services to tourists. All these facilities occupy land and transform the landscape and the natural dynamics of wetlands located near tourist resorts. Accommodation (80% of all tourism and leisure construction) has a major impact on water resources, land use and ecosystems. The growth of the number of second homes during the 1990s created more intense pressures on land and the environment, especially in coastal and mountain zones.
Transport infrastructures associated with tourism. The tourist industry requires efficient facilities
to transport huge amounts of goods (food and all type of goods that can be sold to tourists) to tourist resorts and, of course, to bring tourists to their destination. The construction of transport infrastructures often negatively affects the water resources, as well as the environment as a whole.
1.4.3 Tourism activity and trends in water consumption
The Mediterranean is the world's leading holiday destination, accounting for 30% of international arrivals and 25 % of receipts from international tourism. Tourism activity along the Mediterranean coast has increased dramatically over the last decade. The number of tourists in Mediterranean countries is expected to reach between 440 and 655 million in 2025 (with 235 to 355 million on the coastal region), almost double the 1990 numbers (260 million, with 135 million on the coastal region). There has been and will be increased tourism activity in coastal areas where important wetlands are located (see above maps), as well as an expansion of tourism into wetland areas previously unvisited by tourists on a large scale. In southern western Europe (France Greece, Italy, Portugal and Spain) tourist arrivals increased by 91% between 1985 and 2000 (EEA, 2000). Over the last 40 years mass tourism has developed into an important source of income. At present, income through tourism accounts for about 1.2% of the total GDP in OECD countries (EEA, 1999) and, in countries with a strong tourist sector this share may rise to over 4% (Greece, Portugal, Spain).
In most countries there are no specific figures on water consumption by the tourist sector, which is normally included in the urban supply statistics. Even figures referring to urban supplies are estimates of consumption and not direct measurements and to get an overall picture of water consumption trends in tourism, we can only observe trends in water consumption for urban supply. According to Plan Bleu estimates (Plan Bleu, 2002; Plan Bleu, 2004) water demand for urban supply seems to be stabilizing in European Mediterranean countries, after a strong growth in the 1970s and 80s. It is expected that water demands will double in 20 years in Turkey, Syria, Libya, Algeria, Morocco. Growth has been slower and tending to stabilization in countries with a high water scarcity, like Israel, Cyprus and Malta (Plan Bleu, 2002). Where there is data on water consumption for tourism, a clear increase has been detected. In Tunisia water demand for tourism more than doubled between 1977 and 1996; the Balearic Islands (Spain) used 15 times more water between 1980 and 1995.
Doc Name: Deliverable ID: WP 2.1 D2.1-2.pdf Date: 06/07/2006
Dissemination level: PU – Final Report 17
CemOA
: archive
ouverte
d'Irstea
It is important to notice that tourism is not the main water consumer: water demand for human supply is 13% of the water demand in the Mediterranean, while for agriculture it is 63%. Although tourism exacerbates water supply problems by concentrating water demand in very short periods of time (Easter, Summer, Christmas, New Year) and in limited areas. Moreover, tourism has demanding standards in terms of quality and guarantee of supply. This means that facilities and water availability must be ensured with water infrastructures (reservoirs, water transfer schemes) that are “oversized” during most of the year. Moreover, A quite common trend in Mediterranean countries is the decrease of the share of water consumption by agriculture – which is still the main water consumer – and, in parallel, the increase of the percentage of water consumed by urban areas and tourism. Tourism demand in some cases can cause problems for the local population.
In general, Water Authorities answer water demands for economic sectors like tourism by applying a supply-oriented approach. This means that the Authorities work only on increasing water availability and, in this way, contribute to creating the false belief that water consumption can be endless. On the contrary, they should question (and increase) the efficiency of current water use and discuss the compatibility of economic growth based on the available water resources. This short–sighted approach has increased the pressure on conventional resources and has favored exploitation practices (groundwater over-exploitation, exploitation of non-renewable resources, construction of a high number of dams) that are unsustainable in the medium-long term because they are not able to ensure the present water supply levels. On the other hand there is an emerging trend to reuse water, which is particularly under development in Mediterranean countries where resources that are still available are becoming scarce.
1.4.4 Opportunities to reduce tourism water consumption and its
impacts on the environment
Applying existing technology to save water in Mediterranean hotels could bring about a significant reduction in water demand and could possibly accommodate a further increase in tourism without more dams being constructed. According to the EEA (2001) water saving devices can save up to 50% of water. Assuming a doubling of the number of tourists in the Mediterranean by 2025, a savings potential of 50 % would amount to a total of 273.000.000 cubic meters of water per year. Many effective water-saving devices (e.g. can be purchased at a reasonable price with some of the devices not requiring any structural modifications. Temporised taps, water-saving devices for traditional taps, water saver for toilets
The tourism industry should be directly concerned with the impact of its activities on freshwater because: 1. decreasing overall water use can lead to cost savings; 2. reducing water use can conserve and protect the local water resources upon, which a hotel and the local community depend; 3. preserving the quality of local water resources can reduce the need for costly drinking water treatment processes; 4. water conservation can enhance reputation among guests and others who are concerned about reducing water consumption and protecting local resources.
According to UNEP (2001), around the world there are some 70 ecolabelling and certification programmes offering logos or seals of approval. These programmes focus on sustainable tourism in general, and wise use of freshwater in particular. Green certification programmes involve a combination of stakeholders – industry, consumers, NGOs, host governments and local communities – and cover a variety of geographical areas. Europe alone has about 30 programmes for accommodation services. Today the most popular EMS certification programme is ISO 14001, which is being used, for example, by Green Globe, IHEI, Green Flag for Green Hotels in Europe, and a number of individual hotels and chains around the world. Due to the variety of certification systems, it is difficult enough to evaluate the effectiveness of certification in reducing the impact of tourism on the environment, let alone on freshwater ecosystems. In Europe the EEA (2001) reported that there was a five-fold increase between 1990 and 2001 in the use of ecolabels for accommodation, but there is no evaluation of this data.
Let us turn to government involvement in tourism development. Traditionally tourism development depends to a great extent on initiatives taken by the private sector (i.e. all companies operating in the
Doc Name: Deliverable ID: WP 2.1 D2.1-2.pdf Date: 06/07/2006
Dissemination level: PU – Final Report 18
CemOA
: archive
ouverte
d'Irstea
tourism sector), but now authorities – especially the local ones - are increasingly involved in developing and managing tourism activities. National authorities also have an important role to play in creating conditions for more sustainable development of domestic tourism. To reduce the negative impact of tourism on freshwater ecosystems, competent authorities should: 1. prepare overall strategies for tourist destinations based on dialogue with the private sector, local authorities and NGOs: a kind of ‘vision’ of what kind of future each tourist resort aims at; 2. participate in the enhancement and management of tourist destinations, balancing the interests of the environment with those of residents, tourists, operators; 3. generate partnerships between public and private actors to foster the achievement of environmental objectives, 6. promote the re-investment of part of the profits of tour operators in local development projects; 4. launch campaigns to inform the tourist communities (tourists and providers of services and goods to tourists) about the advantages of embarking on strategies and action plans for sustainable tourism, and support them in their efforts; 5. strengthen capacity building in local communities and encourage networking, particularly between communities in the same major tourist region; 6. strictly regulate tourist growth taking into account its impact on freshwater ecosystems; 7.protect wetlands and areas with an high ecological value from pollution and construction; 8. Increase the efficiency of the water distribution system; 9. apply water use and sewage charges according to water consumption and including not only the total costs of capital, operation and maintenance of water infrastructures, but also associated environmental cost of supply and wastewater treatment; 10. improve water treatment network and plants; 11. oblige isolated tourist resorts to treat their wastewater and control the effectiveness of wastewater treatment systems; 12. install water saving systems in new or renovated buildings; 13. strictly enforce rules and regulations related to tourism (land use planning, water use and treatment); if the risk of being found guilty is low or the penalties are small compared to the profits, there is little incentive to abide by rules.
1.5 State of the art of water stress in the environment
Two approaches exist to assess environmental impacts of anthropogenic stressors. One is to determine standard guidelines for relevant abiotic variables and compare measured levels of these variables to the guidelines. Examples are critical loads of nitrogen deposition (Bobbink et al., 2002), minimal flow values for rivers (Smakhtin et al., 2004) or maximal pesticide concentrations (). The other approach is to measure the response, i.e. ecosystem health or a related concept, directly. Both approaches have advantages and disadvantages, and may be used complimentary (Pennings et al., 2002). A good example of the latter are the current guidelines for the Water Framework Directive, where biological indicators (based on species indicating the condition of the aquatic ecosystem) and abiotic indicators (based on water quality, quantity and morphological alterations) are used simultaneously to compare an aquatic system to a reference situation, and thereby determine its condition, linking it to specific issues that have to be dealt with to improve this condition.
1.5.1 Critical levels, loads and resilience
The advantage of the approach of using a comparison to set standards is that pressures on ecosystems are unambiguously identified, and goals for remediation can be agreed upon on a broad scale. Disadvantages are that it is often difficult to link the effects of not meeting the standards to biological impacts, especially when different pressures are acting synergistically or the degree of vulnerability to a certain pollutant depends on other environmental factors (Pennings et al., 2002). Furthermore, the effects of pressures on ecosystems are typically not linear. Very different types of responses exist, with effects building up or decreasing over different time spans, or even only occurring over a long term period.
The most simple responses are direct toxicity effects, where a certain critical level or concentration of a pollutant causes a certain type and extent of damage to certain organisms. These types of effects may be found in response to e.g. pesticides in aquatic environments, and are relatively easy to quantify.
Doc Name: Deliverable ID: WP 2.1 D2.1-2.pdf Date: 06/07/2006
Dissemination level: PU – Final Report 19
Another type of standards are critical loads, as exist e.g. for atmospheric nitrogen deposition. The underlying assumption is that an ecosystem is able to absorb a certain amount of, in this example, nitrogen, without being affected in its ecological functioning. Loads higher than the threshold do not immediately lead to direct damage to certain organisms, but in time alter the competition between
CemOA
: archive
ouverte
d'Irstea
species in such a way that the ecosystem is drastically changed (e.g. Lamers, 2000). Even if this assumption is actually met, determining the thresholds requires experimental ecosystem manipulation, at low doses and over a long period.
Once the balance between functional processes is affected compared to a “pristine” state, the resilience of the ecosystem changes and most typically decreases. However, most often this is not directly “visible” in the most easily identified properties of the system and if the state of the ecosystem would be assessed, no effects would be found. Only when a threshold is crossed, or an additional pressure (“trigger”) is added, a cascade of effects, each occurring over different time scales, may then alter the ecosystem to a new stable state (for a more extensive discussion see Folke et al., 2004). The trigger for this series of events would have no consequences in the “pristine” system but causes a complete collapse in the system with eroded resilience.
1.5.2 Assessment of ecosystem condition, integrity or health
The ecosystem health approach has as an advantage that it is possible to identify the (integrated) impacts on natural systems and it allows the assessment of ecosystem condition without the need for detailed measurements of each potential stressor. A standard monitoring could then be used on a wide variety of sites to determine which ones need more intensive and expensive study. The disadvantage is that it is often not possible to identify the causes of the variation in health of different ecosystems, and thus further investigations are needed before a path for remediation can be decided upon. (Pennings et al., 2002) A further complication is that there is as yet not a simple way to measure ecosystem health, even assuming a general societal consensus on its concept (but see discussions in e.g. Karr, 1999; Fairweather, 1999; Boulton 1999). Most ecologists agree that a healthy ecosystem is as “natural” as possible, with a minimum of anthropogenic impacts. The problem is how to reveal and express departure from this natural state exceeding background variability, especially if no (data on) unmodified reference systems are available (Boulton, 1999). Though especially for aquatic systems a large effort is made to develop indicators and indicator systems, there is not one “holy grail” and most are situation specific. But always the data must be collected especially for the purpose “is this river healthy” (Boulton, 1999), which restricts severely the use of existing data and adds to the financial burden of already overstretched budgets.
Carignan & Villard (2002) reviewed the concept and selection of indicator species for assessment of ecosystem condition. They conclude that due to niche separation, no single species should be expected to act as an indicator for an entire ecosystem, with different taxa representing different sensitivities to different impacts in different situations. Furthermore, many factors unrelated to degradation of ecosystem condition may affect the presence and abundance of an indicator species, and thus complicate the interpretation of the results and linking to anthropogenic pressures. It is stressed that the selection of indicator species should be at least partially based on quantitative rather than qualitative criteria, to reflect on site ecological conditions rather than a perception of species importance. (Carignan & Villard, 2002) This requires good databases with reliable data collected on site, something which may not always be available. Other approaches include the focus on communities or guilds as indicators or indices of ecosystem condition. These indices are very useful at a coarse level, but may not be appropriate to detect changes at a finer scale or as early warning signs (Carignan & Villard, 2002). Alternatively, the measurement of ecological processes has been proposed as a measurement of ecosystem condition. Carignan and Villard (2002) conclude that no single perfect method exists for a complete assessment of the ecological integrity of any particular system, however, a solid framework has been developed which should at least give insight in whether ecosystem condition is increasing or decreasing. By monitoring indicators at other organizational levels at the same time, interpretation of indicator species response to environmental changes can be improved.
Doc Name: Deliverable ID: WP 2.1 D2.1-2.pdf Date: 06/07/2006
Dissemination level: PU – Final Report 20
CemOA
: archive
ouverte
d'Irstea
2. Major knowledge gaps to characterize water stress in
the different sectors
In 2005, WB1 and WB2 have made contributions which summarised the findings and assessments of recent research on water stress in the test sites3. Its aim was to heighten awareness of water stress as an issue for the test sites. Although there are still many gaps in our understanding of water stress, and of its likely impacts on the agriculture, domestic, industrial sector and the environment during the last reporting period there has been a considerable investment in research as a whole. The results of further research since then have also added to our increased understanding of the issues and likely impacts on the sectors. Large amounts of useful information have been gathered on the test-sites on the water situation in general but still main significant gaps in the knowledge base are there, much of the relevant knowledge for the characterisation on water stress that does exist is not widely shared, easily accessible nor well managed.
Especially in the following sections major knowledge gaps to characterise water stress will be figured out. Based on the work done by WB2 the sectors have been defined as:
• Domestic sector
• Agricultural sector
• Industrial sector (including the tourism as service sector) • Environment
It is difficult as well to get records on the accuracy of data, timescales and adaptations of institutions. However, it should be emphasised that the confidence around the whole issue of adaptations and timescales is limited by knowledge gaps and the effects of other drivers of change.
2.1 General comments on gaps
2.1.1 In regard to water availability
The evaluation of the water availability in a site requires adequate data to fully describe water resources. It is well known that poor records are a major obstacle in proper water management. Moreover archives of hydrological data are not always easily accessible and many localised but still important sites (e.g. areas of intensive exploitation) are not monitored at all.
The conceptual model described above doesn’t always fit to all situations depending on the quantity and quality and the spatial scale of the available data, and that’s often the case independently of the scale. However it is usually easier to establish an acceptable balance for an entire river basin than for a smaller part of it, due to the existence of measuring devices at the closure of the main rivers in Europe.
Some of the AquaStress test site are lacking of sufficient data for this type of assessment, and other strategies for the evaluation should be foreseen.
In other cases data are available and many previous studies have been undertaken in order to establish the water budget in view of a sustainable management. Hence a preliminary assessment could be undertaken.
2.1.2 In regard to seasonal variation
In many climatic conditions but especially in the Mediterranean area, spring and river discharge can vary consistently from the dry season to the wet season. In all cases where the seasonal variation is not negligible the minimal availability should be considered, and compared to the demand in the same
Doc Name: Deliverable ID: WP 2.1 D2.1-2.pdf Date: 06/07/2006
Dissemination level: PU – Final Report 21
3 See D1.1.1 and D2.1.1. CemOA : archive ouverte d'Irstea / Cemagref