HAL Id: hal-02484406
https://hal.archives-ouvertes.fr/hal-02484406
Submitted on 19 Feb 2020
HAL is a multi-disciplinary open access
archive for the deposit and dissemination of
sci-entific research documents, whether they are
pub-lished or not. The documents may come from
teaching and research institutions in France or
abroad, or from public or private research centers.
L’archive ouverte pluridisciplinaire HAL, est
destinée au dépôt et à la diffusion de documents
scientifiques de niveau recherche, publiés ou non,
émanant des établissements d’enseignement et de
recherche français ou étrangers, des laboratoires
publics ou privés.
expressions: an experimental study using random forest
classifiers
Charline Grossard, Arnaud Dapogny, David Cohen, Sacha Bernheim, Estelle
Juillet, Fanny Hamel, Stephanie Hun, Jérémy Bourgeois, Hugues Pellerin,
Sylvie Serret, et al.
To cite this version:
Charline Grossard, Arnaud Dapogny, David Cohen, Sacha Bernheim, Estelle Juillet, et al.. Children
with autism spectrum disorder produce more ambiguous and less socially meaningful facial expressions:
an experimental study using random forest classifiers. Molecular Autism, BioMed Central, 2020, 11,
pp.5. �10.1186/s13229-020-0312-2�. �hal-02484406�
R E S E A R C H
Open Access
Children with autism spectrum disorder
produce more ambiguous and less socially
meaningful facial expressions: an
experimental study using random forest
classifiers
Charline Grossard
1,2*, Arnaud Dapogny
2, David Cohen
1,2, Sacha Bernheim
2, Estelle Juillet
1, Fanny Hamel
1,
Stéphanie Hun
3, Jérémy Bourgeois
3, Hugues Pellerin
1, Sylvie Serret
3, Kevin Bailly
2†and Laurence Chaby
1,2,4†Abstract
Background: Computer vision combined with human annotation could offer a novel method for exploring facial expression (FE) dynamics in children with autism spectrum disorder (ASD).
Methods: We recruited 157 children with typical development (TD) and 36 children with ASD in Paris and Nice to perform two experimental tasks to produce FEs with emotional valence. FEs were explored by judging ratings and by random forest (RF) classifiers. To do so, we located a set of 49 facial landmarks in the task videos, we generated a set of geometric and appearance features and we used RF classifiers to explore how children with ASD differed from TD children when producing FEs.
Results: Using multivariate models including other factors known to predict FEs (age, gender, intellectual quotient, emotion subtype, cultural background), ratings from expert raters showed that children with ASD had more difficulty producing FEs than TD children. In addition, when we explored how RF classifiers performed, we found that classification tasks, except for those for sadness, were highly accurate and that RF classifiers needed more facial landmarks to achieve the best classification for children with ASD. Confusion matrices showed that when RF classifiers were tested in children with ASD, anger was often confounded with happiness.
Limitations: The sample size of the group of children with ASD was lower than that of the group of TD children. By using several control calculations, we tried to compensate for this limitation.
Conclusion: Children with ASD have more difficulty producing socially meaningful FEs. The computer vision methods we used to explore FE dynamics also highlight that the production of FEs in children with ASD carries more ambiguity.
Keywords: Autism spectrum disorder, Facial expressions, Emotion, Algorithm
© The Author(s). 2020 Open Access This article is distributed under the terms of the Creative Commons Attribution 4.0 International License (http://creativecommons.org/licenses/by/4.0/), which permits unrestricted use, distribution, and reproduction in any medium, provided you give appropriate credit to the original author(s) and the source, provide a link to the Creative Commons license, and indicate if changes were made. The Creative Commons Public Domain Dedication waiver (http://creativecommons.org/publicdomain/zero/1.0/) applies to the data made available in this article, unless otherwise stated.
* Correspondence:charline.grossard@aphp.fr
†Kevin Bailly and Laurence Chaby contributed equally to this work. 1
Service de Psychiatrie de l’Enfant et de l’Adolescent, GH Pitié-Salpêtrière Charles Foix, APHP.6, Paris, France
2Institut des Systèmes Intelligents et de Robotique, Sorbonne Université, ISIR
CNRS UMR 7222, Paris, France
Introduction
The understanding of our facial expressions (FEs) by others is crucial for social interaction. During typical de-velopment (TD), most facial components of the human expression repertoire can be observed shortly after birth (e.g. smile), even if FEs in infancy are not the same as their adult counterparts [1, 2]. First, emotion in infancy cannot be compared to emotion in adulthood because emotions at these stages do not involve the same degree of cognitive/emotional complexity [3]. Second, facial motricity is not similar between infants and adults [4]. Fully adult-like FE physiognomies appear progressively, and the learning of FEs increases even in late childhood: the ability to produce FE continuously improves between 5 and 13 years of age and 13-year-old adolescents do not yet produce all FEs perfectly [5, 6]. Their production is influenced by several factors: (1) emotional valence (e.g. positive emotions are easier to produce than negative emotions) [6–8]; (2) gender, as girls tend to produce positive emotions more easily than boys, and boys tend to produce anger more easily than girls [9]; (3) the type of task, as this factor modulates the quality of FEs in children (e.g. children are better with request tasks than with imitation tasks) [6]; and (4) ethnic and cultural fac-tors (e.g. cross-cultural studies indicate that the intensity of spontaneous expression is not universal and may vary across cultures) [10, 11]. Similarly, in a previous study [6], we found that children from the south of France (Nice) were more expressive than children from the north (Paris).
Autism spectrum disorder (ASD) is a neurodevelop-mental disorder characterized by repetitive behaviours and impairments in social interaction, including deficits in social expression that is crucial for communicating one’s internal state to others and that can impact social integration [12, 13]. A recent meta-analysis found that participants with ASD were less expressive and that their FEs were incongruous with the social context [14]. The inadequacies observed in various studies seem to be re-lated to the way FEs are conceptualized (e.g. visual ap-pearance, intensity or reciprocity in social contexts); operationalized, in terms of the tasks best able to elicit them (e.g. spontaneous vs. posed facial expression); and measured (rating by observers, automatic analysis using electromyographic recording or FE analysis software based on the Facial Action Coding System).
When the deficits are explored in terms of the number of spontaneous FEs produced during videotaped child-experimenter interactions, children with ASD, children with intellectual disability and matched TD children do not differ in the quantity of positive FEs produced. How-ever, children with ASD produce more negative FEs than the two other groups [15]. When FEs are rated by neu-rotypical observers with a dimensional approach using
Likert scales, no difference is found in FE intensity be-tween children with ASD and TD children [16]. How-ever, the results differ when other types of tasks are performed, such as more naturalistic tasks (i.e. spontan-eous expressions evoked in social contexts) during which children with ASD may be judged to be more expressive [17, 18], even if these results are not consistent [19]. However, in most studies, it appears that children with ASD produce more ‘bizarre’ or ‘mechanical’ posed ex-pressions [20], ambiguous FEs in child-experimenter set-tings [15] and ‘awkward’ FEs during emotional storytelling [16]. Atypical FEs in autism do not arise from a specific way of producing FEs but appear to be idiosyncratic: individuals with ASD and TD individuals have the same difficulty in recognizing FEs produced by individuals with ASD and are better able to recognize FEs produced by TD individuals [21]. Moreover, individ-uals with ASD are less able to recognize anger produced by individuals with ASD than TD individuals [21]. Add-itionally, individuals with ASD do not share common representations for FEs [21].
Among the factors that could influence FE production in individuals with ASD, emotional valence is key. Posi-tive FEs are easier to produce than negaPosi-tive FEs [22,23]. Sadness is the most difficult to produce in children with ASD [19], but not in adults with ASD [21,23]. This dif-ference between studies could be explained by differ-ences in the methodology used, as the type of task also influences FE production in ASD [20,21,23]. The effect of gender on FEs in ASD has only been investigated in adulthood. It seems that males with ASD more accur-ately produce FEs than females, although FEs of females were rated as being more natural than those of males [23]. The social context may also modulate FEs, al-though the results are not consistent (see [24] for a re-view). In the Trevisan meta-analysis [14], spontaneous and posed FEs were both produced better by typical par-ticipants. Additionally, the accuracy of FE production seems to increase with age and intellectual quotient (IQ) in individuals with ASD [14]. We found no studies about the potential effect of ethnicity or cultural environment on FEs in individuals with ASD.
The development of affective computing and, more specifically, FE analysis from videos allows the automa-tion of FE recogniautoma-tion in neurotypical adults, even with variability in lighting conditions or subject morphology, as well as the understanding of FE dynamics (e.g. [25]). In children with ASD, the first attempts to use computer vision tried to model specific characteristics of FE dy-namics. Samad [26] found a significant asymmetry in the activation of specific pairs of facial muscles in adults with ASD compared to those of TD controls. This asym-metry is presented as a potential explanation for the im-pression of oddity in FEs produced by adults with ASD.
The groups of Grossman and Narayanan showed that children with ASD had less synchrony of motion be-tween facial regions and a higher level of variability [27] and that they displayed less complex facial dynamics (assessed by multiple scale entropy), specifically in the eye region [28]. In their last study, they also showed that distance features were less predictive of the emotional valence for FEs in ASD than in typical participants [29]. Combining recorded videos of the Autism Diagnosis Observation Schedule (ADOS) and commercially avail-able software, Owada et al. [30] found that individuals with ASD produce significantly fewer variations of neu-tral and joyous FEs than TD individuals. However, these promising preliminary studies had several limitations: limited sample size, only high-functioning adult males with ASD, no assessment of possible factors that could influence children’s productions (e.g. age, type of task, social context) and no use of machine learning algo-rithms due to the lack of access to a large database of children’s FEs.
There are multiple rationales for using machine learn-ing algorithms for analyslearn-ing facial expressions: (1) to ob-tain deep insights into what kind of features are relevant when children are producing a given facial emotion due to the investigation of the most relevant features that have been selected by the algorithm, (2) to explore large video datasets of children and (3) to highlight objective differences between ASD and TD children productions based on the capture of relevant features (e.g. distance between facial landmarks [29]). In comparison, motion capture allows a higher temporal resolution and can cap-ture micro-expressions but brings only geometric infor-mation. In addition, motion capture is more invasive as it requires the use of specific sensors on the child’s face.
We only found one study showing the potential value of an FE recognition pipeline [31]. This study proposed a computational approach combining the exploration of FEs in unconstrained conditions, the estimation of ac-tion unit intensities by analysing local appearance and the use of machine learning classifiers. The outputs were compared with evaluations performed by expert raters on a group of 17 children with ASD. The results showed how this computational assessment of FE dynamics helped go beyond the traditional qualitative rating, which may be affected by human limitations, for observ-ing subtle multi-cue behaviours [31]. However, this study also had limitations: small sample size of children with ASD and the use of an adult database to train the classifiers despite the well-known differences between adults’ and children’s FEs [3].
The use of automatic FE analysis to characterize FE production in ASD appeared promising. However, many questions remain regarding FE production in children with ASD, as most studies have been conducted in
adult/mixed populations. Additionally, the development of FE production in children with ASD is not well understood, nor are the factors that could influence this process [14]. Our work pursues two aims:
(1) Investigating FE production in children with ASD who are 6 to 12 years old, comparing their production to that of TD children, taking into account different factors that could influence FEs [6]. Based on previous research, we hypothesized that FE quality would increase with age and with IQ, that positive emotions would be easier to produce than negative emotions, that the type of task would influence the children’s production, that the FEs of children from Nice would be rated with more accur-acy than the FEs of children from Paris, that gender would influence the children’s productions, that TD chil-dren would produce more accurate FEs than chilchil-dren with ASD and that children with ASD would be helped by the presence of a model.
(2) Exploring, with random forest (RF) classifiers, how children with ASD differ from TD children during FE production. In other words, the RF classifiers behave as automated expert raters, offering the opportunity to ex-plore how they reach their classification. We extract geo-metric and appearance features because they are complementarity and are often used in the automatic fa-cial expression recognition domain [32]. Geometric fea-tures characterize facial landmark displacement (e.g. a smile), while appearance features can encode informa-tion such as the occurrence of wrinkles. We hypothe-sized that (1) the RF classifiers would reach a better accuracy with typical children than with ASD children and that (2) children with ASD would specifically use their mouths to produce FEs as a difference between the interest in the mouth and the eyes during emotional rec-ognition has previously been shown [33].
Methods Participants
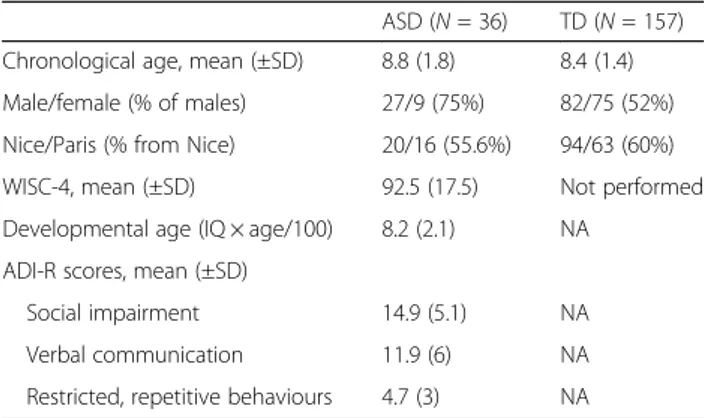
We enrolled 157 TD children between the ages of 6 and 11 years old (Nboys = 52%). All TD children were re-cruited in two schools, one in Paris and one in Nice. All participants were native French children, and the same numbers of children were recruited by grade. We also recruited 36 children between the ages of 6 and 12 years old (Nboys= 75%) with a diagnosis of ASD as confirmed by at least one validated method (ADOS and/or Autism Diagnosis Interview-Revised, ADI-R). The children were recruited from two hospitals in France, one in Nice (N = 20) and one in Paris (N = 16). The participants’ clinical characteristics are summarized in Table1. Before inclu-sion, written consent was obtained from parents and children after they were given proper information. The researchers met with each child alone for approximately 40 min to complete the protocol. The study was
approved by the ethical committee of Nice University (Comité de Protection des Personnes Sud Méditerranée) under the number 15-HPNCL-02.
Tasks
The protocol is available in detail in Grossard et al. [6]. It consists of two tasks of FE production, one entailing a verbal request without a model (the on request task) and one entailing the imitation of an avatar (the imitation task). In each task, the child must produce FEs only (vis-ual modality) or both facial and vocal expressions (audio-visual modality). The order of the two tasks was counterbalanced across each modality, resulting in four orders of presentation for the tasks. Children had to
produce four FEs: joy, anger, sadness and neutral expressions.
In the imitation task, the child must imitate the facial productions (visual modality) and the facial and vocal productions (audio-visual modality) of an avatar pre-sented on the screen in short 3–4-s videos (Fig.1a). The audio-visual condition combines FEs with emotional noises (such as crying for sadness, rage for anger or pleasure for joy and a sound held for neutral emotion). These sounds were extracted from an audio dataset vali-dated in adults [34]. The following instructions were given:
– [Visual modality]: ‘You will see an animated face on the screen. It will produce an emotion with its face, such as joy, for example. You will have to do the same thing with your face.’
– [Audio-visual modality]: ‘You will see an animated face on the screen. It will produce an emotion with its face and his voice, such as joy, for example. You will have to do the same thing with your face and your voice.’
We used one male and one female avatar for this task. The avatars and the FEs were presented in a random order. Each avatar produced one of the four FEs in both modalities (visual and audio-visual), allowing us to col-lect 16 videos per child.
Table 1 Main characteristics of the participants
ASD (N = 36) TD (N = 157) Chronological age, mean (±SD) 8.8 (1.8) 8.4 (1.4) Male/female (% of males) 27/9 (75%) 82/75 (52%) Nice/Paris (% from Nice) 20/16 (55.6%) 94/63 (60%) WISC-4, mean (±SD) 92.5 (17.5) Not performed Developmental age (IQ × age/100) 8.2 (2.1) NA
ADI-R scores, mean (±SD)
Social impairment 14.9 (5.1) NA Verbal communication 11.9 (6) NA Restricted, repetitive behaviours 4.7 (3) NA
Fig. 1 Framework of the computer vision method to explore FEs in TD children and children with ASD: experiment to induce FEs (a) and FE recognition pipeline (b)
In the‘on request’ task, the child had to produce a fa-cial expression (visual modality) or a fafa-cial and vocal ex-pression (audio-visual modality) upon request. The name of the emotion was displayed on the computer screen and was read by the clinician. The following in-structions were given: ‘I will tell you a word that ex-presses an emotion when we feel something: - [visual modality]: Could you show with your face what you do when you feel sadness / joy / anger / nothing?
- [audio-visual modality]: Could you show with your face and your voice what you do when you feel sadness / joy / anger / nothing?’
The order of the presentation of emotions within this task was also random. We presented the four FEs in both modalities (visual and audio-visual). In total, 24 (3 × 8) videos per child were collected during the entire protocol.
We first met all TD children in their school and stud-ied the factors that influence their productions [6]. The following year, after developing the FE recognition algo-rithm (see below), we then met all the ASD children at hospitals.
Judge ratings
To analyse the FEs produced by the children, all videos recorded needed to be annotated. Few studies attempt to rate the quality of emotions, and the optimal methods have not been agreed upon. In children’s studies, Egger et al. [35] asked judges how well the emotion was por-trayed. Mazurski and Bond [36] looked at the certainty of the judge that the emotion he recognized was the good one. In adult studies, such as the GEMEP (Geneva Multimodal Emotion Portrayal) [37], judges had to rate the authenticity and the plausibility of each FE. For our purpose, we used a Likert scale combining two dimen-sions: recognisability and credibility, where we assumed that (1) an emotion can be recognized but not credible, but that (2) the opposite (credibility without recognizing the emotion) is not possible [6]. The credibility can be defined as‘how much do you think that the children ef-fectively feel this emotion.’ The scale allowed us to judge the presence of a given emotion on a 10-point gradient (0 = no recognition, 5 = recognition is maximal without credibility and 10 = both recognition and credibility are maximal). The score represents the quality of the FE. For each video, the judges had to complete four scales (one for each emotion: happiness, sadness, anger and neutral). This method allowed the judge to annotate one to four emotions for a given FE watched on a video. In-deed, a perfect production of happiness would be rated 10 on the scale for happiness and 0 on the three other scales. However, for a less-specific expression (such as when children laugh when trying to produce anger), the judges would annotate multiple emotions for a unique
expression (such as anger 5 and joy 5). This method allowed us to annotate ambiguous FEs. We asked three judges to annotate each video of each child with ASD. They could look at the video as many times as they wanted and were also asked to indicate the beginning and the end of the FE. For videos recorded in the audio-visual modality, judges rated videos with both images and audio. The judges were French Caucasian adults (5 women) aged 22, 23, 25, 25 and 34 years. Two were stu-dents in speech therapy, two were speech therapists and one was a developmental psychologist. They were all part of the team and knew about the purpose of this re-search and the diagnosis. The videos were rated on the same special tool created for our preceding study on typ-ical children FEs. Inter-rater agreement on 240 videos from 10 TD children (one girl and one boy for each age) was assessed using intraclass correlation coefficients. We found excellent agreement between the judges (ICC happi-ness = 0.93, ICCanger = 0.92, ICCsadness = 0.93, ICCneutral = 0.93) [6]. We also calculated the ICCs on 329 videos of children with ASD (corresponding to 20 children) and found very good agreement between the judges (but less than for the TD children) (ICChappiness= 0.82, ICCanger= 0.82, ICCsadness = 0.79, ICCneutral = 0.79). These differ-ences support the idea that FEs produced by children with ASD are harder to classify. To enhance automatic learning, we kept only videos rated above 7 for the tar-geted emotion (see below).
Statistical analysis of judge ratings
All statistics were performed using R. To analyse judge ratings for FEs, we performed generalized linear mixed models (GLMM) without interaction to assess the effect of different variables on the score obtained on our FE quality scale. The independent variables were age, gen-der, IQ, order of presentation of the tasks (four different orders), modality (visual vs. audio-visual), emotion sub-type (anger, joy, sadness or neutral expression), centre (Nice vs. Paris), and group (ASD vs. TD). We used a sec-ond model to explore the interaction between group and emotion subtypes because the results are contradictory in the literature (see the‘Introduction’ section).
Pre-processing for the extraction of FE features
For each video, we applied an OpenCV Viola & Jones face detector [38] on the first frame, which had been converted to greyscale levels beforehand. Then, we ap-plied the interface facial landmark tracker to locate a set of 49 landmarks on the face [39]. Facial landmarks cor-respond to semantic points localized on the face such as the mouth and eye corners and nose tip. These land-marks encode geometric deformations of the face. Next, we tracked those landmarks in the remaining frames of the video. Because the end of each video usually
depicted the apex of the emotion, we selected the last frame of each video to train and test the facial expres-sion recognition models. We rejected some videos for which the feature point tracker could not follow the head motion. We extracted a total of 3781 images for the TD children and 814 for children with ASD. For FE classification, we only used the examples whose quality was rated higher than 7 out of 10, resulting in a total of 1845 images for the TD group (corresponding to 48.8% of the videos recorded) and 332 for the group of chil-dren with ASD (corresponding to 40.8% of the videos re-corded). No child was excluded during this step with 2 videos minimum to 23 videos maximum per child. This variation between children was the same in children with ASD as TD children. Finally, for better computa-tion, all images were rescaled to a constant size of 256 × 256 pixels.
Automatic annotation of FEs using computer vision machine learning
A traditional FE recognition pipeline consists of two dif-ferent parts: feature extraction and classification (Fig.1b). During the feature extraction step, we used the extracted facial landmarks to generate a set of features that could usually be distinguished as one of two types: geomet-ric ones and appearance ones. We extracted 1617 fea-tures, including 1176 geometric features and 441 appearance features. For the geometric features, we decided to compute the distances between each land-mark position and normalize those distances by the inter-ocular distance (IOD) for in-plane rotation and scale invariance. For appearance features, we used a histogram of oriented gradients (HOG), a feature de-scriptor that is known for its descriptive power and robustness towards illumination changes [31]. We computed horizontal and vertical gradients for a win-dow of 20% of the IOD around each facial landmark. Then, those gradients were used to generate 9 feature maps per feature point, the first containing the gradi-ent magnitude, and the remaining 8 corresponding to an 8-bin quantization of the gradient orientation [40].
Next, the classification task was performed. Random forest (RF) classifiers are a popular learning framework introduced by Breiman [41]. This framework has been used often in computer vision because it handles very high-dimensional data (such as images) and can be easily parallelized for fast training and evaluation. We used the scikit-learn implementation of the RF classifier con-structed with 500 trees, a maximum depth of 16, Gini entropy for the impurity criterion, a maximum of 220 features for each split node and a minimum of 40 exam-ples to split a node. We also used class weight balancing because of the highly skewed label distribution, as shown in Table2.
We used a 10-fold subject independent cross-validation to assess the performance of our RF classifiers in the clas-sification task in three different cases: (a) learning from TD children and testing on TD children, (b) learning from children with ASD and testing on children with ASD, and (c) learning from TD children and testing on children with ASD. Because we wanted to show that the differences in performance between (a) and (c) do not depend on the statistical repartition (number, age, city, gender) of the children, we also managed to find two subgroups of TD children, namely, TD group 1 and TD group 2, whose statistical repartition was almost identical to that of the ASD group in terms of age, gender, city of recruitment and number of videos for each targeted emotion (see Add-itional file 1). Thus, we were able to train two more RF classifiers for which the training was performed with the complementary TD group of TD group 1 and was tested on TD group 1 and the ASD group; the same thing was done for TD group 2.
Finally, although the automatic learning was based on vision computing, we also investigated whether the dur-ation of the FE could differ from one emotion to another and between TD children and children with ASD (see Additional file1).
Results
Rating of FEs by human judges
Overall, children with ASD were able to perform the tasks with some success. Figure2a and b show how chil-dren with ASD and TD chilchil-dren performed the tasks (a for imitation; b for on request) according to age and emotion subtype.
As explained in the statistics section, we performed a multivariate analysis to assess possible group differ-ences in the scores obtained on our FE quality rating scale, taking into account other explicative variables such as age, gender, order of task presentation, mo-dality, emotion subtype and centre location (Nice vs. Paris). The GLMM formula was the following: score ~ age + gender + order + task + modality + emotion subtype + centre location + group + (1|child num-ber). Table 3 summarizes the GLMM statistics. Chil-dren with ASD had more difficulty producing FEs with an emotional valence than TD children. Better emotion production scores were obtained during the
Table 2 Distribution of emotion subtypes according to groups (TD vs. ASD) Expression TD (%) ASD (%) Neutral N = 677 (36.5%) N = 125 (37.7%) Happiness N = 525 (28.5%) N = 101 (30.4%) Anger N = 397 (21.5%) N = 58 (17.5%) Sadness N = 246 (13.5%) N = 45 (14.4%)
‘on request task’ than during the ‘imitation task’. Emotion production scores were higher in the children recruited in Nice, and positive expressions were easier to produce than for negative expressions. Within negative emotions, anger was easier to produce than sadness. The neutral expres-sion was the easiest FE to produce. Finally, older children tended to be better at producing FEs (p = 0.084). To ex-plore why age did not reach statistical significance, we not only explored the same model for ASD children but also included the IQ variable. The model was grossly the same, but IQ was significant (see Additional file1: Table S2).
Since the most difficult emotion to produce ap-peared to be sadness, we calculated the model ad-justed odd ratios with sadness as the referential emotion. The FE rating significantly increased by a factor of 2.36 for anger, 4.27 for happiness and 5.11 for neutral compared to that for sadness. The FE score significantly increased by a factor of 1.71 for the on request task compared to that of the imitation task. The FE score significantly decreased by a factor of 0.73 for children from Paris compared to that for children from Nice. Finally, the FE rating score for
Fig. 2 Boxplots: the solid line represents the median of the distribution; the outlines of the box represent the interquartile range, or 25th–75th percentiles; the whiskers represent the upper and lower quartiles, excluding outliers; and the diamonds represent the mean
TD children increased by a factor of 1.44 compared to that for children with ASD.
To assess whether the duration of videos could be a confounder, we detail the duration data of the re-corded videos in Additional file 1: Table S3. As shown, durations were significantly different from one emotion to another (anger≈joy < neutral≈sadness) and between tasks (avatar imitation < on request), groups (ASD < TD) and modalities (multimodal < unimodal). No single pattern emerged: the best-rated emotion (joy) was the second shortest, whereas videos of TD children (who were better rated) lasted longer than videos of children with ASD. In addition, the rele-vance of video duration (mean = 92.03 ± 37.38 ms) may be questionable, as shown in the distribution. None of the significant differences in video durations were above 1 SD (Additional file 1: Figure S1). Fi-nally, when we added video duration into the GLMM, we found that shorter videos tended to be better rated than longer videos, but this effect was not sig-nificant (p = 0.082). The odds ratio corresponding to an increase in the duration of a video by 37 ms (cor-responding to one standard deviation) was equal to 0.88. This effect was adjusted for the emotion type.
Finally, we tested the interaction between the variables – group and emotion subtypes. The GLMM formula was the following: score ~ age + gender + order + task + modality + emotion subtype + centre location + group + group × emotion subtype + (1|child number). However,
we found no significant interaction between these two variables (Table4).
Rating FEs with a computer vision algorithm
Table 5 summarizes the recognition accuracies of our RF classifiers according to groups and emotion subtypes. For the three presented combinations of training and testing, the trained models output better accuracies when training and testing were performed on TD chil-dren. Additionally, the trained models output better ac-curacies for neutral and happiness classes and worse accuracy for sadness. Indeed, sadness is the more subtle FE, and the behavioural results yielded the same results (see Table 3). However, the low number of examples could explain why the RF classifiers did not efficiently capture the variability in describing sadness FEs. When training and testing were performed on ASD children, the model had poorer performance. If the algorithm did not perform similarly for TD and ASD individuals, it is because FEs produced by children with ASD are more ambiguous than those of TD children. It is important to note that the TD database outsizes the sample of ASD individuals. Therefore, the algorithm trained on ASD faces has fewer examples to train with, which could ex-plain why generalization is more difficult. However, when training was performed on TD children and test-ing was performed on children with ASD, the model did not generalize well and had similar results to the model that trained and tested on children with ASD. A notable
Table 3 Emotion production in TD children and children with ASD as a function of age, gender, group, order, modality, elicitation task, emotion and test site: results from the GLMM model
Variable ß estimate Standard error p
Age 0.06 0.037 0.084
Gender (boys vs. girls) − 0.004 0.11 0.97
Order 2 vs. order 1 − 0.07 0.15 0.64
Order 3 vs. order 1 − 0.09 0.15 0.56
Order 4 vs. order 1 − 0.05 0.15 0.76
Modality (visual vs. audio-visual) 0.11 0.07 0.12 Elicitation task (on request vs. imitation) 0.54 0.07 < 0.001 Emotion (happiness vs. sadness) 1.45 0.1 < 0.001 Emotion (neutral vs. sadness) 1.63 0.1 < 0.001
Emotion (anger vs. sadness) 0.86 0.09 < 0.001
Site (Paris vs. Nice) − 0.32 0.12 0.009
Group (typical children vs. ASD) 0.363 0.124 0.004
Table 4 Interaction model between group and emotion with sadness as the referential emotion modality
Variable ß estimate Standard error p
Emotion (happiness) × group (ASD vs. typical children) − 0.062 0.249 0.803 Emotion (neutral) × group (ASD vs. typical children) 0.309 0.248 0.212 Emotion (anger) × group (ASD vs typical children) 0.284 0.300 0.216
exception is happiness (grey cells in Table5). Happiness was recognized better in children with ASD when the model was trained on TD children than on children with ASD, thus suggesting that happiness is produced by TD children and by children with ASD in a similar way.
To control for the possible contribution of gender, age and city origin in the group differences, we selected two subgroups of TD children (TD group 1 and TD group 2) with a similar distribution of gender, age, city and pro-portion of available videos as children with ASD for each emotion (see Additional file 1: Table S1). In the next analysis, the RF was trained on the TD children who were not in TD group 1 or TD group 2 and was tested on the ASD group, TD group 1 or TD group 2. Add-itional file 1: Table S4 shows that the results of training on TD children and testing on TD group 1 or TD group 2, as well as training on TD children and testing on ASD children, are similar to the one presented previously. Thus, the statistical repartition does not seem to affect the results of the RF classification.
To ensure that those differences were not caused by the differences in the sample sizes, we trained two ran-dom forests with a 10-fold cross-validation on only TD group 1 and TD group 2. The results are shown in Add-itional file 1: Table S5. The changes in the sub-dataset sizes only affected the performance of sadness accuracy. This emphasizes the fact that poorer learning and testing performance on ASD is not caused by a lack of data and that the comparison between the importance of each landmark is relevant.
Exploring FE dynamics with a computer vision algorithm
To explore how ASD participants produced FEs com-pared to TD participants, we provide some insights on what the models learned and which facial landmarks were the most useful for discriminating between the various FE classes and qualities. These feature maps are proposed for each type of feature (geometric and appear-ance). Thus, the importance of a facial landmark is re-lated to the type of feature. First, 86.7% of the classification task was based on distances (geometric fea-tures), whereas 13.3% of the classification was based on HOG (appearance features) when the RF classifier was
trained on TD children. For RF classifiers trained on ASD children, the relative contributions were 83.3% and 16.7% for distance and HOG features, respectively. Examples are given in the supplemental material for anger, neutral and sadness FE (Additional file 1: Figures S2–S7). In Fig. 2, we chose to discuss happi-ness because this emotion was almost equally pro-duced by children with ASD and TD children, meaning that performance could not explain why the RF classifier learned in a different manner. As shown in Fig. 3 a (distances) and b (HOG), the RF classifier needed more facial landmarks (the more a feature is needed at a specific facial landmark, the larger the point is) to achieve the best classification in children with ASD compared to TD children, in particular for facial landmarks around the mouth. Additionally, in the TD child, the mouth is symmetrical, with large points at the extremities and small points in the mid-dle. In contrast, in the child with ASD, the symmetry is not perfect, and large points are distributed on the entire area of the lips and mouth. Regarding the upper part of the face, the RF classifier found more information (larger points) in the eyebrows and the eyes of the TD children. This was less the case for the children with ASD. It is likely that the eye re-gions contribute more to the recognition of happiness by the RF classifier in TD children. One possible hy-pothesis to explain the differences in the FE dynamics detected by the RF classifier for happiness is that the variance in the production of children with ASD is too high in the eyes region. As a consequence, the al-gorithm essentially used the mouth to identify happi-ness in the children with ASD. This difference highlights that the production of FEs in children with ASD carries more ambiguity.
Finally, ambiguity can also be captured in the confu-sion matrices that are shown in the supplement mate-rials (Additional file 1: Tables S6–S10). Overall, anger
expressions are often misclassified as neutral or sad ex-pressions. Sadness expressions are often recognized as either anger or neutral expressions. This discrepancy is due to the higher level of subtlety and variability in those two FEs (i.e. anger and sadness). Moreover, when RF classifiers were tested on children with ASD, anger was also confounded with happiness. This underlines a major difference between TD children and children with ASD: in the latter, RF classifiers have more difficulty distin-guishing between positive and negative expressions, meaning that children with ASD have difficulty produ-cing FEs with clear emotional cues.
Discussion
The two aims of our study were (1) to assess the impact of different factors (e.g. age, emotional subtype) on the
Table 5 RF classifier accuracy recognition of FEs by cross-validation
Learning on TD all (N = 157) ASD (N = 34) TD all (N = 157) Testing TD all (N = 157) ASD (N = 34) ASD (N = 34) Neutral 86.64 72.55 68.08 Happiness 90.47 70.38 85.05 Anger 79.76 58.17 58.62 Sadness 56.15 41.79 44.44 Global accuracy (SD) 82.05 (0.08) 66.43 (1.57) 69.3 (4.62)
production of FEs in children with ASD and to compare the production of these FEs to those of TD children and (2) to use a machine learning approach to understand which facial landmarks and features are relevant for pre-dicting FEs and to characterize the differences in FE dy-namics between TD children and children with ASD.
Factors influencing FE production in children with ASD
The multivariate model based on children with ASD and TD children did find a series of variables we expected to influence FE [6,14]. As expected, we found a significant group effect. The FEs of children with ASD were given lower scores than the FEs of TD children. These results are similar to those of earlier studies that found that the FEs of children with ASD were less clear and more awk-ward than the FEs of TD children [15, 16]. Additionally, FE emotional valence that has been shown to be an im-portant variable in TD children [6] was also an
important variable in children with ASD as the model remained significant when we added children with ASD to the model. Neutral expressions are the easiest to pro-duce. Positive expressions (joy) are more easily produced than negative expressions (anger and sadness). Sadness is the FE that was rated with the lowest quality. The study of potential statistical interactions between groups and emotional valence (Table4) shows that the deficit in FEs found in ASD children appears to be independent of the emotion subtype. These observations join the con-clusions of the study of Brewer et al. [21] on adults and part of the conclusion of Volker et al. [22], who found that positive emotions were easier to produce than nega-tive emotions in children with ASD. Regarding sadness, we did not find a specific deficit, in contrast to Volker et al. [22], but it should be noted that sadness was the most difficult FE to produce in both TD children and children with ASD. In addition, for all FEs, the gap
Fig. 3 Facial landmarks contributing to the classification of happiness using RF classifiers (training and testing) in TD children (left) and children with ASD (a distance; b HOG)
between the scores of TD children and those of chil-dren with ASD was not very large (see Fig. 2). Next, our experimental protocol included two tasks. We ex-pected that children with ASD would be better able to produce FEs in the imitation task than in the on request task through the help of a model. However, children’s productions were better in the on request task. As for TD children alone [6], the inclusion of a group of children with ASD did not modify the model. Children (TD or ASD) tend to exactly copy the avatar, producing FEs without searching for which emotion they have to convey. Indeed, FEs are less credible than they are in the on request task. These results are in line with what was found in adults with ASD [23]. These adults were better at producing FEs when they were explicitly asked to convey an emotion than in a standard posed task. However, these results are not in agreement with the observation of Love-land et al. [20], who found no difference between an imitation task and an expression task in terms of FE production in children with ASD. Finally, we found a significant effect for centre location in favour of chil-dren from Nice when we added the chilchil-dren with ASD to the model, as we found when examining only the TD children [6]. These findings also concur with the literature and the well-known effect of social en-vironment and culture on FE production [42].
In contrast to our hypothesis, we found no signifi-cant effect of age on the production of FEs in the multivariate model run on children with ASD and TD children even if the productions of older children tended to have better ratings. However, when we added IQ to the multivariate model that we applied only to children with ASD, we found no effect of age but a significant effect of the IQ on the quality of children’s FE productions. Children with ASD and a lower IQ produced FEs with less accuracy than chil-dren with ASD and a normal IQ. These observations are congruent with the data in the literature [14]. We could not explore age and IQ in the main model ap-plied to both TD children and children with ASD be-cause IQ was not measured in TD children. Therefore, interpretations should be proposed with caution. First, it is possible that when children with ASD and a lower IQ are included, developmental age is more important than chronological age. Second, children with ASD produce FEs in an odd way and are less able to spontaneously learn the correct way to produce FEs. Some authors have hypothesized that this difficulty comes from a lack of spontaneous imi-tation in children with ASD that could prevent them from naturally learning how to produce correct FEs (see [43] for a review). Finally, we found no effect of gender.
Evaluation of FEs with vision computing
We also aimed to characterize FE production in children with ASD with an FE recognition algorithm. Based on previous works in computer vision [44], we successfully combined facial landmarks and feature extraction with a random forest classifier. The accuracy reached when testing FEs of TD children after training on TD children were very good to excellent, except for sadness, which is a FE that is still difficult to produce in children in an ex-perimental context. When testing FEs of children with ASD, RF classifiers yielded excellent accuracy only for happiness when trained on TD children. The accuracy of all other combinations was significantly lower. These results confirmed the results of the behavioural annota-tions. We conducted several control calculations to as-sess possible biases (gender, age, city origin, size of the database for training) that confirm the robustness of our results.
More interestingly, we were able to determine which features were relevant for classifying FEs. First, the RF classifiers used both types of features to achieve the best classifications. Compared to appearance features (HOG), distance features appeared to predominantly contribute to RF classification in both groups. Leo et al. also found that HOG were important contributing features using a machine learning algorithm [31]. We chose to combine HOG and distance features as distance features were re-cently used to successfully explore FEs using motion capture during an imitation task in children with ASD [29]. However, no study used both features to explore relative contributions. Second, when we explored the dy-namics of the classification between groups, it appears that RF classifiers needed more facial landmarks to achieve FE classification in children with ASD than in TD children. This observation was replicated with the FEs of joy, anger and neutral even when we trained the RF classifiers on a sub-dataset of TD children matched to children with ASD in age, gender and culture or when we controlled for differences in sample size. This finding supports the idea that FE productions in children with ASD are more ambiguous and, as a consequence, harder to classify [15,16, 20]. We hypothesize that the impres-sion of oddity described by human judges comes from this ambiguity. These results concur with the findings of Zane et al., who found worse valence predictability in children with ASD, suggesting more ambiguous expres-sions [29]. The difficulty in classifying FEs in children with ASD can also come from the variance in their pro-ductions that seem to be larger than that in TD children. Additionally, training RF classifiers on children with ASD does not increase the accuracy of the classification of FEs in children with ASD, supporting the fact that people with ASD do not share a specific way to produce FEs [21].
In the literature, it has been shown that children with ASD tend to focus on the mouth instead of the eyes when they explore a human face [33]. Although produ-cing a FE with emotional valence is not the same as ex-ploring a face, we did not observe a specific use of the mouth or neglected use of the eyes (data not shown). This observation concurs with the findings that even the abilities of children with ASD to correctly produce the upper or the lower face configuration depend on emo-tion subtypes, and they mostly depend on the children who produced the FEs [31], meaning that variability is higher in ASD children, as shown previously [27]. As shown in Fig.2and Additional file1: Figures S1–S6, the
RF classifiers use roughly the same facial landmarks in children with ASD and in TD children, but they need more facial landmarks to achieve the best classification for children with ASD. This more ambiguous way of producing FEs in children with ASD is also revealed by the way RF classifiers made mistakes. For example, we observed that when the algorithm was trained on TD children, it tended to classify anger as joy more often when it was testing children with ASD (18.62%) than TD children (5.18%). However, we believe that the pro-posal of Grossman and Narayanan to use measures of synchrony and complexity would be the next step for our dataset to explore their preliminary findings [27,28].
Limitations
Despite its novelty, our study has some limitations. First, to collect a large database of TD children to produce high-performing FE classifiers, we did not measure IQ in TD children. This prevents us from using IQ in models exploring an interaction with age. In addition, the ASD group had slightly lower IQ than the average; this might have exaggerated the differences between the two groups, as IQ has the potential to influence FE produc-tion [14]. Additionally, we found that shorter videos tended to be better rated than longer videos, but this ef-fect was not significant. Future research should control the duration of the videos to better understand the im-portance of this factor. Second, compared to the large dataset of TD children, our group of children with ASD was modest in terms of sample size. However, we tried to compensate for this limitation by using several con-trol calculations that were made possible by the high ac-curacy of our RF classifiers. When we lowered the sample size of the TD children, recognition accuracy for sadness decreased, indicating that the number of videos influences the accuracy of the algorithm. However, we did not find changes in the results for joy, anger and neutral, meaning that the impact of sample size was lim-ited. Third, we adopted two experimental protocols to help children produce FEs. We do not know whether our results would have been similar using more natural
scenarios [14,15]. Fourth, annotations by human judges were made on the entire video, using audio cues when available, while the RF classifiers used only the apex of the FE to classify it, making the two annotations difficult to compare. Future research should compare audio-visual human judgement with audio and audio-visual comput-ing classifiers. However, despite these differences in an-notation, FEs of children with ASD appear to be more difficult to classify in both situations, supporting that their productions are more ‘awkward’ than the produc-tions of TD children [20]. Furthermore, the judges were not blinded to the diagnosis, which could have influ-enced their ratings. Fifth, we did not assess social skills in either group despite social skills and facial expressive-ness being related [45]. Finally, we did not take into ac-count factors that could influence the classification accuracy of RF classifiers, such as the type of tasks and the facial characteristics of children (e.g. origin and gen-der). Future studies should explore the impact of these factors.
Conclusion
FE production in children with ASD has received less at-tention than their capacities in FE recognition. In the current study, we used two parallel approaches: human judge ratings and computer vision methods. The first ap-proach, which took into account many confounding fac-tors, demonstrated that children with ASD indeed have more difficulty producing recognizable and credible FEs. The second approach yielded that the production of FEs in children with ASD carries more ambiguity, as shown by the fact that RF classifiers needed more facial land-marks to classify FE production in children with ASD or tended to classify anger as joy more often in children with ASD. More research is needed to better characterize deficits in FE production in children with ASD. We believe that the combination of more eco-logical frameworks for FE production and computer vi-sion would be a possible next step to better understand FE production in children with ASD.
Supplementary information
Supplementary information accompanies this paper athttps://doi.org/10. 1186/s13229-020-0312-2.
Additional file 1. Table S1. Matching characteristics of the TD subgroups for machine learning. Table S2. Emotion production in children with ASD as a function of age, gender, group, order, modality, elicitation task, emotion and sites: results from the GLMM model. Table S3. Durations of videos during emotion production in children with ASD and TD children. Table S4. Radom forest classifier accuracy recognition of the FE. Table S5. Radom forest classifier accuracy recognition of FE when learning on TD group 1 or 2. Table S6. Confusion matrix when learning and testing on TD. Table S7. Confusion matrix when learning on TSA and testing on TSA. Table S8. Confusion matrix when learning on TD and testing on TSA. Table S9. Confusion matrix when learning on
TD1 and testing on TD1. Table S10. Confusion matrix when learning on TD2 and testing on TD2. Figure S1. Histogram of the videos’ duration. Figure S2 and S3. Facial landmarks contributing to classification of anger using random forest (training and testing) in children with typical development (left) and children with autism spectrum disorder (S2: Distance; S3: HOG). Figure S4 and S5. Facial landmarks contributing to classification of neutral facial expression using random forest (training and testing) in children with typical development (left) and children with autism spectrum disorder (S4: Distance; S5: HOG). Figure S6 and S7. Facial landmarks contributing to classification of sadness using random forest (training and testing) in children with typical development (left) and children with autism spectrum disorder (S6: Distance; S7: HOG).
Abbreviations
ADI-R:Autism Diagnosis Interview-Revised; ADOS: Autism Diagnosis Observation Schedule; ASD: Autism spectrum disorders; FE: Facial expression; GLMM: Generalized linear mixed models; HOG: Histogram of oriented gradients; IOD: Inter-ocular distance; IQ: Intellectual quotient; RF: Random forest; TD: Typical development
Acknowledgements
This work has been supported by the French National Agency (ANR) in the frame of its Technological Research JCJC program (FACIL, project ANR-17-CE33-0002).
Authors’ contributions
DC, LC and KB designed the study. CG, SH, JB and SS recorded the videos of TD children and children with ASD. EJ, FH and SH rated all the videos. AD, SB and KB trained the algorithm. HP and DC performed the statistical analysis. CG, DC, SB and LC wrote the first draft of the manuscript. All authors revised and approved the final version of the manuscript. Funding
The study was supported by the Agence Nationale pour la Recherche (ANR) within the program CONTINT (JEMImE, n° ANR-13-CORD-0004) and the JCJC program (FacIL, project ANR-17-CE33-0002).
Availability of data and materials
The datasets used and/or analysed during the current study are available from the corresponding author on reasonable request.
Ethics approval and consent to participate
The study was approved by the ethical committee of Nice University (Comité de Protection des Personnes Sud Méditerranée) under the number 15-HPNCL-02.
Consent for publication Not applicable Competing interests
The authors declare that they have no competing interest. Author details
1Service de Psychiatrie de l’Enfant et de l’Adolescent, GH Pitié-Salpêtrière
Charles Foix, APHP.6, Paris, France.2Institut des Systèmes Intelligents et de Robotique, Sorbonne Université, ISIR CNRS UMR 7222, Paris, France.
3Université de Nice Sophia Antipolis, Nice, France.4Institut de Psychologie,
Université de Paris, 92100 Boulogne-Billancourt, France.
Received: 8 August 2019 Accepted: 1 January 2020
References
1. Sullivan MW, Lewis M. Emotional expressions of young infants and children: a practitioner’s primer. Infants Young Children. 2003;16(2):120–42. 2. Oster H. The repertoire of infant facial expressions: an ontogenetic
perspective. Emot Dev. 2005:261–92.
3. Sroufe LA. Emotional development. NewYork: Cambridge University Press; 1996.
4. Camras LA, Lambrecht L, Michel GF. Infant“surprise” expressions as coordinative motor structures. J Nonverbal Behav. 1996;20(3):183–95. 5. Ekman P, Roper G, Hager JC. Deliberate facial movement. Child Dev. 1980:
886–91.
6. Grossard C, Chaby L, Hun S, et al. Children facial expression production: influence of age, gender, emotion subtype, elicitation condition and culture. Front Psychol. 2018;9:446.
7. Brun P. Psychopathologie de l’émotion chez l’enfant: l’importance des données développementales typiques. Enfance. 2001;53(3):281–91. 8. Field TM, Walden TA. Production and discrimination of facial expressions by
preschool children. Child Develop. 1982:1299–311.
9. Komatsu S, Hakoda Y. Construction and evaluation of a facial expression database of children. Shinrigaku Kenkyu. 2012;83(3):217–24.
10. Camras LA, Oster H, Ujiie T, Campos JJ, Bakeman R, Meng Z. Do infants show distinct negative facial expressions for fear and anger? Emotional expression in 11-month-old European American, Chinese, and Japanese infants. Infancy. 2007;11(2):131–55.
11. Muzard A, Kwon AY, Espinosa N, Vallotton CD, Farkas C. Infants’ emotional expression: differences in the expression of pleasure and discomfort between infants from Chile and the United States. Infant Child Develop. 2017;26(6):e2033.
12. Sasson NJ, Faso DJ, Nugent J, Lovell S, Kennedy DP, Grossman RB. Neurotypical peers are less willing to interact with those with autism based on thin slice judgments. Sci Rep. 2017;7:40700.
13. Stagg SD, Slavny R, Hand C, Cardoso A, Smith P. Does facial expressivity count? How typically developing children respond initially to children with autism. Autism. 2014;18(6):704–11.
14. Trevisan DA, Hoskyn M, Birmingham E. Facial expression production in autism: a meta-analysis. Autism Res. 2018;11(12):1586–601.
15. Yirmiya N, Kasari C, Sigman M, Mundy P. Facial expressions of affect in autistic, mentally retarded and normal children. J Child Psychol Psychiatry. 1989;30(5):725–35.
16. Grossman RB, Edelson LR, Tager-Flusberg H. Emotional facial and vocal expressions during story retelling by children and adolescents with high-functioning autism. J Speech Lang Hear Res. 2013;56(3):1035–44.https://doi. org/10.1044/1092-4388(2012/12-0067).
17. Capps L, Kasari C, Yirmiya N, Sigman M. Parental perception of emotional expressiveness in children with autism. J Consult Clin Psychol. 1993;61(3): 475.
18. Zane E, Neumeyer K, Mertens J, Chugg A, Grossman RB. I think we’re alone now: solitary social behaviors in adolescents with autism spectrum disorder. Journal of abnormal child psychology. 2018;46(5):1111–20.
19. Kasari C, Sigman M, Yirmiya N. Focused and social atten- tion of autistic children in interactions with familiar and unfamiliar adults: a comparison of autistic, mentally retarded, and normal children. Develop Psychopathol. 1993;5(3):403–14https://doi.org/10.1017/S0954579400004491.
20. Loveland KA, Tunali-Kotoski B, Pearson DA, Brelsford KA, Ortegon J, Chen R. Imitation and expression of facial affect in autism. Develop Psychopathol. 1994;6(3):433–44.
21. Brewer R, Biotti F, Catmur C, Press C, Happé F, Cook R, Bird G. Can neurotypical individuals read autistic facial expressions? Atypical production of emotional facial expressions in autism spectrum disorders. Autism Res. 2016;9(2):262–71.
22. Volker MA, Lopata C, Smith DA, Thomeer ML. Facial encoding of children with high-functioning autism spectrum disorders. Focus Autism Other Develop Disabil. 2009;24(4):195–204.
23. Faso DJ, Sasson NJ, Pinkham AE. Evaluating posed and evoked facial expressions of emotion from adults with autism spectrum disorder. J Autism Dev Disord. 2015;45(1):75–89.
24. Senju A. Atypical development of spontaneous social cognition in autism spectrum disorders. Brain Dev. 2013;35(2):96–101.
25. Dapogny A, Bailly K, Dubuisson S. Pairwise conditional random forests for facial expression recognition. In: Proceedings of the IEEE international conference on computer vision; 2015. p. 3783–91.
26. Samad MD. Computational modeling of facial response for detecting differential traits in Autism Spectrum Disorders [Doctor of Philosophy (PhD), dissertation, Electrical/Computer Engineering] Old Dominion University. doi:
https://doi.org/10.25777/q96j-7v27
27. Metallinou A, Grossman RB, Narayanan S. Quantifying atypicality in affective facial expressions of children with autism spectrum disorders. Proc IEEE Int Conf Multimed Expo. 2013:1–6.https://doi.org/10.1109/ICME.2013.6607640.
28. Guha T, Yang Z, Grossman RB, Narayanan SS. A computational study of expressive facial dynamics in children with autism. IEEE Trans Affect Comput. 2018;9(1):14–20.https://doi.org/10.1109/TAFFC.2016.2578316. 29. Zane E, Yang Z, Pozzan L, Guha T, Narayanan S, Grossman RB. Motion-capture patterns of voluntarily mimicked dynamic facial expressions in children and adolescents with and without ASD. J Autism Dev Disord. 2019; 49(3):1062–79.https://doi.org/10.1007/s10803-018-3811-7.
30. Owada K, Kojima M, Yassin W, et al. Computer-analyzed facial expression as a surrogate marker for autism spectrum social core symptoms. PloS One. 2018;13(1):e0190442.
31. Leo M, Carcagnì P, Distante C, et al. Computational assessment of facial expression production in ASD children. Sensors. 2018;18(11):3993. 32. Martinez B, Valstar MF, Jiang B, Pantic M. Automatic analysis of facial actions:
a survey. IEEE Transac Affect Comput. 2019;10(3):325–47, 1.https://doi.org/ 10.1109/TAFFC.2017.2731763.
33. Klin A, Jones W, Schultz R, Volkmar F, Cohen D. Visual fixation patterns during viewing of naturalistic social situations as predictors of social competence in individuals with autism. Arch Gen Psychiatry. 2002;59(9):809–16.
34. Belin P, Fillion-Bilodeau S, Gosselin F. The Montreal Affective Voices: a validated set of nonverbal affect bursts for research on auditory affective processing. Behav Res Methods. 2008;40(2):31–539.
35. Egger HL, Pine DS, Nelson E, Leibenluft E, Ernst M, Towbin KE, Angold A. The NIMH Child Emotional Faces Picture Set (NIMH-ChEFS): a new set of children’s facial emotion stimuli. Int J Methods Psychiatr Res. 2011;20(3):145–56. 36. Mazurski EJ, Bond NW. A new series of slides depicting facial expressions of
affect: a comparison with the pictures of facial affect series. Aust J Psychol. 1993;45(1):41–7.
37. Bänziger T, Mortillaro M, Scherer KR. Introducing the Geneva Multimodal Expression corpus for experimental research on emotion perception. Emotion. 2012;12(5):1161–79.
38. Viola P, Jones M. Rapid object detection using a boosted cascade of simple features. CVPR. 2001;1(511-518):3.
39. Xiong X, De la Torre F. Supervised descent method and its applications to face alignment. In: Proceedings of the IEEE conference on computer vision and pattern recognition; 2013. p. 532–9.
40. Dalal N, Triggs B. Histograms of oriented gradients for human detection; 2005.
41. Breiman L. Random forests. Machine Learning. 2001;45(1):5–32. 42. Camras LA, Chen Y, Bakeman R, Norris K, Cain TR. Culture, ethnicity, and
children’s facial expressions: a study of European American, mainland Chinese, Chinese American, and adopted Chinese girls. Emotion. 2006;6(1):103–14. 43. Vivanti G, Hamilton A. Imitation in autism spectrum disorders. In: Volkmar
FR, Paul R, Rogers SJ, Pelphrey KA, editors. Handbook of autism and pervasive developmental disorders, fourth edition: Wiley; 2014. 44. Dapogny A, Bailly K, Dubuisson S. Confidence-weighted local expression
predictions for occlusion handling in expression recognition and action unit detection. Int J Comp Vision. 2018;126(2–4):255–71.
45. Riggio HR, Riggio RE. Extraversion, neuroticism, and emotional expressiveness: a meta-analysis. J Nonvl Behav. 2002;26:195–218.
Publisher’s Note
Springer Nature remains neutral with regard to jurisdictional claims in published maps and institutional affiliations.