HAL Id: tel-02018734
https://tel.archives-ouvertes.fr/tel-02018734
Submitted on 14 Feb 2019HAL is a multi-disciplinary open access archive for the deposit and dissemination of sci-entific research documents, whether they are pub-lished or not. The documents may come from teaching and research institutions in France or abroad, or from public or private research centers.
L’archive ouverte pluridisciplinaire HAL, est destinée au dépôt et à la diffusion de documents scientifiques de niveau recherche, publiés ou non, émanant des établissements d’enseignement et de recherche français ou étrangers, des laboratoires publics ou privés.
Ultrafast diffusion-ordered NMR analysis of mixtures
Ludmilla Guduff
To cite this version:
Ludmilla Guduff. Ultrafast diffusion-ordered NMR analysis of mixtures. Analytical chemistry. Uni-versité Paris Saclay (COmUE), 2018. English. �NNT : 2018SACLS239�. �tel-02018734�
1
Acknowledgments
-sur-- ce
manuscrit.
eijenoort et Jean-Nicolas Dumez, mes deux -Nicolas pour ta
e que je
- a
-c
Nadine, Annie, Ewen, Jean- -Marie, Camille, Corentin, Ghanem et
Maria. Guillaume
!) pour
2
ur ta
pour ton humour et Jean- pathie, tes conseils, ton aide au spectro et surtout pour
et ton !), Christophe pour ta sympathie, Claire-Marie pour ta joie de vivre et ta positive attitude (you pop girl
Corentin pour ta grande gentillesse et ta
ton optimisme.
ctorants, post-doc et
-hui, Marie, Prishila,
-Coralie, Gwendal et Au
Joker, Big RoRo, Charles, Valentin, Simon, Tanya, Morgane, Laure, Julie Orianne Brel
-Charlotte
Leman-Charlotte Juillet, Laurent La ! Un grand merci
le rugby et pour les ?).
3
er Mickael, Kelly,
co-tellement gratifiant
ent et qui contribuent
ou encore les bonbons en gu
-
4
Introduction
Son utilisation pour des applications dans les domaines tels que la chimie, la biologie ou la pharmacie a -- ou - multi-ues, -ordered respectivement des nous avons RMN ultrarapide
5
tout de
: la polarisa
telle est souvent
6
1H et les carbones 13
translationnelle ou encore
facilite leur identificati
-1H-1
-1H-13C par exemple). La combinaison de c
sont observables (par exemple,
K, 0.006 %).
- eut
nombreuses applications dans divers domaines de applications innovantes
celle-7 translationnelle - ou mouvement Brownien-
-Einstein qui fait inte
coefficients de diffu .
- -
-oefficients de diffusion.
elle limite les effets -ci induisent une perte
ca
8
signal et des oscillation visibles sur la courbe de
N DOSY
9
-2D en moins
sation
Nous avons vu que la
de 10-5 dans des conditions standards). T
le rapport signal sur bruit (SNR
Brute
-polarisation dynami SABRE.
un agent polarisant, un radical
T1 du
noyau. Ce T1
Signal Amplification by Reversible E
para-10 via le couplage scalaire J, ce qui implique que le
para
-efficients de
dont la varie
Approche pratique de la RMN DOSY ultrarapide
enregistrer des spectres DOSY en moins de 1
signal par la diffusion.
r induire
11
dans la version de Frydman,
celui-es
lors du calcul des coefficients de diffusion.
gissement des signaux de ce spectre. Ces
chimique et de dif
gradients
des gradients bipolaires donne des valeurs de diffusion plus proches de celle de la DOSY conventionnelle.
12 -fficients -temporelle L MATLAB) par le Dr. Ilya Kuprov.
-c
1
ajustement.
ns de 2 min.
13 dans les exp
pris
ielles qui induisent un biais sur les valeurs
de
n que
obtenir des courbes de diffusion de meilleure
chois
-(convection, courants de Foucault, gradient
non--ci induit des oscillations des courbes de diffusion ainsi
couramment
14
ment
-Application de la SPEN DOSY s -DNP
000 est possible. Cependant ce type
de relaxation longitudinal (T1 1H et 13
multidimensionnelles ultrarapides telles que la SPEN DOSY pour enregistrer ce type de signaux dans
En effet, le T1 -Nous avons De 13C au lieu du 1H car son T1 de 1s). P
15
(STE) ne permet pas une utilisation
--acquisition nous pourrions avoir de meilleurs tau
moins.
Ce couplage innovant entre
D-le temps.
Application de la SPEN DOSY s
-e SABRE (Signal Amplification
amines, amides, acides carboxylique, alcools, phosphates, ou autres carbonates.
16
T1 des protons qui est
de 5 s
celui-S
au gain maximal attendu avec notre protocole. Des tentatives pour diminuer la concentration de notre
de cet outil que nous avons mis en place en collaboration avec Gaspard Huber and Patrick
Conclusions et perspectives
17
i
13C sur 1H sur un
convection induite lors du pro
on dans le
Les outils DNP-SPEN DOSY et SABRE-SPEN DOSY mis en place offrent un potentiel certain ension du champ
18
23
Notations and abbreviations
13C Carbon 15N Nitrogen 1D One-dimensional 1H Proton 2D Two-dimensional 31P Phorsphorus 3D Three-dimensional
ADSE Adiabatic Double Spin Echo
ALTADENA Adiabatic Longitudinal Transport After Dissociation Engenders Net Alignment
ASE Adiabatic Spin Echo
B0 Main magnetic field
BEST Band-selective Excitation Short-Transient
BPPSTE Bipolar Pulse Pair Stimulated Echo
BW BandWidth
COD Cyclooctadiene
COSY Correlation Ordered SpectroscopY
CP Cross-Polarization
CPMG Carr Purcell Meiboom Gill
CSV Coefficient Standard de Variation
CT Constant-Time
CTP Coherence Transfert Pathway
D Diffusion coeffcient
D-DNP Dissolution- Dynamic Nuclear Polarization
DANTE Delays Alternating with Nutations for Tailored Excitation
DOSY Diffusion-Ordered SpectroscpY
DQF Double Quantum Filtered
DSTE Double Stimulated Echo
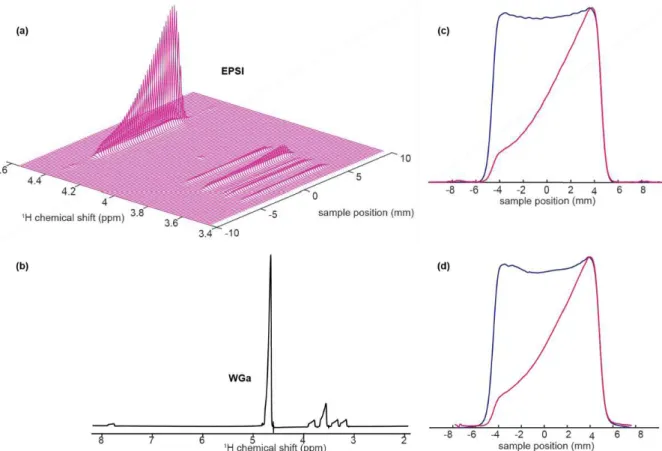
EPSI Echo-Planar Spectrocopic Imaging
FAMOUS Fast Multi-Spin-Echo Diffusion Sequences
FID Free induction
FOV Field Of View
FT Fourier Transformation
24
HMBC Heteronuclear Multiple Bond Coherence
HMQC Heteronuclear Multiple Quantum Coherence
HSQC Heteronuclear Single Quantum Coherence
HTS High Throughput Screening
iDOSY Internal Diffusion-Orderred SpectroscopY
IMes 1,3-bis(2,4,6-trimethylphenyl)imidazole-2-ylidene INEPT Insensitive Nuclei Enhanced by Polarization Transfer
ITAMED Iterative Thresholding Algorithm for Multiexponential Decay
J-Res J-Resolved
LED Longitudinal Eddy current Delay
MAD Matrix-Assisted DOSY
MMME Multiple Modulation Multiple Echoes
MRI Magnetic Resonance Imaging
ND Multi-Dimensional
NMR Nuclear Magnetic Resonance
NE Non-Echoed
NOE Nuclear Overhauser Effect
p-H2 Para-Hydrogen
p-jres Projected-J-Resolved
PASADENA Parahydrogen And Synthesis Allow Dramatically Enhanced Nuclear Alignment
PCy3 Tricyclohexyl phosphine,
PFG Pulsed Field Gradient
PGMSE Pulsed field-gradient multiple spin-echo
PHIP Para-Hydrogen-Induced Polarization
RF Radio Frequency
SABRE Signal Amplification by Reversible Exchange
SE Spin Echo
SEOP Spin-Exchange Optical Pumping
SNR Signal to Noise Ratio
SPEN SPatially ENcoded
STE STimulated Echo
T1 Longitudinal relaxation time
T2 Transverse relaxation time
TEMPOL 4-hydroxy-2,2,6,6-tetramethylpiperidin-1-oxyl
25
UF UltraFast
26
1. Introduction
The identification and characterization of molecular species lie at the core of chemical science, whether for natural product research or chemical synthesis [1 3]. Separative techniques such as chromatography have become a staple method when it comes to addressing one of the main concerns of chemists: retrieving the pure individual compounds of a mixture. Still, this is a tedious and long task that can lead to degradation and the loss of certain compounds.
A worthwhile tool that has demonstrated its effectiveness toward mixture analysis is nuclear magnetic resonance (NMR) spectroscopy, even though it is primarily regarded as an essential and powerful tool for structural elucidation [4 7]. As a non-destructive method that does not require any previous separation step or any derivatization and, in addition, that offers highly reproducible results, NMR spectroscopy possesses undeniable assets to address the challenge of mixture analysis. Many applications in the field of chemistry, biology, pharmacy, food and environment have taken advantages of NMR for this purpose [8 15]. A variety of schemes have been reported to unravel the spectra of mixtures, going from simple 1D experiments to more intricate multidimensional experiments [16]; They rely on information on the chemical environment of nuclei such as proton 1H, carbon 13C, nitrogen 15N
or phosphorus 31P and also exploit relaxation, diffusion and coupling properties in order to simplify the
NMR spectrum of a mixture [4,17 23].
Among the existing methods to separate the NMR spectra of components within mixtures, diffusion-ordered spectroscopy (DOSY) experiments are commonly used [24 27]. This method is considered as a form of virtual chromatography and the spectra of each compound are sorted according to diffusion coefficient values. Pulsed field gradients (PFG) are used to measure molecular displacement that affect the detected signal by attenuating it. DOSY data are generated via incrementation of the gradient area over time so that the detected signal is made dependent on both the gradient strength and the diffusion rate. Each spectrum generated for one gradient level is attenuated to some extent and each species will have its own decay rate. Monoexponential fitting of decaying signals yields the associated diffusion coefficient and resonances can be sorted according to these values. DOSY is commonly applicable for 1D or 2D experiments leading to pseudo-2D or pseudo-3D experiment because of the use of an incremented gradient area to create the additional diffusion dimension [28 31]. This will result in significant lengthening of the experiment but this is mandatory when the mixture contains a large number of compounds leading to a decreased resolution that complicate the identification of signals. This experiment is known since the mid 90s and DOSY has led to applications in many areas of research, and it still has a large potential for further developments and applications [29,32 34]. However, the lack of sensitivity of this method along with its duration that increases with the dimensionality of the experiment which is also true for all multidimensional NMR experiments in general are obstacles to its use in some important cases. To meet the current needs of complex mixture characterization and
27
expand its range of application, DOSY NMR must be faster and more sensitive. Overall, new innovative strategies have emerged to overcome the limitations regarding speed and sensitivity of multidimensional methods and they will be exploited in combination with diffusion NMR methods in order to create novel tools.
Attempts to reduce the duration of the DOSY experiment have resulted in several strategies that differ by their diffusion encoding strategies [35]. Some of them are meant to reduce the number of required scans to one, based on multiple gradients pulses, on multiple RF pulses, and on spatial encoding. Others, even if they require multiple scans, provide significant reduction of the duration of DOSY experiments through reduced sampling or reduced delay between scans [36][37]. The spatial encoding strategy was chosen to carry out this project. Indeed, a dramatic acceleration of multidimensional (ND) NMR experiments may be obtained with the
so-NMR) approach, which replaces the sequential acquisition of sub-experiments by a parallel acquisition in different parts of the sample [38]. The potential of UF NMR has been demonstrated for metabolomics analysis or real-time processes monitoring [39]. Many experiments such as COSY, TOCSY or HSQC have benefited of this acceleration strategy which appear to possess a general scope of application [40]. In the case of the DOSY experiment, promising results were obtained but its full potentiality has not been fully exploited yet for mixture analysis [41,42]. Unfortunately, this gain in terms of time comes at the expense of sensitivity which is significantly reduced.
Generally speaking, NMR spectroscopy possesses a low sensitivity due to the small fraction of nuclear spins that are observable. Traditional means to increase sensitivity consist in increasing the sample concentration, using labelled compounds, going to a higher magnetic field or decreasing the temperature; which is not always possible or meaningful [43]. All of these methods used together lead to significant improvement in sensitivity but still the polarization level remains quite low as it obeys to Boltzman distribution. Solutions aiming to increase polarization level close to 1 are found in the realm of hyperpolarization. These techniques provide a considerable signal enhancement of several orders of magnitude compared to thermal equilibrium experiments. One can cite approaches such as Brute Force hyperpolarization, spin-exchange optical pumping (SEOP), polarization induced by para-hydrogen and its SABRE (Signal amplification by reversible exchange) version or dynamic nuclear polarization (DNP). The combination of conventional diffusion-based method with advanced techniques such as ultrafast NMR and hyperpolarisation should mark a significant progress for complex mixtures analysis and this particular coupling has not been fully investigated yet. Multidimensional spatially encoded (SPEN) DOSY NMR coupled with hyperpolarisation techniques would be of great interest in the case where the studied mixtures are not stable over time and could eventually find applications for real-time reaction monitoring and analysis of natural products.
In the first part of this project, we focused on the development of fast multidimensional diffusion-based NMR methods in order to separate the pure spectra of compounds within a mixture. Two types of spatially encoded DOSY experiments were studied as preliminary steps of the overall
28
project. Reproducing these existing sequences and performing the associated data analysis allowed us to fully understand their properties and the underlying theoretical considerations. Both approaches are similar considering the fact that they use a spatial encoding block to encode diffusion. These strategies differ from one another by their acquisition block inspired from spectroscopic imaging scheme. Indeed, the first approach is characterised by signal acquisition under a weak read gradient whereas the other one uses a train of bipolar gradient pulses. An improved sequence of SPEN DOSY was designed embedding in a distinct way all the advantageous features identified to get optimum results.
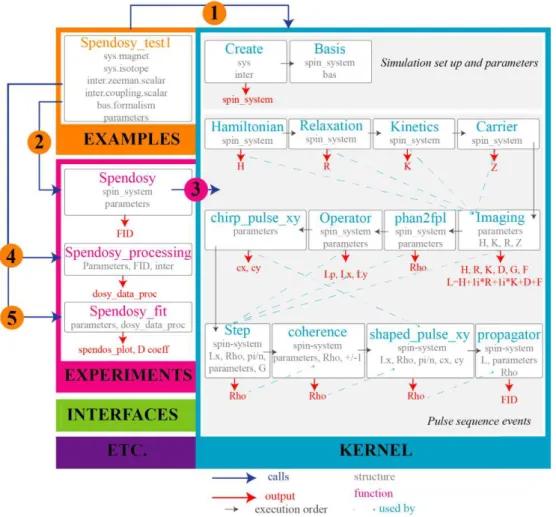
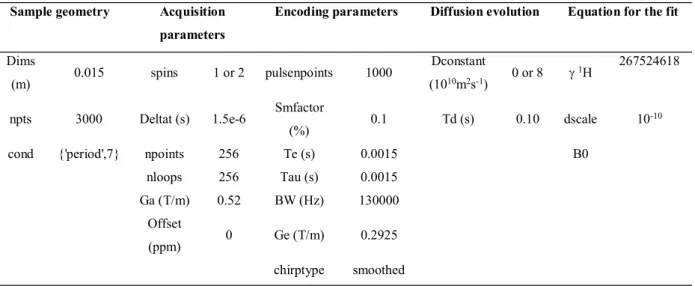
The second line of the project was dedicated to the optimization in order to reduce systematic errors and also for addressing limitations of SPEN DOSY. Since the quality of the DOSY data are sensitive to many experimental factors, we have proposed a solution to reduce the effect of one of them, sample convection, that tends to cause an overestimation of diffusion coefficients. To address the limitations of SPEN DOSY for crowded spectra, a higher dimensionality DOSY experiment that can be recorded in the time of a classic 2D DOSY was designed. The issue of resolution, caused by a reduced spectral width in spatially encoded experiments, was also addressed using spectral selection and pure-absorption spectral processing. Numerical simulations using the Spinach library [44], in partnership with Ilya Kuprov at University of Southampton, were made as well to improve the accuracy of the diffusion coefficient measured. The description of our SPEN-DOSY experiment was fully investigated in terms of convergence, effect of the parameters, effect of flow and model adjustment. All these improvements led to a SPEN DOSY experiment that was applicable to chemical reaction monitoring and the study of hyperpolarized mixtures, which constitute the last part of this thesis.
The final part of the project was dedicated to the combination of these fast methods with hyperpolarisation strategies. The first option that we explored was the coupling of SPEN DOSY with dissolution dynamic nuclear polarization (D-DNP) that provides signal enhancements of up to 10 000 [45 48]. Since the amplified signal last for few tens of seconds because of longitudinal relaxation, SPEN DOSY experiments appear to be suitable to be combined with DNP and record DOSY spectra of hyperpolarized mixtures in the imparted time-window (less than 1 min in the case of 13C). As DOSY
experiments are strongly impacted by convection, the pulse sequence was upgraded to compensate for convection. This innovative coupling between D-DNP and SPEN DOSY was carried in partnership with
normale s
Daniel Abergel. The other hyperpolarization strategy studied in parallel was the signal amplification by reversible exchange (SABRE) method that consists in a transfer of polarisation from parahydrogen to the substrate [49,50]. The transfer is done via interaction between the substrate, a metal complex and parahydrogen that form a temporary intermediate. The resulting enhanced signal last for few seconds so SPEN DOSY experiments are also well indicated to record this type of signal. This approach grants high levels of polarisation at low cost as the population difference between spins states can be increased of several orders of magnitude. These experiments were done in collaboration with Gaspard Huber and Patrick Berthault in CEA Saclay.
29
2. NMR spectroscopy, a non-destructive tool for mixture analysis
This chapter aims to give a general description on how NMR spectroscopy can be used in order to address the challenge of small-molecules mixture analysis. One-dimensional and multidimensional NMR experiments are presented as well as their applications, relevance and limitations towards mixture analysis.
2.1. The challenge of mixture analysis
Chemical sciences strongly hinge on structural characterization and identification of molecular species. Whether it is for natural product research [1,2], chemical synthesis or metabolomics studies [3], retrieving the pure compound to be analyzed is traditionally a prerequisite. Before stepping into the structural determination process, the sample should be purified in order to dispose of side compounds and isolate targeted ones from the mixture to which they belong. When it comes to complex mixture analysis, separation techniques such as chromatography have become a standard staple method in order to fractionate a sample into its individual constituents. However, this step is highly time-consuming and may results in degradation of sensitives compounds. Besides, chromatography used in conjunction with mass spectrometry provides elucidation of molecular structure even when the compound is present in small quantities (nanomolar range) and with a high resolution. As a result, it is used in routine analysis to make sure that samples are clear from unwanted compounds or for reasons of safety and quality of the products.
A valuable analytical tool for complex mixture analysis is nuclear magnetic resonance (NMR) spectroscopy [4,5]. Since its advent [6,7], NMR spectroscopy has become the preeminent methods for structural elucidation of molecules in solution as it grants access to information on the chemical environment of nuclei when placed in a static magnetic field. The measurement of parameters by NMR such as chemical shifts, relaxations rates, correlation times or diffusion coefficients provide information on molecular structure, size, binding events, and reaction kinetics [20]. It is common practice to go through extensive chromatographic fractionation before submitting the analytes to spectroscopic analysis. Nevertheless, with the recent developments of more sophisticated NMR experiments, hardware and instrument technology, the scope of applications of NMR spectroscopy has increased significantly
30
[16]. Its ability to provide rich information on structure, interaction and dynamics of molecules has extended to the direct analysis of mixtures.
NMR spectroscopy offers the advantages of being non-invasive and non-destructive, in contrast to chromatographic analysis that is destructive for sample since we need to either heat it (when performing gas chromatography) or dilute it (when performing liquid chromatography) with considerable amount of solvent. It is a non-biased method that is suitable for many types of samples regardless of their chemical nature. Minimal to no preparation steps are needed before proceeding to the analysis and it is not necessary to go through derivatization steps. It provides extensive structural information on analytes and is highly reproducible with accuracy and precision. In addition, a direct, separation-free analysis can also result in time savings. The main limitations of NMR are a lack of resolution when to many compounds are present and a limited sensitivity.
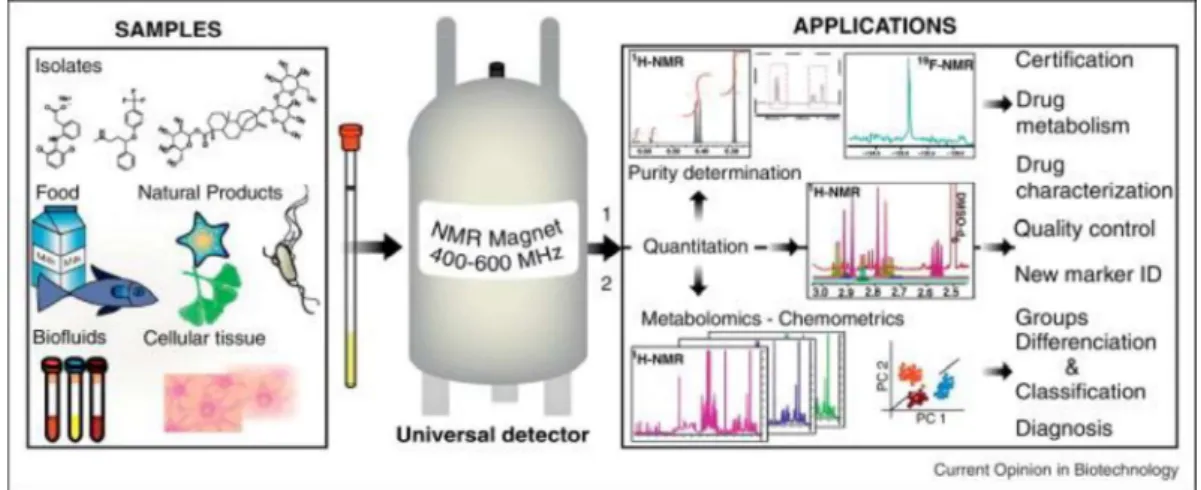
Figure 1: Sample varieties and panel of qNMR applications The current applications of qNMR can be dvided in two main groups: (1) absolute quantitation and purity determination of organic compounds (drugs, primary metabolites, natural products); and (2) metabolomics and quantitation of multiple analytes in complex natural matrices (e.g., food, botanicals, biofluids). Essentially all types of metabolites (e.g., sugars, fatty acids, organic acids, steroids) can be detected by NMR, explaining why a wide range of samples can be investigated. Therefore, qNMR applications cover the certification of purity, the identification and quantitation of drug metabolites, the quality control of food products and herbal remedies, the identification of biomarkers in complex natural matrices (e.g., herbal mixtures, biofluids), and finally clinical diagnosis. Reprinted with permission from [1]
2013 Elsevier Ltd. All rights reserved.
Many efforts have been made to take advantages of NMR spectroscopy for the characterization of mixtures [8], not only for applications in chemical sciences, but also in biology, pharmacy [9], food industry or for environment as schematized in Figure 1. It is a great tool for the understanding of chemical processes through reaction monitoring as it helps to characterize intermediates. Applications are also found in natural products research, for metabolomics studies [10,11] or polymers [12] and also plant extracts. It is very useful for understanding biological processes through the analysis of biofluids,
31
the search for biomarkers, or the study of molecular interactions for potential medical and in-vivo applications. In pharmaceutical studies, NMR spectroscopy is used to control pharmaceutical formulations, screen new compounds, and characterize mixtures to detect unwanted compounds to ensure safety and quality of the products. In environmental studies the technique is notably used to characterize contaminant and pollutants, while in food analysis it is used to for quality control and in particular authenticity and traceability [13 15]. Overall, NMR spectroscopy is often used to certify the composition of a mixture and identify new compounds.
The analysis of mixtures by NMR often relies on 1D methods, which are however rapidly limited by signal overlap. Switching to 2D experiments instead leads to remarkable improvements in this regard. There are also many methods that provide a virtual separation of compounds, based on properties of the molecules such as relaxation, diffusion, or coupling network. The identification of components is often assisted by databases, as well as automatic methods to deal with the large quantity of data that needs to be stored and processed. Current trends in the NMR analysis of mixtures include the quest for higher sensitivity and the reduction of the time required for advanced NMR experiments. Progress on the latter over the years originates from NMR instrumentation, pulse sequence and data processing developments [51], that lead to new powerful experiments [52] as well new sampling strategies.
It should also be noted that NMR spectroscopy is often used in combination with other methods, that have complementary features. For example, mass spectrometry gives information on molecular weight and atomic composition while NMR gives information on chemical surrounding, connectivity and spatial configuration.
2.2. Mixture analysis by one-dimensional NMR
The first step of any NMR spectroscopic analysis is usually to run a simple 1H 1D experiment. While
many nuclei give an NMR response, protons give the highest sensitivity thanks to their high natural abundance and gyromagnetic ratio. 1H 1D NMR is used in routine analysis with few parameters that
need to be optimized and a quick and easy execution that gives spectra, with current limit of detection in the micromolar range. 1H 1D spectra give information on the chemical environment of the nuclei via
chemical shift, bonding between nuclei via J-coupling / multiplicity of the signal whose intensity reflect the associated number of nuclei [17,18]. The standard 1H pulse acquire sequence is well known by
organic chemists and used to check the structure of compounds at the end of a synthesis for example. The accuracy of the information obtained with 1H 1D NMR depends strongly on the complexity
and purity of the sample. Unexpected compounds can modify the spectra and signal coming from the impurity can hide the signal of the compound of interest. It is also not easy to determine if signals belong to the same molecule or if they come from multiple species. In such cases, the experience of the analyst
32
together with NMR databases are useful. When the number of compounds to analyze increases within the sample of interest, 1D 1H spectra can be quite crowded and the analysis becomes trickier. The fact
that signals are spread over about 10 ppm only is unfavorable, compared to for example the ~200 ppm available for 13C analysis although the low natural abundance and gyromagnetic ratio of carbon-13
results in a 400 times lower sensitivity [17,18].
Overall, spectral overlap is a main limitation of 1D experiments for mixture analysis. In order to simplify the 1D spectrum of mixtures, spectral editing strategies based on either difference in relaxation times, molecular displacement or J-coupling network lead to selective observation of
components s and this helps with reducing the spectral overlap
that may hide the small signals present.
Figure 2: 400 MHz 1H NMR spectra of control human blood plasma with solvent water elimination and edited on
the basis of differences in diffusion coefficients: (a) normal spectrum with application of 10 % gradient strength, (b) spectrum with gradient application at 50 %, and (c) the difference between (a) and (b). Assignments are, L8, choline and glycerol protons of phospholipids; N+Me3, N-trimethyl group of choline in phospholipids; Me( -3), CH3 resonance from CH3 2 = containing fatty acids in lipoproteins. Reprinted with permission from [53]
Filtering the signals through relaxation properties leaves the spectra free from signals coming from molecules with high molecular weight, that have a short transverse relaxation time T2 [18,19]. The
33
editing of the spectra according to transverse relaxation properties [18]. The selective attenuation of signals from molecules with high molecular weight is useful when macromolecules signals dominate the spectra and hide smaller signals [4,19]. One interesting application of this filtering is found for the analysis of biological fluids such as plasma and blood, to remove signal from proteins and quantify low abundant analytes [53].
A complementary method to relaxation editing is to use diffusion weighting with pulsed field gradients (PFG) in one-dimensional experiments. Filtering the signals according to molecular diffusion properties now leaves the spectrum free from signals coming from molecules with low molecular weight [4,19,20]. This was successfully applied to studies on blood plasma, for biological applications and analysis of carbohydrate mixtures [53,56 58]. Another approach consists of subtracting two spectra acquired under different PFG strength, as illustrated in Figure 2. While this approach is not time-consuming, it required that that the observed species are well resolved in terms of size and molecular weight (MW).
Another filtering approach is 1D TOtal Correlation SpectroscopY (TOCSY), which provides a separation based on the J-coupling networks [21 23]. The purpose is to identify resonances generated by one spin system in a molecule. While there is no need of relaxation of diffusion differences in the sample, a spin multiplet need to be clearly isolated from the rest of the spectra. Also, this is a selective method that does not necessarily give access to the whole molecule, as one can only observe resonances within a given spin system. Applications of 1D TOCSY for separation of two isomers or analysis of seminal fluid have been reported [59,60]. Other applications include quantification in honey [22], balsamic vinegar [61], and urine for metabolic studies [62]. Other methods to address the issue of overlap in 1D NMR include the use of spectral deconvolution and spectral substraction [63]. Since multiplets patterns are also causing resolution issues with the 1D spectra, leading to some difficulties in signal assignment, homonuclear decoupling methods have been developed. Decoupling is usually obtained at the expense of sensitivity [64]. Solution to this issue is to extend the experiment to a second or third dimension (most effective method) [8].
2.3. Multidimensional NMR for mixture analysis
2.3.1. Principle of multidimensional experiments
When dealing with complex mixtures with a large number of compounds, we saw that the use of 1D experiments is complicated because signal overlap prevents the accurate identification and separation address the overlap problem is to increase the dimensionality of the experiment to two or more [8]. Signals are then spread over a larger domain and this can help to
34
distinguish between two or more signals that were overlapping in the 1D spectrum. Multidimensional experiments are generated by one or more incremented dimensions in addition to t
-dimension. For a 2D experiment, the so-called evolution time t1 is incremented in order to generate the
indirect dimension, following this scheme:
preparation----evolution (t1)----mixing----detection (t2)
where the preparation and mixing events are fixed elements of a pulse sequence, t1 is an incremented
parameter and t2 the acquisition time. The sequential repetition of this scheme gives a 2D data set S(t1,
t2). Fourier transformation in two dimensions then gives a 2D spectrum with rich structural and dynamic
information. This procedure can be extended to higher-dimensional experiments, where each indirect dimension is generated scan by scan. A variety of experiments are available and they may be sorted in homonuclear and heteronuclear experiments. These experiments and their relevance for mixture analysis will be presented in this section.
2.3.2. Homonuclear experiments
Homonuclear NMR experiments involve the same type of nucleus in both dimensions. One of the oldest multidimensional pulse sequence is the 1H 1H correlation spectroscopy (COSY) [65]. This experiment
unravels the connectivity between adjacent groups of protons that interact through J-couplings. This interaction gives rise to cross peaks in the spectrum located at the chemical shifts of the involved protons. Several variations of the COSY experiment are available such as double-quantum-filtered COSY (dqfCOSY), which is a phase-sensitive version that is very useful for mixtures when magnitude-mode COSY become two crowded. This experiment is routinely used for structural characterization of compounds, be they in a mixture or not [66]. It offers a significant separation of signals that are overlapped on the diagonal of the spectra.
The 2D version of the TOtal Correlation SpectroscopY (TOCSY) [67,68] experiment provides information of protons belonging to a given spin system in a molecule. This comes in addition to the information on directly coupled protons, thus giving a full description of the J-coupling network. TOCSY spectra tend to be trickier to analyze because of the difficulty to interpret cross peaks and because the spectra are more crowded than in COSY. Successful applications were nevertheless reported for mixture analysis with the study of insect venom [69], a chemical reaction mixture [70], a metabolic mixture [71] or amino acid mixtures [72].
Another way of simplifying spectra is to use 1H J-resolved (J-RES) NMR experiment that
35
be useful for the analysis of complex mixtures [74,75]; the projected version of this experiment (p-JRES) is also a possible approach to obtain homonuclear decoupled 1H 1D spectra.
Last but not least, diffusion-ordered spectroscopy (DOSY) is a powerful method to separate the NMR spectra of components within a mixture [24 27]. Their differentiation is based on the measurement of translational diffusion coefficients, which depend on molecular sizes and shapes. It is possible to differentiate compounds whose diffusion coefficients differ by less than 1 %. In the classic DOSY representation, the first dimension corresponds to the 1D NMR spectrum of the sample, and the second dimension corresponds to the diffusion coefficient D. As a result, all the peaks from a given molecule are aligned along the corresponding value of the diffusion coefficient. This experiment is very efficient to separate NMR spectra and is considered as a form of virtual chromatography. DOSY have been used for a large of applications in mixture analysis, such as the characterization of drugs as illustrated in Figure 3 [29], for polymer studies [32] and also for molecular weight determination [33,34].
Figure 3: 2D DOSY 1H NMR spectra in D
2O of tablets from (A) genuine Viagra and (B) the Syrian counterfeit
formulation13. (S) sildenafil; (*) hypromellose; ( ) triacetine; ( ) lactose; ( ) polyethylene glycol (PEG). TMPS (trimethylsilylpropane sulfonic acid) is the internal reference. Part B: a deeper section of the two signals of hypromellose is shown in a box. Reprinted with permission from [29]
36
2.3.3. Heteronuclear experiments
Heteronuclear NMR experiments involve different types of nuclei in the two dimensions. As 1H NMR
suffers from a small chemical shift range, resolution can be increased thanks to the larger chemical shift range of other nucleus, which helps to separate signals. Simultaneously this also gives precious information for structural elucidation. For example the Heteronuclear Single Quantum Coherence method (HSQC) [76] is often used to record 1H-13C, 1H-31P or 1H-15N correlation spectra, in which
protons are correlated to their directly bonded nuclei. The sensitivity of the experiment is also enhanced by a magnetization transfer from 1H to the X nucleus. This experiment is of great interest for identifying
compounds in a complex mixture. The resolution is significantly increased thanks to the wide chemical shift dispersion provided by the other nuclei (ex 13C) dimension. The Heteronuclear Multiple Bond
Coherence method (HMBC) [77,78] can be seen as an extension of the HSQC, where not only the signal arising from the correlation of protons and their directly bonded nuclei is visible, but additional signals corresponding to correlations over 2, 3 or 4 bonds. This experiment is however seldom applied towards mixture analysis. A third type of experiment is Heteronuclear Multiple Quantum Coherence (HMQC) [79], which gives the same correlations as HSQC, but involves a multiple-quantum evolution period. The use of this pulse sequence toward mixture analysis is questionable in the way that the J-coupling effect results in loss of spectral resolution due to peak broadening. This can make the component identification more complicated than necessary [80].
2.3.4. Combined methods
Many of the pulse sequences presented above can be combined in order to define 3D experiments and extract multiple pieces of information at the same time [81]. From the point of view of mixture analysis, the most powerful approaches are obtained with combined methods that edit 2D correlation experiments with respect to diffusion, relaxation and J-coupling. The approaches discussed in section 2.2 for 1D experiments can indeed be used to create multidimensional edited experiments. This gives rise to experiments such as DOSY COSY [28,29], DOSY TOCSY [30,31], DOSY HMQC [82], 2D-J-DOSY [83], COSY i2D-J-DOSY [84], constant-time-HSQC i2D-J-DOSY [85], DQF COSY i2D-J-DOSY [86] for the diffusion case, T2-edited COSY, TOCSY[53] and HSQC, and TOCSY-HMBC [87]. These experiments
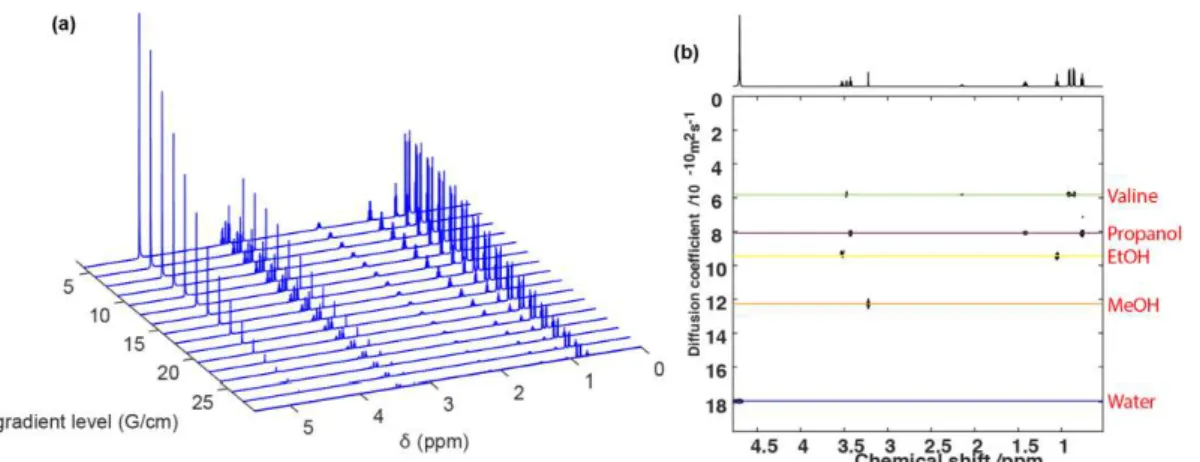
benefit at the same time from a simplification coming from differentiation in diffusion or relaxation but also from additional NMR information such a J-coupling and from the wider spectral range with heteronuclear experiments [19]. Figure 4 shows an example of DOSY-TOCSY on a mixture of methanol, ethanol, propanol, and valine.
37
Combinations are also possible between an NMR method and another analytical technique [88]. Such hyphenation between complementarity methods is a powerful way to analyze complex mixtures. NMR spectroscopy can for example be associated to liquid chromatography to perform mixture analysis in an online, single-shot run. The samples are pre-separated in the column and directly transferred to the spectrometer, which serves as a detector. This type of experiments were first used for plant extract analysis and also have proven to be efficient for the analysis of biofluids in real-time, high throughput screening (HTS) identification of metabolites in hypertensive rats, the analysis of carotenoid in food or the chemical profiling of marine sponge extract [2,18,89 93].
Figure 4: [Left] TOCSY spectrum of a mixture of methanol, ethanol, propanol, and valine. [Right] Sub TOCSY spectra from the 3D Hadamard- encoded DOSY-TOCSY experiment on the same mixture at (a) 1.32, (b) 1.05, (c) 0.89, and (d) 0.63 10-9 m2 s-1, corresponding to methanol, ethanol, propanol, and valine, respectively. These D
values equalled within 2 % those determined by conventional DOSY experiments. The 1D 1H spectrum is shown
at the top. Reprinted with permission from [31]
2.4. Limitations and perspectives of NMR towards mixture
analysis
Among the methods presented in this section we have chosen to work on diffusion-ordered spectroscopy, a virtual chromatography experiment. Since it was introduced in 1992, DOSY has led to applications in many areas of research, and it still has a large potential for further developments and applications. DOSY shares the inherent drawback of multidimensional experiments, which is a duration that increases with the dimensionality of the experiment. Several hours and sometimes days may be required for the acquisition of a single spectrum. Sensitivity is also an intrinsic drawback of NMR as only a small fraction of the nuclear spins is effectively available for detection by the spectrometer,
38
according to the Boltzmann population of energy levels. The range of application of DOSY would expand with an increased speed and sensitivity.
An example of area that would benefit from new developments of DOSY is the analysis of counterfeit drugs. Nowadays, the need for full analysis and characterization of mixtures, the regulation toward impurities in product stress the needs for sensitive methods that can give a complete information on a sample without omitting even the smallest compounds. For example, many efforts are made for limiting frauds in the pharmaceutical industry. Mass spectrometry is a widespread technique in quality control laboratories but not all components survive the rough conditions of the detection. Sometimes it is more interesting to observe a sample in its raw state without modification and NMR can comply with this constraint.
Another area of application is the monitoring of experiments, to fully characterize a reaction mixture while it is evolving. Reaction mixtures are a particular case of mixtures that are constantly changing, and this dynamic behavior can be hard to follow without an in-situ method of analysis. This also applies to unstable compounds that degrade fast, or to the formation of metabolized products in vivo. Faster experiments are needed to follow evolving mixtures, but sensitivity is also required to detect low concentrated compounds, especially in in-vivo/biological applications. For these reasons, several fast-multidimensional NMR methods are being developed for the analysis of mixtures. In the following, several fast-analytical NMR methods will be described with a focus on DOSY experiments.
39
3. Diffusion NMR methods for spectral separation of small
molecules mixtures
Diffusion-ordered spectroscopy (DOSY) is a powerful method to separate the NMR spectra of components within a mixture [94 101]. Their differentiation is based on the measurement of translational diffusion coefficients, which are linked to the molecules size and shape [102], and with ideal conditions it is possible to differentiate compounds whose diffusion coefficients differ by less than 1 %.
3.1. Translational diffusion
Molecules in solution undergo a translational motion with random reorientations called diffusion. The diffusion behavior depends on many parameters such as temperature, the size of molecules and viscosity, and is quantified with the translational diffusion coefficient, often noted D. For large molecules of spherical shape, the diffusion coefficient is given by the Stokes Einstein equation
where kB T is the temperature, r the hydrodynamic radius of the molecule
and is the viscosity of the solution. This implies that molecules with high molecular weight will diffuse more slowly than molecules with low molecular weight.
3.2. Diffusion encoding with pulsed field gradients
Diffusion NMR pulse sequences rely on a pair of pulsed field gradients (PFG) separated by a long delay so that translational diffusion has an effect on the detected signal intensity [103]. When using an increasing range of gradient strength, the observed signal is found to decrease exponentially and can be modeled with the so-called Stejskal-Tanner equation (see below equation 3.5) to extract the diffusion coefficient for each peak in the spectrum.
3.2.1. Gradient pulse description
High-resolution NMR spectroscopy experiments are carried out in a static magnetic field B0 that is
40
disruption of this homogeneity can be exploited to manipulate the magnetization over a short duration .
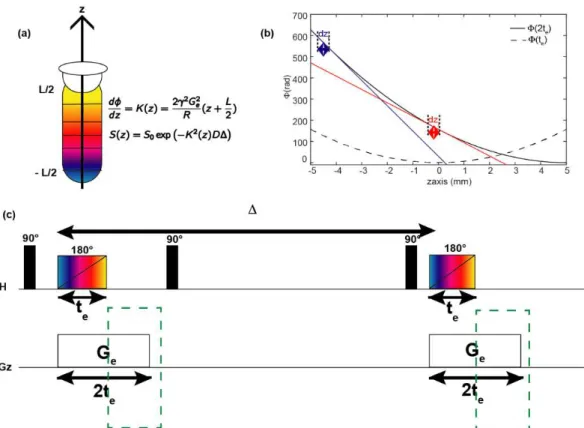
Figure 5: Effect of a magnetic field gradient on the NMR spectrum. (a) Sample in a homogeneous magnetic field and magnetization helix during acquisition. The spectrum is a peak with a narrow line. (b) Sample in a linear magnetic field and magnetization helix during acquisition. The spectrum is a broad peak corresponding to the image of the observed region of sample.
In particular, a magnetic field gradient G, which is a linear variation of the longitudinal component of the magnetic field, can be induced by a dedicated coil in the NMR probe [104]. The result is an overall field of the form:
where z corresponds to the spatial coordinate of the spins along the B0 axis as shown in Figure 5b. Spins
with a gyromagnetic ratio will then have a precession frequency
that is related to their position in the sample. As a result, the phase (z) acquired during the gradient pulse of duration will also be spatially dependent:
The effect of a gradient pulse can be visualized by considering that the sample is divided in several slices along the z-axis, with each slice possessing its own phase, precession frequency and magnetization vector. Since a pulsed field gradient results in position-dependent precession frequency, the transverse magnetization will acquire an helix pattern represented in Figure 5b [95,105,106]. After a PFG of sufficiently large area, the magnetization vectors cancel each other and the total observable signal is zero. This is in contrast to the case shown in Figure 5a, where Bz=B0 and all magnetization vectors are
aligned since they have the same precession frequency, thus leading to full signal observation. Magnetic-field gradients are also central for imaging experiments [107] . When applied during acquisition, they
41
contribution of each part of the sample. Figure 5 illustrates the case of a sample with a single chemical-shift offset; cases with several chemical-chemical-shift offsets will be discussed later.
A variety of gradient-pulse usages are found in NMR experiments, depending on the desired effect on the magnetization. PFGs are also combined with radio-frequency pulses in some pulse sequence elements. Frequently encountered blocks offer the possibility to perform coherence selection with little to no phase cycling, study molecular diffusion, remove artefactual signals, perform selective excitation or perform imaging experiments [108,109].
3.2.2. Spin echo experiment
The first diffusion experiment was based on a spin echo (SE) as illustrated in Figure 6. In the SE on in the xy plane then the application of a gradient
pulse unwinds the helix to form an echo that gives an observable signal. Spin-echo based diffusion NMR is however limited because of the effect of transverse relaxation during the diffusion delay, as well as J modulation that causes peak distortion. Although strategies have been introduced to mitigate the effect of J modulation, spin-echo based methods are usually not the preferred implementation of diffusion NMR [110 112].
Figure 6: Conventional DOSY Spin Echo (SE) pulse sequence.
3.2.3. Stimulated echo experiment
In order to reduce the deleterious effects of J modulation and transverse relaxation, a stimulated
echo-based experiment (STE) inv Figure 7, is used instead of the simple
42
acquired phase to be of the form given in equation (3.4) The y-component of the magnetization is then
stored along z- the x component remains in the transverse
plane and is suppressed with phase cycling or a spoiler gradient. As a result, the phase modulation is converted into an amplitude modulation. The magnetization is returned into the transverse plane by the third 9
the same (anti-echo) or an opposite sign (echo). This results in an observable signal, which is attenuated because of the displacement that occurs during the delay .
Longitudinal storage reduces the effect of J modulation. In addition, the magnetization to be subjected to longitudinal rather than transverse relaxation; as T1 is typically significantly greater than
T2, longer diffusion delays can be used than in SE experiments. Only 50 % of the total signal is
observable but it is the price to pay in order to get a spectrum with small artifacts.
Other phenomena that affect the diffusion data includes eddy currents and convection. The use of a longitudinal eddy current delay can help with minimizing the problem of eddy currents [28].
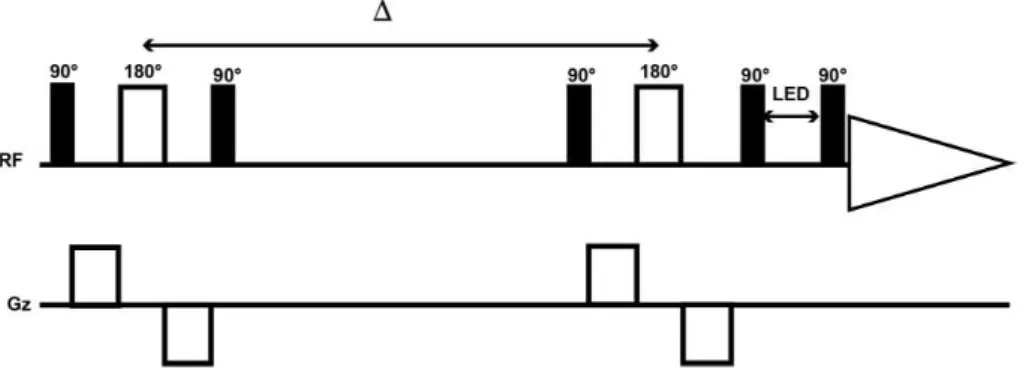
Figure 7: Conventional DOSY Stimulated Echo (STE) pulse sequence that includes bipolar gradient pulses and longitudinal eddy current delay.
3.2.4. Oneshot experiment
Most applications of DOSY rely on a STE pulse sequence using bipolar gradient pulses, and between 8 to 16 gradient increments are typically used to get a well-described diffusion curve. In addition, 8 scans or more are needed for each gradient increment, for the coherence transfer pathway (CTP) selection through phase cycling. This extensive phase cycling increases further the duration of the experiment even if it contributes to the good quality of acquired data. The Oneshot pulse sequence shown in Figure 8 offers a solution to avoid using such phase cycling while maintaining the quality of the DOSY spectra. Phase cycling is supplemented
pulse pair stimulated echo (BPPSTE) pulse sequence [109,113]. This imbalance suppresses the non-transfer pathway
43
(CTP). Additional balancing gradient pulses are also used for maintaining lock signal stability. The Oneshot pulse sequence provides accurate diffusion measurements by using a single scan instead of sixteen per gradient increment although 4 scans may be used for clean results. The Stejskal-Tanner equation needs to be modified to take into account the effect of the coherence selection gradient on the diffusion attenuation.
Figure 8: Radiofrequency (RF) and gradient (G) pulse sequences for DOSY. (a) Bipolar pulse pair stimulated echo (BPPSTE) sequence; (b) the proposed one-shot sequence using (solid line) the stimulated antiecho and (dotted line) the stimulated echo. The diffusion delay is the time between the midpoints of the two encoding periods and that between the midpoints of the antiphase field gradient pulses within a given diffusion-encoding period. The outward/inward facing arrows indicate gradient pulses which are incremented/decremented as the diffusion weighting is changed. The gradient prepulses in (b) are most conveniently given a duration of 2 . Reprinted with permission from [113]
3.3. Diffusion coefficient determination
DOSY data are generated via incrementation of the gradient pulse area over a series of scans, so that the detected signal is made dependent on both the gradient area and the diffusion rate. Either the intensity, G, or the duration, , of the gradient is increased. After Fourier transformation, each spectrum generated for one gradient level is attenuated to some extent. The attenuation shows an exponential behavior as a function of the gradient area and each resonance will have its own decay rate. The signal attenuation can be expressed by the Stejskal-Tanner equation
44
where S0 is the initial amplitude of the signal, D is the diffusion coefficient, G is the gradient intensity,
is the gyromagnetic ratio for the appropriate nucleus, the gradient duration and the diffusion delay, corrected to take into account the finite nature of the gradient pulses [114]. Monoexponential fitting of the decaying signal for each peak to the Stejskal-Tanner equation yields the associated diffusion coefficient D. Resonances can then be sorted according to the value of the diffusion coefficient.
Diffusion-encoding experiments can be prepended or appended to many nD spectroscopic experiments. Appropriate data processing then gives a (n+1)D spectrum with n chemical shift axes and an additional diffusion axis. In a classic 2D DOSY display, the first dimension corresponds to the 1D NMR spectrum of the sample and the second dimension corresponds to the diffusion coefficient; peaks from the same molecule are aligned along the corresponding value of the diffusion coefficient
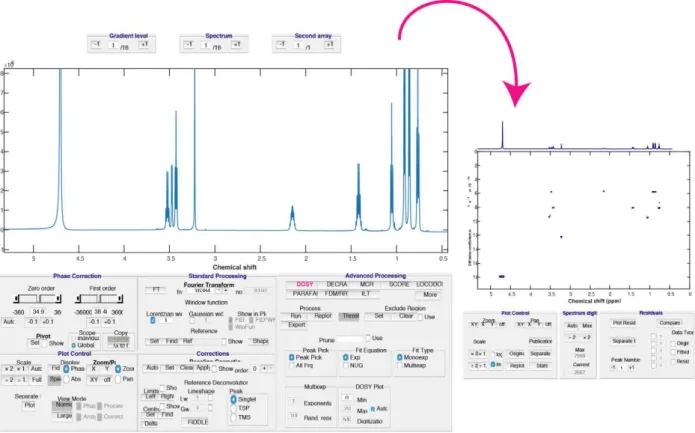
Data processing methods for DOSY can be sorted between univariate and multivariate methods, with many of them implemented in the open DOSYToolbox, recently extended to GNAT, which greatly facilitates the analysis of DOSY data as illustrated in Figure 9 [51,115 128].
Figure 9: DOSYToolbox view to illustrate the processing of DOSY data.
Applications of the DOSY experiment are found in polymer determination of molecular weight [32 34,129 132], in a quantitative manner to quantify sucrose in beverage [133], study of reactive metal complexes [134 136], study of chemical intermediates [137], ligand identification [138] or determining chemical exchange rate [139].
45
3.4. Typical issues with DOSY data and how to resolve them
3.4.1. Signal overlap
DOSY data need to be acquired with the highest sensitivity and spectral resolution as possible [105,140]. The separation of compounds in the diffusion dimension depends strongly on resolution. Indeed, diffusion measurement is based on signal decay of resonances in the spectrum. In the ideal situation, the resonances are completely resolved in the spectrum and one can consider that each resonance arise from a given compound. Mono-exponential fitting of e
calculated diffusion coefficients should be the same for all resonances arising from a single molecule. For very crowded mixtures, signal overlap will be an issue as it will decrease the accuracy of diffusion coefficient calculations. In this case, resonances coming from two or more compounds can be completely or partially superimposed in the spectral dimension. It entails that the decay of theses resonances can no longer be assigned to a single compound and the
mono-an accurate value but mono-an average value of the real diffusion coefficient. This cmono-an lead to erroneous assignments of signal and a complicated DOSY display. Multi-exponential fitting can be a solution but it is only able to separate diffusion coefficients when they differ by more than 30 % [141,142], while advanced data processing can also be used [143,144] to reduce overlap or improve the separation of overlapped peaks. When spectral resolution is not sufficient with 1D NMR, using an additional dimension is another option, which however results in a longer experimental time [31,84,145 150].
Another issue is found when components are close in shape, size, molecular weight such as isomers so it can be useful to add some complementary compounds that will interact specifically with one component to help the separation. It is a sort of forced/artificial difference between molecules. Matrix assisted DOSY (MAD) relies on this principle and it has been exploited in order to distinguish between flavonoids that have similar structures [151 153]. The solvent also have an effect, which was found to help in the separation of isomers as suggested by Tessari in this study of DOSY in MeOD [154], while the use of lanthanide shift reagents was shown to increase resolution in both the spectral and the diffusion dimension [155].
46
Figure 10: Fig. 2 (a) DOSY presentation of an equimolar mixture of toluene, benzyl alcohol and tetraethylene glycol in D2O. (b) Shows the same mixture in the presence of 150 mM SDS. Reprinted with permission from Morris
et al., Anal. Chem., 66 (1994) 211 215. Copyright 1994 American Chemical Society
3.4.2. Eddy currents
Eddy current originates from rapid changes in magnetic field and they depend on the gradient pulse strength. They will induce lineshape distortions, artefacts, shifts in the main magnetic field and basically everything that can ruin your experiment, especially when using many gradients pulses which is the case for DOSY [156]. Reducing the impact of eddy currents can be done by mean of RF and gradient coil design, e.g., with shaped gradient pulses that have smooth on/off switching rate, using bipolar gradient pulses or the use of a LED delay at the end of the pulse sequence to let the eddy current vanish (the magnetiz
pulse for acquisition).
3.4.3. Convection caused by temperature gradients
Temperature gradients through the sample induce convection currents, which are a serious disturbance that affects diffusion measurements [157 161]. The two main forms of convection known are the Rayleigh- rnard one and the Hadley flow [162]. The first form occurs when vertical temperature gradients are present, that is to say when the hotter part on the liquid moves upward while the cooler part is moving in the opposite direction. The second form occurs when transverse temperature gradients
47
are present. The former is present above a certain threshold that is defined according to the sample geometry, the viscosity and thermal properties of the liquid. The latter does not depend on a critical value and tends to be present in all typical liquid state NMR experiment. Temperature gradients are basically unavoidable and they come from multiple sources such as radiofrequency heating, differential heating of the outside of the probe by shim coils, but the greatest culprit of gradient temperature is the gas flow used to control the sample temperature. For this reason, temperature gradients need to be reduced as much a possible because convection can lead to significant loss of signal and overestimated diffusion coefficient values since the signal appears to decay faster than it should.
Figure 11:Echo signal attenuation as a function of the gradient strength G2 for (+) a simple Stejskal-Tanner
diffusion experiment on a sample of 0.06% polypropylene in tetratchloroethan-d2 a 320K and (o) using a
convection compensated DSTE experiment. Reprinted with permission from [163] Press.
Two perspectives against convection issue can be explored [164]. The first is related to experimental conditions adjustment. It has been shown that either reducing the NMR tube diameter, increasing the gas flow to make temperature more uniform, restraining the sample volume with Shigemi tubes or spinning the sample results in decreased convection effect.
The second approach to deal with convection is to make use of pulse sequences that are specifically designed to compensate for the convective flow as long as this flow is considered laminar during the diffusion period of the experiment [165]. In practice, as proposed by Jerschow and Muller [166,167], the diffusion weighting proceeds in two symmetrical steps rather than a single one. Since convection motion causes further phase shift of the magnetization on top of the one induced by the random Brownian motion we seek to evaluate, the aim is to impart opposite convection-induced phase shift in each half of the pulse sequence that will cancel each other out. Compensation of the velocity induced phase term is obtained in a way that the diffusion effect is cumulative at the end of the pulse
48
sequence. The convection compensative ability however comes at the expense of sensitivity since each STE part induce 50 % of signal loss.
3.4.4. Gradient field non-linearity
It appears that sources of error are everywhere and threaten the successful completion of the DOSY experiment. An insidious enemy is the gradient pulse itself which is key to measure diffusion coefficient but it is necessary to keep in mind that a gradient pulse is far away from being perfect [168]. It is a
-uniformity especially on the edges. To deal with this non-linearity it is possible to map the position dependent gradient strength [164,169]. Another approach consists in using a restricted sample volume, e.g., with a Shigemi tube, to record data from a region over which the gradient has a more uniform value.
Figure 12: Results from the Stejskal Tanner experiment using a gradient during the acquisition from a Varian standard doped water sample (1 % H2O in D2O 1 mg/ml GdCl3 ) at 600 MHz. The slope of the profile is steepest
in the middle of the sample where the gradient is the strongest. The current through the gradient coil was arrayed in 60 steps between 0 and circa 10 A. Reprinted with permission from[169]
All rights of reproduction in any form reserved.
3.5. Conclusions
From this analysis of the literature, we can see that the DOSY NMR methods was applied in many fields for mixture analysis. The main feature underlying the DOSY experiment were presented and this will serve as a basis to understand where we can modify the experiment in order to accelerate it. Various schemes were presented and will be also evaluated in order to create fast DOSY experiment. Several sources of errors were presented and it is important that we keep them in mind because chances are high that we may be confronted with them all along the project. We know the ways of correcting for these sources of errors and we will see if they are compatible with fast DOSY experiments.
50
4. Acceleration strategies for DOSY
Pulsed field gradient NMR is frequently used to characterize the translational motion of molecules in solution [114]. As explained in section 3, this methodology relies on a gradient incremented scheme in order to induce a diffusion-weighted signal. The recording of multiples gradient increments (at least 5 for relatively simple mixtures) over time results in a long acquisition duration, which can be detrimental for rapidly changing samples. Various strategies have been proposed to reduce the duration of diffusion experiments [35]. These approaches may be divided into different categories depending on the encoding strategy used. Here we consider three types of methods that reduce the number of required scans to one, based on multiple gradients pulses, on multiple RF pulses, and on spatial encoding. We also describe other strategies, which require multiple scans but still provide a significant reduction of the duration of DOSY experiments.
4.1. Multiple echoes induced by trains of gradients pulses
Efforts to accelerate the traditional PFG NMR experiment, which relies on a series of scans with incremented diffusion weighting, started with experiments that record series of diffusion modulated echoes in a single transient, using trains of gradient pulses.
Figure 13: CPMG-based PGSE methods for measuring D in a single multiple-echo transient. A, the PGMSE method [170]; and B, the method of Chandrakumar et al [171]. For A the gradient amplitude is increased systematically, while for B it is constant. Reprinted with permission from [35] s
Pulsed field-gradient multiple spin-echo (PGMSE) [170] and fast multi-spin-echo diffusion sequences (FAMOUS) [171] both derive from the Carr-Purcell-Meiboom-Gill (CPMG) experiment as shown in Figure 13. In the case of PGMSE, the amplitude of the gradient pulse pair is incremented from one echo to another. Diffusion coefficients are extracted from the amplitude ratio between two successive echoes, plotted against the gradient area. In the case of FAMOUS, the amplitude of the gradient pulse pair is
51
kept constant, and diffusion results in an additional line broadening of the peak obtained after Fourier transform of the signal sampled at the top of the echoes. This implies that two experiments need to be recorded, with and without diffusion encoding, to separate the contribution of relaxation and diffusion. These methods are designed for a single resonance and can be combined with a spectrally selective excitation pulse [171].
Figure 14: The proposed Difftrain pulse sequence, schematic (upper) and detailed (lower). ta is the acquisition
time and is the diffusion delay. In the implementation of the Difftrain experiment, the same phase cycle as in previous BPPSTE implementations was used. Reprinted with permission from [172]
Academic Press
The Difftrain pulse sequence, illustrated in Figure 14, is based on a stimulated echo and performs
Multiple decoding steps are then carried out in a single scan, with the repetition of a block consisting of a small-tip-angle pulse followed by a bipolar gradient and signal acquisition [172]. Each block provides an echo signal, acquired with a diffusion time that increases from one echo to the next. After each echo, a spoiler is used to diphase any remaining transverse magnetization. As the decay of the signal is impacted by diffusion but also impacted by loss due to T1, it is necessary to record two transients with
and without diffusion gradient on. The Difftrain approach conserves chemical shift information and can in principle be used for high-resolution DOSY, although reported applications concern the analysis of unstable heterogeneous systems
Fast diffusion experiments can also be performed by measuring with a train of bipolar gradients,
are refocused in the middle of the train [173]. Chemical-shift resolution is preserved to some extent, and again transverse relaxation has to be taken into account in the analysis.
52
To the best of our knowledge, the presented methods have not been used for applications in mixture analysis. Other applications include the use of PGMSE was used to analyse hydrated collagen [174], measurements of time dependent diffusion of laser polarized xenon gas [175] and imaging experiments [176]. These methods also have potential applications for the evaluation of macroscopic motion and the measurement of anisotropic diffusion effects, especially for in vivo applications [170]. FAMOUS was used for intercluster interaction [177] and the study of lyotropic system [178], while Difftrain was used to characterise thermodynamically unstable oil-water emulsions [179].
4.2. Multiple echoes induced by trains of RF pulses
Another family of pulse sequences relies on a train of RF pulses to generate a large number of echoes with different degrees of diffusion weighting. The DANTE (Delays Alternating with Nutations for Tailored Excitation) block, which is a selective excitation scheme, is the foundation of theses pulse sequences [180,181]. It consists in a series of low flip-angle RF pulses and is combined with a constant gradient pulse in order to induce a train of echoes. This type of RF pulse train was employed for diffusion measurement with the BURST pulse sequence shown in Figure 15 even though it was initially made for imaging experiments [182]. The acquisition is performed under a read gradient to unravel the echoes generated by the RF pulses
Figure 15: Pulse-sequence diagram describing the basic spin-echo Burst pulse sequence used for measuring diffusion coefficients. A read gradient is switched on and the sample excited by means of a train of very low es. The 180 pulse and the second gradient refocus a series of echoes, one corresponding to each pulse, and the delays are arranged so that the spin and gradient echoes coincide. Reprinted with permission from [182]
The DANTE-STE [183] sequence of Figure 16 was used for diffusion measurements of laser polarized 3He and 129Xe gas and the difference with the BURST previously described is found within 2 effect and within the acquisition part were pulses
53
Figure 16: Pulse sequence and k-space trajectories. The principle pathways in bold are the only ones to survive in the small flip angle limit and form echoes following the readout pulse. Using this sequence, the full diffusive behavior of a sample can be read out in a single shot provided there is sufficient SNR. Reprinted with permission from [183]
The Multiple Modulation Multiple Echoes (MMME) [184] represented in Figure 17 also exploits a train of RF pulses but this time with varying tip angles. The gradient is maintained during the whole pulse sequence, and this generates several coherence pathways that are used to calculate diffusion coefficient. The MMME sequence has been applied for diffusion measurement in several direction at the same time, to characterise anisotropic systems [185].
Figure 17: MMME4 pulse sequence [184] used to measure D in a single transient. Reprinted with permission from [35]
In these methods, as the gradient is turned on during the whole pulse sequence, hardware constraints set the maximum duration of the experiment and the gradient strength used. Also, the use of small-tip-angle pulses results in a low sensitivity. Notably, BURST and
DANTE-for accurate measurement of diffusion coefficients. Since these methods do not provide spectral resolution, few applications to the analysis of mixtures have been reported.