HAL Id: hal-02198118
https://hal.archives-ouvertes.fr/hal-02198118
Submitted on 30 Jul 2019
HAL is a multi-disciplinary open access
archive for the deposit and dissemination of sci-entific research documents, whether they are pub-lished or not. The documents may come from teaching and research institutions in France or abroad, or from public or private research centers.
L’archive ouverte pluridisciplinaire HAL, est destinée au dépôt et à la diffusion de documents scientifiques de niveau recherche, publiés ou non, émanant des établissements d’enseignement et de recherche français ou étrangers, des laboratoires publics ou privés.
Risk and refugee migration
Géraldine Bocquého, Marc Deschamps, Jenny Helstroffer, Julien Jacob,
Majlinda Joxhe
To cite this version:
Géraldine Bocquého, Marc Deschamps, Jenny Helstroffer, Julien Jacob, Majlinda Joxhe. Risk and refugee migration. [University works] Inconnu. 2018, 40 p. �hal-02198118�
The Risk and Refugee Migration
Géraldine Bocquého
Marc Deschamps
Jenny Helstroffer
Julien Jacob
Majlinda Joxhe
EDITORIAL BOARD
Chair: Xavier Ragot (Sciences Po, OFCE)
Members: Jérôme Creel (Sciences Po, OFCE), Eric Heyer (Sciences Po, OFCE), Lionel Nesta
(Université Nice Sophia Antipolis), Xavier Timbeau (Sciences Po, OFCE)
CONTACT US
OFCE
10 place de Catalogne | 75014 Paris | France Tél. +33 1 44 18 54 87
www.ofce.fr
WORKING PAPER CITATION
This Working Paper:
Géraldine Bocqueho, Marc Deschamps, Jenny Helstroffer, Julien Jacob and Majlinda Joxhe
Risk and Refugee Migration,
Sciences Po OFCE Working Paper, n° 10, 2018-03-12
Downloaded from URL : www.ofce.sciences-po.fr/pdf/dtravail/WP2018-10.pdf DOI - ISSN
ABOUT THE AUTHORS
Géraldine Bocquého Université de Lorraine, AgroParisTech-INRA, BETA
Email Address: [email protected]
Marc Deschamps, Université de Bourgogne Franche-Comté, CRESE and OFCE-Sciences Po
Email Address: [email protected]
Jenny Helstroffer, University of Lorraine, CNRS, BETA
Corresponding author Email Address: jenny.helstroffer@univ- lorraine.fr
Julien Jacob,University of Lorraine, CNRS, BETA
Email Address: [email protected]
Majlinda Joxhe, CREA, University of Luxembourg
Email Address: [email protected]
ABSTRACT
This paper uses the experimental setup of Tanaka et al. (2010) to measure refugees’ risk preferences. A sample of 206 asylum seekers was interviewed in 2017-18 in Luxembourg. Contrary to studies which focus on risk aversion in general, we analyze its components using a cumulative prospect theory (CPT) frame-work. We show that refugees exhibit particularly low levels of risk aversion compared to other populations and that CPT provides a better fit for modelling risk attitudes. Moreover, we include randomised temporary treatments provoking emotions and find a small significant impact on probability distortion. Robustness of the Tanaka et al. (2010) experimental framework is confirmed by including treatments regarding the embedding effect. Finally, we propose a theoretical model of refugee migration that integrates the insights from our experimental outcomes regarding the functional form of refugees’ decision under risk and the estimated parameter values. The model is then simulated using the data from our study.
KEY WORDS
Refugee migration, risk preferences, experimental economics, cumulative prospect theory, psychological priming
JEL
1 Introduction *
In the continuing refugee crisis, thousands of individuals needing to flee their country face choices between different routes and destinations. Some Middle Eastern refugees decide to stay in the region, some to head for the European Union via the Balkans, other head for Libya in order to cross the Mediterranean via the central Mediterranean route. Both routes are perilous, and many refugees have perished along them.1 Not fleeing is no less dangerous.2
If policy makers are to find a solution to the refugee crisis, they need to know how people make choices in risky situations. For example, in order to design a system of distribution of refugees to destination countries3 it is necessary to be able to predict its consequences on refugees’ choices. How do we know that refugees will indeed let themselves be moved to a country that is safe, but that does not provide them with the best perspectives? Are many refugees willing to accept greater risk in order to reach a country in which they estimate to be able to lead a better life? In other words, what is it that determines refugees’ migration choices: Is it trying to avoid the highest losses or focussing on the option with the highest gains? Are risks perceived accurately? To answer these questions requires studying their risk preferences.
Risk preferences have been studied for different types of populations. Various frameworks are available and more recent ones account for psychological biases in decision making, like giving different weightings to gains and to losses, to extreme outcomes or to different levels of probability. Further, research has shown that while these weightings vary accross individuals4, some similar traits can be found according to the individuals’ characteristics, such as their country of origin or whether they are migrants.5 It is therefore inaccurate to infer the risk preferences of one population from those calculated for another.
In this paper, we aim to enrich the existing literature on risk preferences, migration and refugees by testing the risk preferences of a previously unstudied population, refugees, defined as persons fleeing armed conflict or persecution.6 We find that their risk preferences have characteristics that clearly distinguish them from other populations found in the literature: refugees are shown to be less loss averse, to distort probabilities less and to put a higher weight on very good outcomes in their decision- making process.
We gathered information about the migration decisions of refugees by eliciting risk
1The UNHCR (www.unhcr.org) estimates the total number of persons dead and missing in the
Mediterranean 2014 - 2017 at 15 500, about 1 % of the persons who attempted the crossing. Between January and September 2016, 421 persons died or went missing on the Eastern Mediterranean Route, and 3,074 on the Central Mediterranean Route.
2According to Reuters, by March 2017 465,000 persons were killed or missing in Syria’s civil war
(www.reuters.com, March 13, 2017, ”Syrian war monitor says 465,000 killed in six years of fighting”). This number corresponds to 2.5 % of the total civilian population.
3See for example Delacre´ taz et al. (2016); Ferna´ ndez-Huertas Moraga & Rapoport (2015). 4See for example Guiso & Paiella (2004); Williams & Bala´ zˇ (2014).
5For example, Hsee & Weber (1999) find significant differences in cross-national risk preferences. For a review
of demographic differences, see Holt & Laury (2014). For a review of migration and risk, see section 2.1.
6This is the definition used by the UNHCR. The legal definition distinguishes between asylum seek- ers
(persons who have applied for the recognition of refugee status) and recognized refugees (persons who have obtained this status). We employ the broader UNHCR definition. For a discussion of the notion of refugee, see Dustmann et al. (2017a).
* This research project was financed by the FEDER and the Region Grand Est (France). We are par- ticularly grateful to Giuseppe Attanasi, Gary Charness and the participants of the Spring Workshop on Experimental Economics in Strasbourg June 2016 and of the Workshop on Recent Developments in Migration Issues in Nancy November 2017. A special thank goes to Ragab Mohamed.
preferences from 206 refugees in Luxembourg in 2017-2018. Risk attitudes were ob-served using the protocol developed in Tanaka et al. (2010). The influence of emotional recollections of fear on the results is studied using the psychological priming protocol developed in Callen et al. (2014) and found to have a relevant impact on probability distortion. We further test the robustness of Tanaka et al. (2010)’s experimental de-sign by including variations in the framing of lotteries. We study whether excluding particularly high or low payoffs has an impact on the decisions taken by subjects and therefore on the estimation of their risk parameters. On average, we find no significant differences between treatments, thus consolidating the robustness of the Tanaka et al. (2010) experimental results.
Based on the experimental insights of the advantages of cumulative prospect the-ory, we introduce the latter into a theoretical model of refugee migration. To our knowledge, we are the first to do so. This model allows us to identify threshold values for different parameters determining the migration of refugees to Western countries. A numerical simulation of the model, based on the socio-demographic information and the risk parameter values gathered in our empirical study is proposed.
In what follows, we will situate our contribution within the literature (section 2), explain the experimental design (section 3), present the results of the baseline sample (section 4) and of the treatments (section 5). The theoretical model of refugee migra-tion and a numerical simulamigra-tion of the model is presented in secmigra-tion 6.4.2. Secmigra-tion 7 concludes.
2
Contribution and related literature
2.1
Risk attitudes of migrants
Asylum seekers are forced migrants who have applied for refugee status in a foreign country. Most studies show that migrants are less risk averse than other populations.7 As suggested by Umblijs (2012), migration may be a process of self-selection in which the least risk averse individuals migrate.
However, some authors show that there is not necessarily a difference between the degrees of risk aversion of migrants and non-migrants, or even that migrants may be more risk averse.8 As a consequence, it is not possible to generally assume low levels of risk aversion among refugees. Rather, an empirical foundation for such an assumption is necessary.
Further, refugees may not share risk attitudes of other types of migrants. They are forced migrants: leaving their homes does not result from choice, but from ne-cessity.9 The lack of choice of whether to migrate or not undermines the process of self-selection. As a consequence, refugees’ risk behaviour may well be very different from other migrants. However, this is not necessarily the case, because refugees may make choices in which they self-select according to their risk preferences at a later stage of their migration, for example when determining their country of destination.
2.2
Risk attitudes and the experience of traumatising events
Another characteristic that may be significant in distinguishing refugees from other migrants is the experience of traumatising events. Experimental studies since Lerner & Keltner (2001) show that trauma and conflict may alter risk choices and preferences. The experiences of psychological trauma that have been found in the literature to have an affect on risk aversion can take various forms: it can be of natural origin or man-made, experienced personnally or in the vicinity. The sign of the changes in risk attitudes of persons having suffered from trauma differs between studies.10
Callen et al. (2014) use experimental primers to trigger the recollection of traumatic experiences, asking persons to recollect happy, fearful or neutral memories before be-ing tested. In their study based in Afghanistan, they find that both recent violence and its recollection increase individuals preference for certainty.
As a consequence, while migrants may or may not be more risk-seeking than other populations, refugees’ experience of violence may change their attitude, either exac-erbating the risk-seeking behaviour or diminishing it. A priori, predictions of refugees’ risk attitudes are therefore hardly possible. Since refugees’ behaviour when confronted
7See Akg ¨uc¸ et al. (2016); Bonin et al. (2009); Dustmann et al. (2017b); Gibson & McKenzie (2011);
Jaeger et al. (2010).
8For a literature review on the question, see Hao et al. (2014). 9See for example Schmeidl (1997).
10For example, Eckel et al. (2009) and Voors et al. (2012) show that the experience of trauma may
lead to risk-seeking behaviour, while for Li et al. (2011) the risk-seeking behaviour occurs only in the gain domain, and there is an opposite effect in the loss domain. Kim & Lee (2014) find that persons who experienced the Korean war in their childhood were more risk averse than other generations. Psychological studies (e.g. Lerner et al. (2003) on the effect of 9/11) agree that fear correlates with choices consistent with risk aversion.
with risk is essential to understanding their migration process, this study aims to pro-vide empirical data on refugees’ risk attitudes.
2.3
Experimental approach
The existing literature on migrants’ risk attitudes consists mainly of the analysis of surveys including a non incentive-compatible question on how a person considers his risk attitude.11 To our knowledge, no such survey exists for asylum seekers.12
Our use of the experimental approach is also founded on the inherent advan-tages of experiments, which avoid difficulties such as reverse causality and multifactor causes (risk perceptions, social norms, absence of incentives etc.) which are common to studies using household surveys. For example, if we observed risky migration choices when lower risk options were possible, is this because migrants have a preference for risk? Or did they found their decision on erroneous perceptions of probabilities and outcomes, thinking they were chosing the safer option?13
Experiments based on the setup developed in Fox & Tversky (1995) were applied by Balaz & Williams (2011) and Hao et al. (2014), who find little evidence in favour of increased risk tolerance of migrants. Voors et al. (2012) use a similar experimental setup in Burundi and find that individuals who have experienced violence directly or indirectly are more risk-seeking than others.
The experimental approach has the further advantage of providing more detailed insight into individuals’ decision making under risk. While the aforementioned stud-ies focus on risk aversion generally, the experimental design by Tanaka et al. (2010) (hereafter TCN) involves parameters distinguishing between probability distortion, loss aversion and the marginally decreasing utility in the cumulative prospect theory framework.
Prospect theory, developed in Kahneman & Tversky (1979) and Tversky & Kahne-man (1992) has been shown by Czaika (2015) to be a good fit for explaining GerKahne-man migration flow data. However, no study has so far applied an experimental approach to studying whether prospect theory may provide a better model of refugee migration than expected utility theory. This study aims to fill this gap, as well as determining parameters for refugees’ risk behaviour that are compatible with prospect theory.
The TCN framework has been used in a variety of non-migration related settings: Liu & Huang (2013) study risk preferences and pesticide use by cotton farmers in China, Nguyen & Leung (2009) study the risk attitudes of Vietnamese fishermen, Campos-Vazquez & Cuilty (2014) experiment on the role of emotions in risk aversion on Mexican students.
The TNC experimental protocol therefore allows us to examine whether, compared to other populations, refugees are more or less risk averse. Further, we can study the components of the risk decision in a cumulative prospect theory framework by comparing loss aversion, marginally decreasing utility and probability distortion of refugees and other populations.
11See Akg ¨uc¸ et al. (2016); Bonin et al. (2009); Dohmen et al. (2011); Dustmann et al. (2017b); Gibson
& McKenzie (2011); Jaeger et al. (2010).
12The German Socio-Economic Panel (IAB-BMF-SOEP) includes asylum seekers, but does not ask
questions or test their attitude towards risk.
2.4
Focus on asylum seekers
Ideally, to understand all refugee migration choices our sample should cover persons who have decided not to migrate, to migrate elsewhere, or who have not succeeded in their migration. In the current study it was not possible to access persons who had not arrived in Western Europe. We sampled only asylum seekers who had arrived in Luxembourg, whose socio-demographic characteristics are representative of asylum seekers in the European Union. Obtaining legal refugee status takes several years, during which time the risk attitudes might change. Recognized refugees were thus excluded from the sample.
Focussing on the persons who succeed in migrating is of interest, because it com-plements studies in countries of origin on persons who have not migrated14, and be-cause risk attitudes of asylum seekers can provide valuable information on the choices of those persons who do become forced migrants.
Underlying this approach is the idea that the choices the asylum seekers make in our experiment can shed a light on the choices they made when migrating. Akg ¨uc¸ et al. (2016)’s finding that risk attitudes of migrants are unchanged by substantial changes in the environment, as well as Dohmen et al. (2011)’s and Highhouse et al. (2017)’s results show that there exist general traits underlying risk attitudes. Their studies provide evidence that there is consistency in risk attitudes across situations. We therefore assume that there is a strong correlation between choices made in the experimental context and during the migration.
2.5
Validation of the experimental setup
Several authors have tested framing effects in lottery experiments in order to eval-uate the extent of this concern and identify methods which are preferable to obtain robust measurements of risk aversion. For instance, L´evy-Garboua et al. (2012) built several Holt and Laury lists of lottery pairs by varying display (simultaneously or se-quentially), probability ranking (increasing, decreasing or random), and payoff range (low or high). They found that in all three cases respondents risk aversion was signif-icantly altered. The psychological anchoring effect towards the middle row is one of the biases addressed by Andersen et al. (2006). The authors vary the cardinal scale of the probabilities in the Holt and Laury experiment by using two asymmetric frames where probabilities are skewed towards the highest or lowest values. They obtain mixed results. Bosch-Dom`enech & Silvestre (2013) tested four alternative modalities of embedding in 10-row lists by deleting the first 3 rows, rows 1, 2, 10, rows 1,9,10 or the last three rows. They found a systematic decrease in risk aversion when using the popular Holt and Laury list, which features pairs of lotteries with fixed payoffs and probabilities increasing or decreasing along the list. However, there was no significant bias when using a more recent elicitation method using only one and the same prob-ability in the list. In the latter, the safe option is a sure payoff that increases along the list, while the risky one is a 50-50 fixed lottery.
In this paper we test the embedding effect in a third kind of paired lottery lists. In TCN lists probabilities of both options are fixed while payoffs increase or are fixed. We test whether the TCN protocol is prone to an embedding bias in order to provide
14See Voors et al. (2012) and Callen et al. (2014) on the risk preferences of persons who have stayed
i) a partial validation of the accuracy of estimates, ii to show whether the TCN test is adapted to low budgets for experiments and for rich countries, and (iii) to validate the relevancy of comparing estimates between full TCN tests and TCN without certain lines, such as to be found in Bocqueho et al. (2014).
2.6
Modelling refugee migration
The migration decisions of refugees as distinct from those of other types of migrants are theoretically modeled in Czaika (2009); Schaeffer (2010) and Djaji´c (2014) as a com-bination of economic and non-economic push and pull factors which influence indi-viduals’ decisions. Refugees decide to migrate to a Western country or to a safe coun-try or refugee camp close to their councoun-try of origin on the basis of the expected utility of the different options. Flight to a western country is costly and risky, because the refugee obtains a legal status only with a probability inferior to one. If the status is not obtained, he is sent back to his country of origin.
The models differ in the different aspects of the refugee migration process which are included (see Table 12). The authors avoid the problems posed by the complexities of the migration process by designing basic models and then discussing variations of them. Djaji´c (2014) uses numerical examples to show the effects of changes in the values of the determinants of the utility functions. Schaeffer (2010) adds branches onto a basic set of decisions one by one and discusses them separately. Czaika (2009) uses comparative statics to predict the effects of changes of the values of the variables in his maximization model.
All the cited models maximize expected utility. While those of Djaji´c (2014) and Czaika (2009) include risk aversion, none allows for loss aversion or probability dis-tortions. However, these aspects of refugees’ choices, that are included in cumula-tive prospect theory, are shown by our empirical study to fit the reality better than the expected utility model. Our contribution to this literature is to propose a model of refugee migration that is based on cumulative prospect theory. It therefore takes account of decreasing marginal utility, loss aversion and probability distortion. We further discuss the implications of the model using numerical simulations which are based on the empirical data from our study. We thus provide a first step to create an appropriate model predicting refugee flows and policy impacts on forced migration.
3
Experimental design
This field study is designed to gather information about the migration decisions of refugees. For this, we study the attitudes towards risk of refugees, as well as their socio-demographic characteristics.
We elicited preferences from 206 asylum seekers in Luxembourg during the proce-dure of recognition of their asylum claim in autumn and winter 2017-2018. Interviews were completely anonymous and took place at the university of Luxembourg, as this setting conveyed a sense of safety to the interviewers and the interviewees. It also un-derlined the scientific nature of the study. Asylum seekers were randomly recruited by a research assistant using the interception sampling technique in refugee reception centers and mosques. The interviews were conducted face-to-face by the research as-sistant. Prior to the field work, the research assistant was tested on his comprehension of the questionnaire in Arabic and in English. The entire interview protocol was trans-lated from English into Arabic, and back into English by a different translator. The research assistant, accompanied by a member of the research team, registered the an-swers online. Interviews took approximately 3/4 hour and included initial consent, questions on demography, education, language, work, income, networks and condi-tions before departure, migration path and condicondi-tions and future plans. This part of the interview was followed by the experimental protocols described in section 3.2.
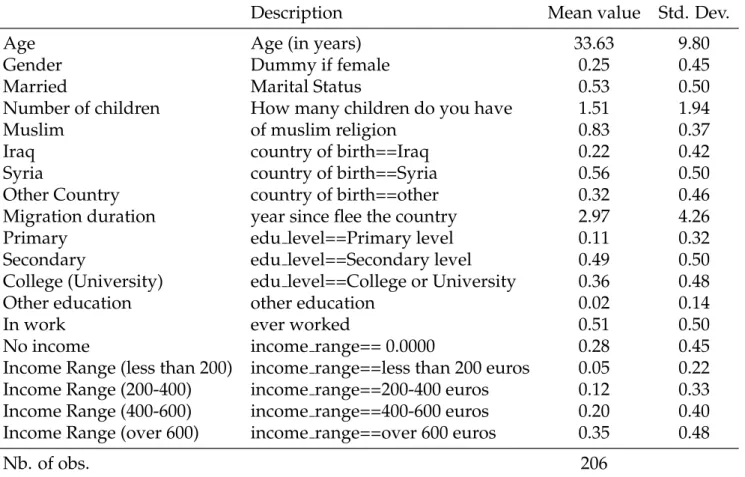
As Figure 2 shows, the largest group of subjects originates from Syria (56%), fol-lowed by Iraqis (22%). These are also the main countries of origin in Luxembourg and in the European Union15. A majority of refugees in the sample (75 %) are male and the average age is 33 years. According to Eurostat, 75 % of asylum seekers in the the 18-34 age group arriving in the EU in 2016 were male, our sample is thus representative. The participants are well educated: 85 % have completed at least secondary education and 36 % have a college or university degree. Only 53 % are married, and only 51 % have ever worked. A minority of subjects earned low incomes in their countries of origin, while 35 % declare to have earned more than 600ea month before fleeing. The latter are relatively wealthy: for comparison, the average monthly income in Syria before the war was 234e, in Iraq (2017) it is 413 e, and in Afghanistan 42 e.16
3.1
Estimation methods
Cumulative prospect theory (CPT), developed as an alternative to standard expected utility theory (EUT) by Tversky & Kahneman (1992) is the predominantly endorsed theory of behaviour under risk, accounting for bounded rationality.
In CPT, risk behaviour results from the interplay of utility curvature σ, loss aver-sion λ and probability weighting γ. Note that the CPT model reduces to the EU-power model (with a reflected utility function at zero) if λ =1 and γ =1.
CPT features two key factors in explaining expected utility theory17 anomalies, namely reference dependence and probability weighting. Whereas EUT does not dis-tinguish between gains and losses, in CPT outcomes are classified as either gains or losses with respect to a reference point, and people can behave differently in each of the two outcome domains. Probability weighting refers to people’s tendency to distort
15Statistics from Eurostat (ec.europa.eu).)
16Data taken from the IMF Datamapper. Last data for Syria 2010. 17Von Neumann & Morgenstern (1945).
objective probabilities, which is accounted for in CPT through a non-linear valuation of outcomes with respect to objective probabilities.
The first parameter determines the shape of a power utility function exhibiting a different slope in the gain and the loss domain (Tversky & Kahneman, 1992):
u(y) = yσ if y>0 0 if y=0 −λ(−y)σ if y<0 . (3.1)
In this specification, σ is an anti-index of utility concavity for gains (σ > 0) and λ is a second parameter representing the decision maker’s coefficient of loss aversion (λ >0). The decision maker is more (resp. less) sensitive to losses than to gains when
λ > 1 (resp. λ <1). The usual empirical finding is λ >1, along with σ <1 (concave
utility in the gain domain). Following Tversky & Kahneman (1992), decision weights defined over cumulative probabilities are also introduced. The value of any binary lottery(y1, p; y2)is as follows: PU(y1, p; y2) = ( ω(p).u(y1) + [1−ω(p)].u(y2) if y1≥y2≥0 or y1 ≤y2 ≤0 ω(p).u(y1) +ω(1−p).u(y2) if y1<0<y2 (3.2) where ω(.) is a probability weighting function which is strictly increasing from the unit interval into itself, and satisfies ω(0) =0 and ω(1) = 1 .
The form of the weighting function has been widely discussed. Following Tanaka et al. (2010), we choose Prelec (1998)’s specification:
ω(p) = exp [−(−ln p)γ] (3.3)
where γ is a third parameter controlling the curvature of the probability weighting function (γ > 0). This parameter can be interpreted as an index of likelihood sensi-tivity, with γ = 1 reflecting the absence of probability distortion (ω(p) = p). In other words, as γ decreases (γ < 1), the distinction between different levels of probability gets more and more blurred, and probabilities tend to be perceived as all being equal. This is the normal assumption, backed by a substantial amount of empirical evidence, and giving the weighting function an ‘inverse S-shape’. In the case of a binary prospect such as a lottery, it characterises an overweighting of the low-probability outcome and an underweighting of the high-probability outcome. If γ > 1, the function takes the less conventional ‘S-shape’. At the extreme, if γ is very high, probabilities tend to be perceived as either 0 or 1.
Figures 4 and 5 illustrate the difference between the utility functions in EUT and CPT. In Figure 4, the bisectrix designates the the utility function of a risk neutral indi-vidual, for which utility is a linear function of payoff. Incorporating a cognitive bias, the utility function becomes concave (EUr). If we reflect it at 0 in order to allow for negative payoffs and utility, we obtain a functional form which is a combination of EUrn and EUr. CPT adds a reference point (in this case at the origin) and adds a different weighting to losses. The function CPT (combined with EUr for the positive
area) shows that losses have an increased negative impact on utility compared to the positive impact of gains. In total, we obtain an S-shaped utility function.
Figure 5 reflects the probability distorsion in CPT. While the bisectrix represents a perfect perception of risk (perceived probability is equal to actual probability), the inverse S-shaped weighting functions TNC and ω reflect the overrepresentation of low probabilities and the underrepresentation of high probabilities.
3.2
Experimental protocol
We adapt Tanaka et al. (2010)’s risk task.18 This design is chosen because it estimates the different CPT parameters in detail without costing respondents much time. It also makes it possible to test for EUT (with a reflected utility function at zero) as well as CPT, EUT appearing as a special case of CPT. The drawback of this design19, its com-plexity, was avoided by a one-to-one interview setup, in which the interviewer could make sure that the method was understood prior to beginning the test. This test elicits subjects’ risk preferences. It provides results on all three of the parameters of CPT: utility convexity for gains (σ), loss aversion (λ) and likelihood sensitivity (γ).
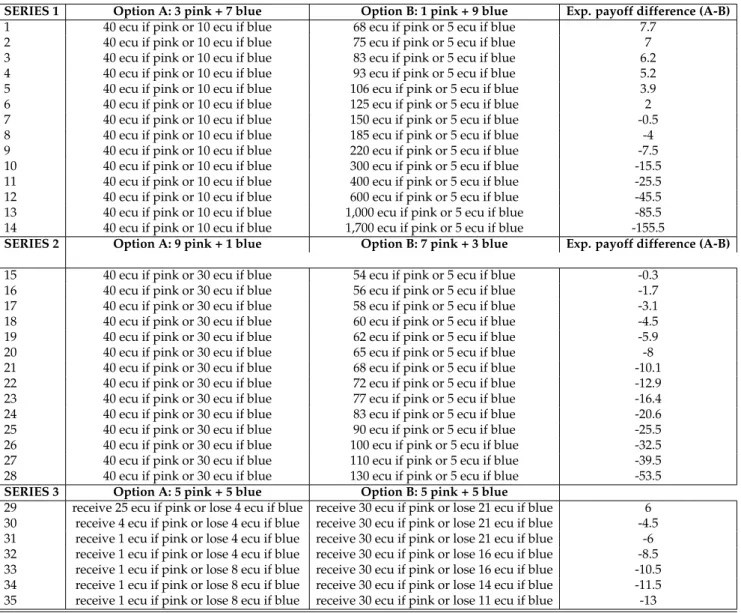
The risk task consists of a succession of pairs of binary lotteries, each pair being composed of a relatively safe lottery (option A) and a risky lottery (option B) (see Ta-ble 7). The monetary values are expressed in ecus (10 ecu = 1e) Initially, the expected value of lottery A is higher than that of lottery B. As one proceeds down the rows, the expected value of lottery B increases and surpasses that of lottery A. Risk neutral subjects are expected to choose lottery A first and switch to lottery B as soon as B’s expected value is higher than that of A (ee column 4 in Table 7, not visible to partic-ipants). Very risk averse individuals will never switch, but prefer the safe lottery A even when it has a lower expected value. Risk lovers will switch to the risky lottery B even before its expected value is higher than that of A. There are two series of lotter-ies with positive payoffs and one serlotter-ies of lotterlotter-ies which mixes positive and negative payoffs. The combination of the switching points of series 1 and 2 in Table 7 are used to estimate the curvature of the utility function σ and the nonlinear probability weight-ing parameter γ for each interviewee. We can then use the switchweight-ing point from series 3 to estimate the loss aversion λ.20
In a variation of the original Tanaka et al. (2010) task, we add treatments. We amputate the price lists by the last or the first three lines in order to test for embedding effects.
After having completed the socio-demographic questionnaire, interviewees played the TCN lottery game subject to the treatments. They were shown colored balls to rep-resent the probabilities of the payoffs of the lotteries. A comprehensive introduction of the method was given, including examples, to ensure comprehension.
18The interview design was approved by the French Research Ethics Board (Comit´e d’Evaluation de
l’ ´Ethique de l’INSERM, CEEI-IRB, CEEI-IRB opinion number 17-366) and to the Ethics Review Panel of the University of Luxembourg (ERP) (ERP opinion on research project ERP 17-22). The collection of data was declared to both the French and the Luxembourg Commissions for Data Protection. France: CNIL reference 2039994 v 0 of 23 March 2017; Luxembourg: CNDP reference R009671/T012217.
19For a discussion of advantages and drawbacks of different designs for risk elicitation see Charness
et al. (2013).
20For a more detailed explanation of the parameter calculation, see Tanaka et al. (2010) and Liu &
Subjects received an initial endowment of 10 ein shopping vouchers21 for partic-ipation. In addition, they earned a payment that depended on their choices in the lotteries: at the end of the interview, one lottery row was randomly selected and the corresponding lottery was played for vouchers. The theoretical payment was com-prised between 8 eand 180 e.22 An average of 14,5 ewas paid at the end of the in-terviews (between 8 and 32e).23 Given that asylum seekers in Luxembourg receive 25eper month (in addition to housing and meals)24, this payment gave them strong incentives to make thoughtful and careful decisions. Interviewees were informed that they could abandon the interview at any time and still receive the initial 10epayment.
21These SODEXO vouchers are valid in major supermarkets in Luxembourg, as well as other shops
that are accessible to asylum seekers. Their validity is one year, and the goods that can be bought cover most commodities.
22Monetary outcomes were rounded to the next full euro value for payment in vouchers. 23See 7 for the payment distribution.
4
Experimental results
4.1
Baseline parameter estimates
For each subject, we calculate the corresponding CPT parameters using the common midpoint technique.25 We subsequently derive estimates of mean values and corre-sponding standard errors for the underlying population (Table 3). We find that, on average, the parameter σ controlling utility curvature has a value of 0.708 and the loss aversion parameter λ has a value of 2.109. Regarding the likelihood sensitivity param-eter, we find that the mean value of γ is 0.923. All three parameter values lie in the expected intervals. The CPT functions resulting from these values are the ones repre-sented in Figures 4 and 5. All parameters are significant at the 1% level. The fact that
λ(loss aversion) and γ (probability distortion) are significantly different from one
im-plies that CPT is a more appropriate framework for assessing risk attitudes of refugees than EUT.
Figure 6 represents the distribution of the three estimated parameters. The fig-ure shows that the three parameters follow different distribution patterns: σ (utility curvature) has a polarized distribution, while λ (loss aversion) and γ (probability dis-tortion) are skewed. We find evidence of both convex and concave utility functions, of loss aversion as well as discounting of losses, and of over- and underestimation of probabilities.
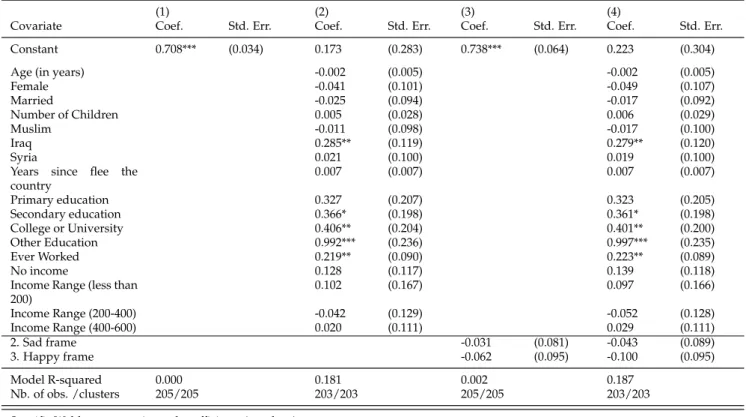
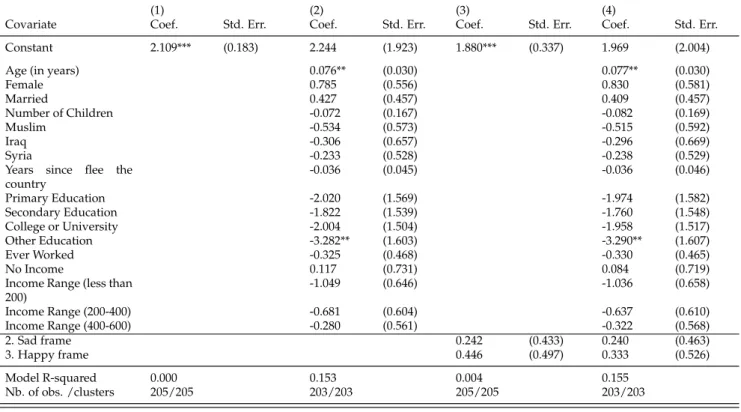
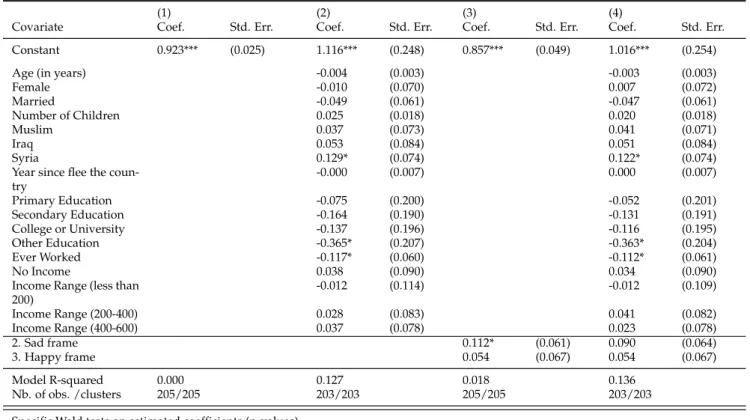
Tables 4, 5 and 6 provide the estimations of the parameters including a set of ex-ogenous individual characteristics. Both the σ and λ parameters lose their significance when including individual effects, whereas γ remains significant.
Coming from Iraq, having higher education levels and having worked are impor-tant for explaining utility curvature σ. Loss aversion λ increases in age but is reduced for subjects who have attended alternative education systems.26 Subjects from Syria, compared to the other countries, distort probability γ less, while subjects who have at-tended alternative education systems and who have worked in their country of origin distort probabilities more.
4.2
Comparison of estimated parameter with other studies
The signs of our parameter estimates correspond to the classic pattern of the CPT framework. Figure 8 shows that the values obtained in this study are different from those in studies based on the same experimental setup.27 Refugees exhibit lower loss aversion, utility curvature and probability distorsion than the other populations. A mean test comparing our parameter values to those in Bocqueho et al. (2014) and in Jacob et al. (2017) (Table 7) shows that the differences between the studies are signifi-cant.28
25Due to Tanaka et al. (2010)’s specific design, bounds for σ and γ can be jointly inferred by crossing
responses to Series 1 and Series 2, each series providing several possible combinations of intervals for
σand γ. Then, depending on the σ value previously elicited, conditional bounds for γ can be inferred
from Series 3. Parameter values are approximated by taking the midpoint of intervals. When there is no switch, the values at the boundary are used.
26All the persons who indicated having attended alternative education systems attended madrasas. 27Bauermeister et al. (2017); Bocqueho et al. (2014); Campos-Vazquez & Cuilty (2014); Jacob et al.
(2017); Liu & Huang (2013); Tanaka et al. (2010).
Figure 9 compares the utility functions resulting from the parameter values in Tanaka et al. (2010) and in this study. Due to a lower utility curvature (higher value of σ), refugees obtain increasingly higher utility levels for positive payoffs. In other words, high prospective payoffs will affect the utility function of refugees more than of the TNC population.
In the area of negative payoffs, there are two effects: for negative payoffs close to zero, refugees suffer lower utility losses than in TNC, because refugees do not pon-derate losses as highly as in TNC (they have a lower value of λ). Refugees are thus less sensitive to low losses compared to the TNC population. This effect is inversed for high losses, because refugees’ low utility discounting σ has a stronger effect than their lower loss ponderation beyond a certain point. Thus, refugees are more sensitive to high losses than the TNC population. If refugees’ reference point is very low, for example if the status quo is war, then they do not have much to lose, and they may well be less sensitive to negative outcomes than other populations.
Figure 5 compares the probability weighting γ of refugees to that of TCN. As in TCN, refugees underestimate low probabilities and overestimate high probabilities. However, they do so to a much lower degree. As probability distortion is compara-tively low their perception of probabilities is very close to the true values.
5
Treatments
5.1
Psychological priming
We adapt the experimental setup of Callen et al. (2014), we used field psychological methods to ask all subjects to describe an event of their lives prior to the experiment. We randomized three treatments29 accross subjects, asking questions with the follow-ing formulation:30
• We are interested in understanding your daily experiences that may make you fearful or anxious. This could be anything, for example getting sick, experiencing violence, losing a job, etc. Could you describe one event in the past year that caused you fear or anxiety? (FEAR)
• We are interested in understanding your general daily experiences. This could be anything. Could you describe an event from the past year that was important or significant for your life? (NEUTRAL)
• We are interested in understanding your daily experiences that make you happy or joyous. This could be anything, for example birth of child, marriage of a relative, or success in your job. Could you describe an event in the past year that caused you happiness?(HAPPY)
Tables 4, 5, 6 (columns 3 and 4) include the psychological primer experience treat-ment. We find that it has no effect on the estimated risk parameters, except on proba-bility distortion γ, which is reduced by remembering a fearful event.
5.2
Embedding effects
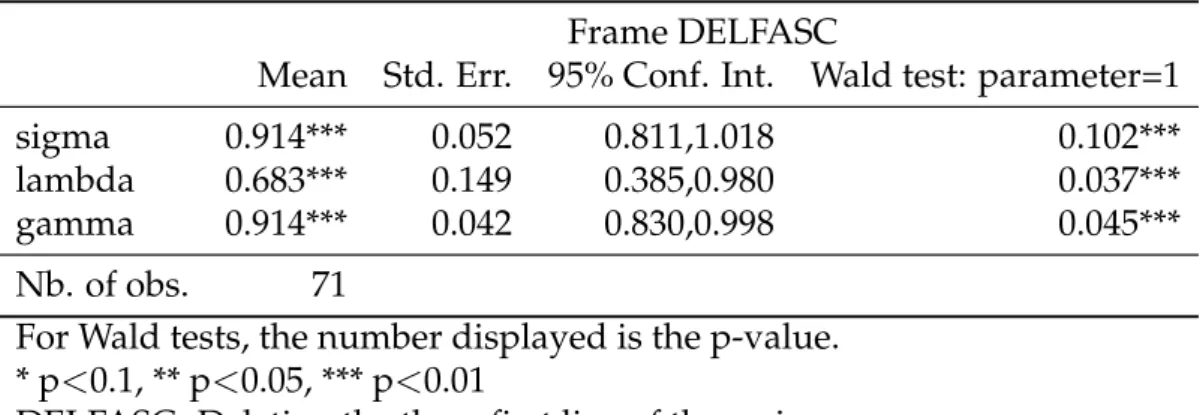
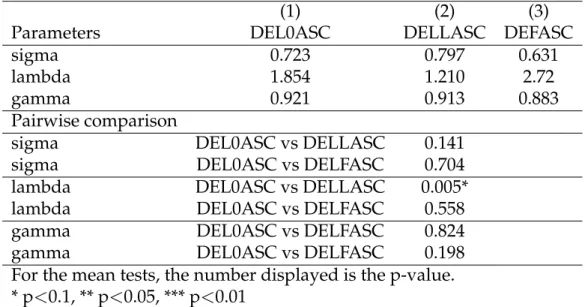
Tables 9 and 10 show the parameter values of the treatments designed to test for em-bedding effects. Treatment DELLASC amputates the TCN lottery table by the last three lines, while treatment DELFASC amputates the TCN lottery table by the first three lines. Table 11 shows that the differences between the treatments are not signif-icant. This is evidence that the mean parameter values are robust to these embedding effects, validating their accuracy. We also contribute to showing that the TNC exper-imental protocol can be adapted to relatively low budgets by amputating the lines with the high value lotteries without significantly changing the results. Finally, re-sults between TNC protocols with and without the amputation of some lines can be compared. Thus, this test validates the comparison of our results to that of ?.
29A randomization test shows that the differences between the subjects allotted to the three priming
treatments are not significant.
6
Theoretical model of refugee migration
In this section, we will apply the insights gained by our experiment to design a theoret-ical model on refugee migration that takes risk attitudes into account. A basic model is developed in Section 6.1. As a benchmark, Section 6.2 applies an EU framework to the model. Section 6.3 proposes an alternative model of refugee migration, based on cumulative prospect theory. Finally, we propose a numerical simulation of the models, based on the socio-demographic information and the risk parameter values gathered in our empirical study.
6.1
Basic assumptions
We consider a decision-maker (DM) who lives in a developing-country, and enjoys an annual income of yON, in her country of origin in time of peace. Let us suppose that
a conflict blows up. This conflict impacts the annual income, which falls to yOC with
yOC <yON.
The DM faces three alternatives:
1/ Staying at home, and only earning yOC.
2/ To leave for a neighboring safe country, at no cost, and earning yS.
3/ Try to leave in a western country. This alternative is costly (see later), but it is also a risky alternative in the sense that two different outcomes can be obtained: with a probability p (with p ∈]0, 1[), he obtains refugee status and earns an annual income of yW. But with the complementary probability 1−p, he fails to obtain asylum. In the
latter case, he is sent back to country of origin, and earns yOC.
We suppose that annual incomes are constant during all periods, but we assume that the DM has a time horizon and discounts future incomes. To be more precise, considering as an example the case of staying in the origin country in time of conflict, the DM’s “life-expectation” is:
yOCT = Z T
0 yOC.e
−rt
.dt
with t being a period, T being the time horizon (i.e. the last period which is taken into account by the DM), r the discount rate.
Following the same rationale, we define: yTS = R0TyS.e−rt.dt and yWT =
RT
0 yW.e
−rt.dt
the life-expectations in case of leaving in a neighboring safe country, and leaving for a western country respectively31.
Trying to move to a western country is costly: we suppose that the DM has to pay a cost C, that he borrows.32 As a consequence, choosing this alternative supposes to
31To simplify the analysis, we suppose that the conflict lengths all the periods until time horizon T:
there is no end of the conflict in sight (leading to a return in the initial situation, and so earning yONper
year, is not a possibility).
32In our sample, 51 % of the first 100 respondents did not finance their journey using their own
repay the loan, and this reduces the life-expectaction by an amount: CTe=
Z Te
0 c.e
−rt.dt
with Te being the repayment horizon, c = TeC the annual amount of repayment. It is important to note that this repayment has to be made whatever the outcome of the asylum process (i.e. whatever the DM ultimately lives in the western country or was sent back to her country of origin).
6.2
Expected Utility
Consider first that the DM is a Von Neumann - Morgenstern Expected Utility (EU) maximizer. In this case, he values the different alternatives as follows:
VEU(West) = pU(yWT −CTe) + (1−p)U(yTOC−CTe)
VEU(Sa f e) =U(yTS)
VEU(Origin−Con f lict) =U(yTOC)
with U(x)being the VNM - Utility function, from enjoying a payoff x (with x being a final wealth, so that x≥0).
We assume the DM has a power utility function: U(x) = xα, with α > 0 This kind of
utility function allows considering a risk averse DM (if α <1), as well as a risk-neutral DM (α =1) or a risk-loving DM (α >1). Using a power function is widely recognize in the economic literature, and it has the advantage to giving us the ability to directly interpret α as an indicator of risk aversion33
Applying these specifications, we get the following values for the three alterna-tives:
VEU(West) = p(yTW−CTe)α+ (1−p)(yOCT −CTe)α (6.1)
VEU(Sa f e) = (yTS)α (6.2)
VEU(Origin−Con f lict) = (yOCT )α (6.3)
and, by comparing these values two-by-two we obtain:
Proposition 1.
(i) yST >yOCT leads a VNM-DM to migrate.
(ii) The following condition is a sufficient (but not necessary) condition for a VNM-DM to prefer trying to leave to West over going to a Safe-neighbor country:
α > − ln(p)
ln(yWT −CTe) −ln(yT OC)
33The Arrow-Pratt indicator of absolute risk aversion (−u00(c)
u0(c)) associated with a utility function
U(x) =xαreduces to−(α−1)
x . α is directly linked to the degree of risk aversion, and the DM exhibits a
decreasing absolute risk aversion: the wealthier he is, the less he is affected by an additive risk on his wealth.
Proof: see section 7.
Proposition 1 states that the more convex (or the less concave) the utility function of the DM, the higher the likelihood the DM to prefer West over going to a safe neigh-boring country. A higher convexity of the utility function means the marginal utility (of wealth) is increasing (with the level of wealth). Because going to West is associ-ated with the highest but not certain payoff, this perspective is better valued by the DM in case of a more convex utility function. This can also be interpreted in terms of preference towards risk: more convexity leads to lower risk aversion. As a conse-quence, in case of a risky alternative associated with a high-payoff perspective and a low-payoff perspective, a less risk averse DM focusses more on the opportunity to reach the high-payoff perspective than he fears the threat of low-payoff perspective. Note that as 0< p <1, an increase in p leads to a decrease in ln(p): if the probability to obtain refugee status in the West is higher, then more risk averse persons decide to try to go flee to the West.
6.3
Prospect Theory
Under VNM-expected utility, individuals’ preferences towards risky perspectives are entirely captured by the degree of concavity of the utility function U(x)(i.e. the value of α, for U(x) = xα). Following the observations made by Kahneman and Tversky
(1979), Prospect Theory (PT) takes into account three additional features that many individuals seem to exhibit when facing (risky) perspectives:
(i) valuations, relative to a reference point
(ii) loss aversion: a loss of X (relatively to the reference point) is more painful than a gain of X is enjoyable
(iii) difficulties to correctly assess probabilities.
As a consequence, the values the different alternatives for a DM having PT prefer-ences are:
VPT(West) =ω(p)v((yWT −CTe) −yOCT ) +ω(1−p)v((yOCT −CTe) −yOCT )
VPT(Sa f e) = v(yTS −yOCT )
VPT(Origin−Con f lict) =v(yOCT −yOCT )
with:
v(x−z) being the valuation of a payoff x relative to the reference point z. In case of x >z (positive perspective), the DM values the perspective as: (x−z)σ, with σ >0.
In case of x<z (negative perspective), the DM values the perspective as: (−λ)(−(x−
z))σ, with σ > 0 and λ ≥ 1. σ represents the concavity of the value function, and λ
represents loss aversion: in case of λ >1, a loss of z−x is more painful that a gain of a similar absolute value.
ω(p)is the weighting function of probabilities. It takes the following form ω(p) =
1/exp[ln(1/p)]γ. γ is defined in the interval [0,1] : if γ = 1 then ω(p) = p, and if γ =0 then ω(p) =1,∀p. As a consequence, for a case of two states of Nature the sum ω(p) +ω(1−p)lies in [1,2]. Hence, depending on the value of γ the DM can perfectly
perceive the different probabilities, or he can be unable to distinguish them (and thus attributing a similar weight to all states of Nature). The closer the value of γ is to 0,
the more the perception of the probability is distorted.
Recall that we assume the conflict to be persistent over all the periods of the time horizon. As a consequence, if the DM stays in the country of origin, he will earn yOC
at each t period from now until time horizon T. So, her “life-expectation” in case of choosing the statu quo option is yTOC. This implies that yTOCis her reference point. As a consequence, considering the frame of a Prospect-Theory decision model, all payoffs are valued relatively to yOCT .
Succeeding in getting asylum in a western country leads to a positive perspective (yWT >yTOC). If we assume yTS >yOCT (what we do), going to a safe-neighbor country is also a positive perspective34 (relatively to staying at home, with a conflict). However, because traveling to a western country is costly, being send back to the country of origin in case of failure in obtaining asylum in West leads to a negative perspective, which decreases life-expectation (yTOC−CTe <yTOC).
All-in-all, the values of the three alternatives for a Prospect Theory Decision-Maker are:
VPT(West) =ω(p)((yTW−CTe) −yOCT )σ+ω(1−p)(−λ)(−((yOCT −CTe) −yTOC))σ
(6.4) VPT(Sa f e) = (yST−yOCT )σ (6.5)
VPT(Origin−Con f lict) = (yOCT −yOCT )σ (6.6)
with ω(p) = 1/exp[ln(1/p)]γand ω(1−p) =1/exp[ln(1/(1−p))]γ
We remark that VPT(Origin−Con f lict)simplifies, and is normalized to 0.
A comparison of the values of the different alternatives, and of how these values evolve with preferences (i.e. σ, γ, λ), allows us to state:
Proposition 2.
yTS >yTOCleads a PT-DM to migrate.
In this (very) simple model, the decision to migrate (whatever the destination) has the same trigger for a VNM-DM and for a PT-DM. However, the choice of the destina-tion does not have the same tenets.
Proposition 3.
(i) The following condition is a necessary (but not sufficient) condition for a PT-DM to prefer trying to leave to West over going to a safe-neighbor country:
σ > ln(ω(1−p)) −ln(ω(p)) +ln(λ)
ln((yTW−cTe) −yT
OC) −ln(−((yOCT −cTe) −yTOC))
(6.7) (ii) To satisfy the condition:
" (yTW−CTe) −yOCT −((yTOC−CTe) −yT OC) #σ > ω(1−p)λ ω(p) (6.8)
34Czaika (2009), p. 4, says that a neighbor-safe country guarantees security but “limitations in
self-reliance impose worse economic conditions”. This is true relatively to the situation before conflict: yS <yON. However, in case of highly violent conflict, we can suppose that the neighbor-safe country
is necessary (but not sufficient) for an increase in σ (i.e. less concavity / more convexity of the value function) to lead to an increase in the likelihood for West to be preferred over Safe.
(iii) An increase in loss aversion λ increases the likelihood of Safe to be preferred over West. (iv) If the relative gain in life-expectation when getting asylum in West is higher than the relative loss in life-expectation when failing in obtaining asylum, if the loss aversion is low and if the probability to get asylum is lower than 0.5, then a stronger misperception of probabilities (in the sense of PT, i.e. a lower γ) increases the likelihood of West to be preferred over Safe.
Proof: see section 7.
Proposition 3 calls for comments. About points (i) and (ii), two precisions have to be made. Condition (6.7) is a condition for which the PT-value of West is positive, which is a necessary condition for West to be preferred over Safe. As a consequence, if (6.7) is not satisfied, West cannot dominate Safe (the value of which is always positive). Con-dition (6.8) is a conCon-dition for which the PT-value of West increases with the value of σ, which is a necessary condition for a higher convexity of the PT-value function to lead to a higher likelihood for West to be preferred over Safe. From (6.8), we can remark that the effet of a higher convexity depends both on the initial degree of convexity (σ), and depends on other preferences parameters (loss aversion λ, and probability weighting ω(.), via the value of γ). Hence, we can see that when p and 1−p are sim-ilarly perceived (i.e. γ → 0) and when λ → 1, then the right-hand-side of condition (6.8) tends to reduce to 1: this increase the likelihood for an increase in σ to increase the relative value of West. When p and 1−p are sufficiently different and tend to be perfectly perceived (and/or when λ is sufficiently higher than 1), then the condition in Point (6.8) has few likelihood to be satisfied and an increase in σ decreases the like-lihood for West to be preferred over Safe. These observations allow seeing that for a PT-DM, interactions between risk aversion (value of σ), loss aversion (value of λ) and probabilities perceptions (value of γ) are of paramount importance: a higher/lower degree of risk aversion leads to opposite results, depending on the DM’s assessment of probabilities and loss aversion. Point (iii) is straightforward, since only West in associated with a negative perspective. So, an increase in loss aversion reduces the PT-value of West, and Safe has a higher likelihood to be chosen.
EU and PT framework are now introduced, and we have also highlighted the im-pact of some features of preferences (risk aversion, loss aversion, . . . ) on the relative value of each alternative. Now, it would be interesting to see what is the DM’s choice, for a given context, depending on the decision model he considers. For this, we have to make some numerical analyzes.
6.4
EU vs PT: a numerical analysis
Numerical calculations aim at comparing choices made under EU and CPT for a given context, and to simulate how a change in the context and/or in preferences affect the ranking between the three alternatives.35
6.4.1 Baseline
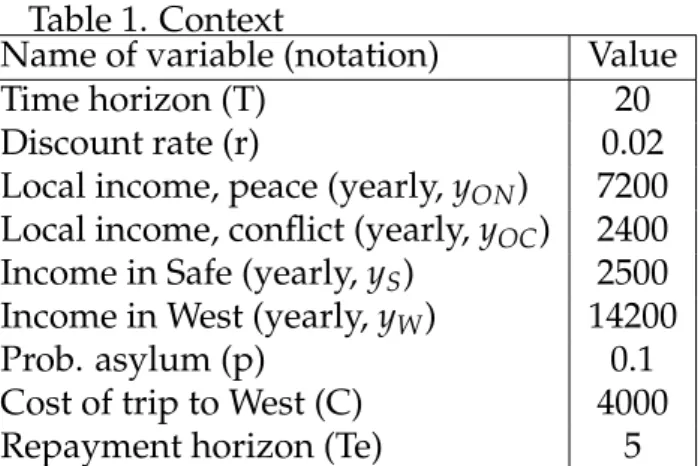
To set a baseline, we calibrate our models with data from different surveys36 . As a consequence, we consider the following context variables:
Table 1. Context
Name of variable (notation) Value
Time horizon (T) 20
Discount rate (r) 0.02
Local income, peace (yearly, yON) 7200
Local income, conflict (yearly, yOC) 2400
Income in Safe (yearly, yS) 2500
Income in West (yearly, yW) 14200
Prob. asylum (p) 0.1
Cost of trip to West (C) 4000
Repayment horizon (Te) 5
We consider periods of one year. Mean monthly income of migrants we interviewed was 600 Euros, hence 7200 Euros by year. We consider that conflict reduces by 2/3 this annual income (2400 Euros in case of conflict). In order to be in line with our theoretical assumptions, we choose to set the income the migrants can earn in the Safe-neighbor country as being slightly higher than the home income in case of conflict (2500 Euros). Mean cost of trip to West is 4000 Euros, while the probability to succeed in arriving in West and getting asylum is 0.1 (REF to be added). For the basic scenario, we set time horizon at 20 years (but we study the impact of a variation in time horizon).
Given exponential discounting, T = 20 (time horizon of 20 years) and r = 0.02 (dis-count rate of 2%), we find: yONT = 118684.78 ; yOCT = 39561.594 ; yTS = 41209.99 ; yWT =234072.77. The discounted cost of travel, CTe, is: 3806.50.
We set the following values to preference parameters. They result from the calcu-lations in our study.
Table 2. Preferences37
Name of variable (notation) Value VNM-Utility concavity (α) 0.723 PT-value concavity (σ) 0.723 PT loss aversion (λ) 1.854 PT prob. weighting parameter (γ) 0.921 For these baseline values, we obtain the following ranking:
Table 3. Baseline: ranking of alternatives Alternative EU-Value PT-Value
Origin 2107.80 0
Safe-neighbor 2170.93 211.81
West 2516.39 111.84
Here, given our parameters, the two decision-models do not provide the same rank-ing between the three alternatives: accordrank-ing to expected utility, movrank-ing to West is the
36The values of the parameters are based on our field study and others (marked with ). Robustness
checks are still required.
best alternative while, according to prospect theory, moving to a safe-neighbor coun-try is the best option. Given the fact that we made our survey with individuals who have decided to leave their country to go to West, we should predict decision-makers to choose this alternative. We find that EU make this prediction, but not PT. Can we conclude EU to be a better predictor than PT? The answer is no, and three reasons (at least) can be evoked: 1/ by definition, models are simplifications of reality, and their predictions are linked to the assumptions on which they are built. Here, in this first work, by instance we suppose decision-makers to enjoy utility through the perception of earnings (while many other things have an impact on human well-being, which are not especially correlated with the net earnings). 2/ predictions of models also depend on the specifications of parameters: here, for EU-values by instance, values are rela-tively close from each other, so as a little error in parameters estimation could lead to another ranking. 3/ The specification of parameters depend on quality of answers in the survey. However, we surveyed people who are already in West: it is possible their preferences (and especially their behavior towards risk) have changed between the decision to move, and the moment where they answered the survey. However, what is of first importance is not only to be able to predict decision making at a given period and context, but it is also to know how decisions may change when preferences and/or the living context evolve. And this can be predicted by models.
So, starting from these values, we make a sensitivity analysis, by studying the im-pact of a variation in some parameters, one by one (ceteris paribus). First, for a given context, we make a sensitivity analysis on preferences parameters. Then, we provide a sensitivity analysis based on context parameters.
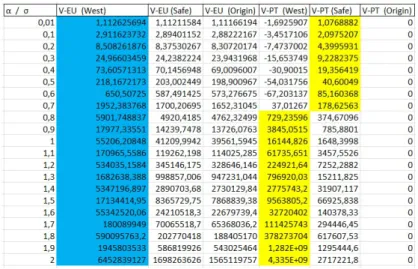
6.4.2 Sensitivity analysis - preferences parameters
Figure 1: Impact of risk aversion
Here, we start from the baseline scenario provided in the preceding subsection (with parameters provided in Tables 1 and 2), and we make numerical calculations of EU-values and PT-values for different values of parameters relative to the concav-ity/convexity of the value function (α for EU-value, and σ for PT-value).
First, we can note that the results provided in Figure 1 are in line with Proposition 3 Points (i) and (ii): given our parameters, conditions (6.7) and (6.8) are both satisfied for σ ≥0.6834 and, in Figure 1, we observe that the PT-value of West becomes positive for σ∈ [0.6; 0.7], and then increases in σ (in a way to become higher than the PT-value of Safe for σ ∈ [0.7; 0.8]).
Note that the switching point in the ranking between West and Safe is made for σ ∈ [0.7; 0.8], while our estimated value for σ is: 0.723. So, our estimated parameter is very close to the switching value (for which West is preferred to Safe). This calls for making relative the ranking provided by Table 3: the ranking of Safe as the best alternative under Prospect Theory is not very robust, and is “challenged” by the alternative West. Finally note that, given our context parameters, the ranking provided by Expected Theory does not change with the value of α: the preference for West is sufficiently ro-bust.
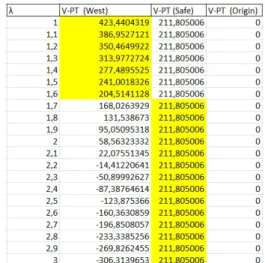
Impact of the degree of loss aversion
Here, the result is straightforward since, because of the assumption considering as the reference point the situation to staying at home under conflict, only the perspective of a failure in obtaining asylum in West is considered as a negative perspective. So, only the PT-value of West decreases in λ (other perspective are independent from λ). So, given other parameters constant, Safe become preferred over West for λ higher than [1.6; 1.7].
Note that if the reference point would be “staying at home in time of peace” (and earning yON each period), then the result would not be trivial because both failing in
obtaining asylum and going to a Safe-neighbor country would be considered as nega-tive perspecnega-tives. In that case, we should compare the relanega-tive evolution of both West and Safe with λ.
Impact of a variation in the weighting function (probability (mis)perception) To well un-derstand the relative evolutions of the different PT-values with γ, we have first to
Figure 2: Impact of loss aversion (PT only)
Figure 3: Impact of probability weighting (PT only)
recall that West is a combination of two perspectives, a positive one (obtaining asylum in West) and a negative one (not obtaining asylum).
If, when considering West, the positive perspective is associated with the lowest (objective) probability (i.e. if p < 1−p), then a reduction in γ, which leads to a distortion of probabilities in a way to get them all equal to 1 (i.e. both p and 1−p tend to 1 when γ→0), leads to an increase in the PT-value of West. Is it sufficient for West to dominate Safe? Yes, if the “mean” earning associated with West (i.e. the mean of the earnings of both perspectives associated with West - getting and not getting asylum, the two earnings being similarly weighted) is higher than the earning associated with Safe.
In the opposite, a misperception of probabilities can lead to a preference for Safe (over West) in a case where: (i) p >0.5 (because in that case, when considering West, a misperception / reduction in γ reduces the relative weight of the positive perspective, in a way that the PT-value of West could decrease) and (ii) if the mean earning in West is lower than the earning in Safe38.
38“mean” earning means, as in the preceding explanation, a mean of the two possible earnings:
get-ting asylum, and not getget-ting asylum, these both perspectives being similarly weighted. The “mean” earning associated with West could be lower than the earning associated with Safe since the alterna-tive going to West is associated with the earning from getting asylum, which is the highest one, and the earning from not getting asylum and being send back at home, which is the lowest earning. The earning associated with Safe has an intermediate value, so that the case we are currently discussing is possible.
7
ConclusionIn conclusion, we find that Expected Utility Theory, though the standard model used in the literature, is not as well adapted to modelling refugee choices as Cumulative Prospect Theory. Our study provides evidence that refugees show loss aversion, prob-ability distortion and utility concavity, compatible with Cumulative Prospect Theory.
Compared to other populations, refugees’ utility functions are less marginally de-creasing, they exhibit a lower loss aversion and are more objective when taking prob-abilities into account. Introducing a psychological primer implying the recollection of a fearful situation further reduces this probability distortion. The experimental results are robust to an embedding effect (deleting some of the lines of the Tanaka et al. (2010) framework).
We further propose a theoretical model of refugee migration adopting the insights from the experiments, based on Cumulative Prospect Theory. A numerical simula-tion including the socio-demographic characteristics observed in our sample shows that the model may provide better understanding of refugee migration. How to inter-pret these results? Returning to our initial questions, we can conclude that refugees evaluate gains, losses and probabilities differently to other populations. They prise gains more: migrating to a Western country with potentially very good perspectives is highly valued. Some types of losses carry a lower weight for them than for other populations.Finally, what about the perception of risks? According to UNHCR figures (which are admittedly inaccurate by nature), the probability of dying when crossing the Mediterranean in 2016 was 5000/305000, or 1.6%, so quite low. Refugees do not overestimate low probabilities as other populations, so this risk is not much exagger-ated.
Which lessons can one take for policy making? First of all, refugees take their decisions differently from other populations. Our study suggests that policy makers cannot deduce refugees’ choices from their own preferences. In practice, this means that coercive measures may have a smaller discouraging effect on refugees than on other populations. This is because refugees have lower loss aversion and value gains more highly. We can therefore predict a higher deflection effect when a migration path is closed. In order to evaluate the consequences of policies, and avoid unintended con-sequences, policy makers need to adopt appropriate models. We propose a model of refugee migration that incorporates the different components of risk preferences and could help policy makers to better understand forced migration and its determinants.
Table 1: Tables for TCN game
SERIES 1 Option A: 3 pink + 7 blue Option B: 1 pink + 9 blue Exp. payoff difference (A-B)
1 40 ecu if pink or 10 ecu if blue 68 ecu if pink or 5 ecu if blue 7.7 2 40 ecu if pink or 10 ecu if blue 75 ecu if pink or 5 ecu if blue 7 3 40 ecu if pink or 10 ecu if blue 83 ecu if pink or 5 ecu if blue 6.2 4 40 ecu if pink or 10 ecu if blue 93 ecu if pink or 5 ecu if blue 5.2 5 40 ecu if pink or 10 ecu if blue 106 ecu if pink or 5 ecu if blue 3.9 6 40 ecu if pink or 10 ecu if blue 125 ecu if pink or 5 ecu if blue 2 7 40 ecu if pink or 10 ecu if blue 150 ecu if pink or 5 ecu if blue -0.5 8 40 ecu if pink or 10 ecu if blue 185 ecu if pink or 5 ecu if blue -4 9 40 ecu if pink or 10 ecu if blue 220 ecu if pink or 5 ecu if blue -7.5 10 40 ecu if pink or 10 ecu if blue 300 ecu if pink or 5 ecu if blue -15.5 11 40 ecu if pink or 10 ecu if blue 400 ecu if pink or 5 ecu if blue -25.5 12 40 ecu if pink or 10 ecu if blue 600 ecu if pink or 5 ecu if blue -45.5 13 40 ecu if pink or 10 ecu if blue 1,000 ecu if pink or 5 ecu if blue -85.5 14 40 ecu if pink or 10 ecu if blue 1,700 ecu if pink or 5 ecu if blue -155.5
SERIES 2 Option A: 9 pink + 1 blue Option B: 7 pink + 3 blue Exp. payoff difference (A-B)
15 40 ecu if pink or 30 ecu if blue 54 ecu if pink or 5 ecu if blue -0.3 16 40 ecu if pink or 30 ecu if blue 56 ecu if pink or 5 ecu if blue -1.7 17 40 ecu if pink or 30 ecu if blue 58 ecu if pink or 5 ecu if blue -3.1 18 40 ecu if pink or 30 ecu if blue 60 ecu if pink or 5 ecu if blue -4.5 19 40 ecu if pink or 30 ecu if blue 62 ecu if pink or 5 ecu if blue -5.9 20 40 ecu if pink or 30 ecu if blue 65 ecu if pink or 5 ecu if blue -8 21 40 ecu if pink or 30 ecu if blue 68 ecu if pink or 5 ecu if blue -10.1 22 40 ecu if pink or 30 ecu if blue 72 ecu if pink or 5 ecu if blue -12.9 23 40 ecu if pink or 30 ecu if blue 77 ecu if pink or 5 ecu if blue -16.4 24 40 ecu if pink or 30 ecu if blue 83 ecu if pink or 5 ecu if blue -20.6 25 40 ecu if pink or 30 ecu if blue 90 ecu if pink or 5 ecu if blue -25.5 26 40 ecu if pink or 30 ecu if blue 100 ecu if pink or 5 ecu if blue -32.5 27 40 ecu if pink or 30 ecu if blue 110 ecu if pink or 5 ecu if blue -39.5 28 40 ecu if pink or 30 ecu if blue 130 ecu if pink or 5 ecu if blue -53.5
SERIES 3 Option A: 5 pink + 5 blue Option B: 5 pink + 5 blue
29 receive 25 ecu if pink or lose 4 ecu if blue receive 30 ecu if pink or lose 21 ecu if blue 6 30 receive 4 ecu if pink or lose 4 ecu if blue receive 30 ecu if pink or lose 21 ecu if blue -4.5 31 receive 1 ecu if pink or lose 4 ecu if blue receive 30 ecu if pink or lose 21 ecu if blue -6 32 receive 1 ecu if pink or lose 4 ecu if blue receive 30 ecu if pink or lose 16 ecu if blue -8.5 33 receive 1 ecu if pink or lose 8 ecu if blue receive 30 ecu if pink or lose 16 ecu if blue -10.5 34 receive 1 ecu if pink or lose 8 ecu if blue receive 30 ecu if pink or lose 14 ecu if blue -11.5 35 receive 1 ecu if pink or lose 8 ecu if blue receive 30 ecu if pink or lose 11 ecu if blue -13
Table 2: Descriptive statistics of covariates
Description Mean value Std. Dev.
Age Age (in years) 33.63 9.80
Gender Dummy if female 0.25 0.45
Married Marital Status 0.53 0.50
Number of children How many children do you have 1.51 1.94
Muslim of muslim religion 0.83 0.37
Iraq country of birth==Iraq 0.22 0.42
Syria country of birth==Syria 0.56 0.50
Other Country country of birth==other 0.32 0.46
Migration duration year since flee the country 2.97 4.26
Primary edu level==Primary level 0.11 0.32
Secondary edu level==Secondary level 0.49 0.50
College (University) edu level==College or University 0.36 0.48
Other education other education 0.02 0.14
In work ever worked 0.51 0.50
No income income range== 0.0000 0.28 0.45
Income Range (less than 200) income range==less than 200 euros 0.05 0.22 Income Range (200-400) income range==200-400 euros 0.12 0.33 Income Range (400-600) income range==400-600 euros 0.20 0.40 Income Range (over 600) income range==over 600 euros 0.35 0.48
Nb. of obs. 206
Table 3: Calculation of CPT parameters using the interval approach
Baseline
Mean Std. Err. 95% Conf. Int. Wald test: parameter=1
sigma 0.708*** 0.034 0.641,0.775 0.000***
lambda 2.109*** 0.183 1.748,2.469 0.000***
gamma 0.923*** 0.025 0.875,0.972 0.002***
Nb. of obs. 205
For Wald tests, the number displayed is the p-value. * p<0.1, ** p<0.05, *** p<0.01
![[PDF] Support de cours de C++ pour tout niveau | Cours informatique](data:image/gif;base64,R0lGODlhAQABAIAAAP///wAAACH5BAEAAAAALAAAAAABAAEAAAICRAEAOw==)