Supplementary Materials and Methods
Clinical Sites and Investigators
Site Principal Investigator Co-Investigator Severance Hospital
Division of Gastroenterology Department of Internal Medicine Yonsei University College of Medicine Seoul, Korea
Prof. Si Young Song, MD, PhD
Prof. Tae Il Kim, MD, PhD Department of Internal Medicine
Seoul National University College of Medicine Seoul, Korea
Prof. Joo Sung Kim, MD, PhD
Asan Medical Center
Department of Gastroenterology University of Ulsan College of Medicine Seoul, Korea
Prof. Seung-Jae Myung, MD, PhD
Centre Hospitalier Universitaire Vaudois
Département de médecine interne Service de Gastro-entérologie et d'Hépatologie
Lausanne, Switzerland
Prof. Gian Dorta, MD Dr Cristina Nichita, MD
Kantonsspital St.Gallen
Abt.Gastroenterologie/Hepatologie Kantonsspital St.Gallen
St.Gallen, Switzerland
Prof. Jan Borovicka, MD
Kantonsspital Liestal
Gastroenterology, Hepatology and Nutrition Department University Hospital Liestal, Switzerland
Prof. Rémy Meier MD Dr Anna-Maria Kunz, MD
Dr Julia Pilz, MD Dr Emanuel Burri, MD
Spital Thun Gastroenterologie
Facharzt für Innere Medizin und Gastroenterologie
Thun, Switzerland
Dr Boudewijn van der Weg, MD Dr Andreas Frenzer, MD Dr Daniel Rauch, MD Universitätsspital Basel Department of Biomedicine Basel, Switzerland
Prof. Christoph Beglinger, MD
Ensemble Hospitalier de la Côte Service de Chirurgie Morges, Switzerland Dr Cédric Vallet, MD Clinique Cecil Lausanne, Switzerland Dr Philippe Maerten, MD
Ethics Committees and IRB
Switzerland
Cantons of Bern (No KEK 139/10) St. Gallen (No. EKSG 10/091/1B) Basel (No. EKBB 242/10)
Vaud (No. VD 77/10)
South Korea
The Severance Hospital, Yonsei University College of Medicine, (No. 4-2010-0128)
Asan Medical Centre, University of Ulsan College of Medicine, Seoul, (IRB No. 2010-0221)
Institutional Bioethics Review Board of Seoul National University Hospital, (IRB No. H-1004-020-315)
Central Pathology Board
Site Responsible Pathologist Basel University Hospital,
Molecular Pathology Division Institute of Pathology, Basel, Switzerland
Prof. Luigi Terracciano, MD
Samsung Medical Centre, Department of Pathology, Seoul, Korea
Prof. Seok-Hyung Kim, MD
University of Kentucky, Lexington, KY, USA
Prof. Eun Lee, MD
Number of Recruited Subjects in the Swiss Hospitals
Site Numbers Total Control AP CRC Others Centre Hospitalier Universitaire Vaudois (Lausanne)
Kantonsspital St.Gallen (St. Gallen) Kantonsspital Liestal (Liestal) Spital Thun (Thun)
Universitätsspital Basel (Basel)
Ensemble Hospitalier de la Côte (Morges) Clinique Cécil (Lausanne)
207 26 34 52 19 5 6 88 9 3 38 5 0 6 61 6 18 7 11 0 0 58 11 13 7 3 5 0 263 31 32 85 20 1 1
Manufacturers of the equipment mentioned in the Laboratory Procedures section.
Procedure Equipment Manufacturer
PBMC pellets resuspension RNAlater® Solution Life Technologies, Carlsbad, CA Automated purification of total RNA QIAcube by RNeasy Mini kit QIAGEN, Venlo, The
Netherlands RNA integrity analysis Agilent 2100 Bioanalyzer Agilent Technologies, Santa
Clara, CA RNA reverse transcription into cDNA SuperScript® VILO cDNA Synthesis
Kit Invitrogen, Life Technologies, Carlsbad, CA PCR reactions RealTime ready Custom RT-qPCR
assays Roche, Basel, Switzerland
PCR reactions RealTime Ready™ DNA Probes
Master Mix Roche, Basel, Switzerland
CEA, CYFRA21-1, CA125 and CA19-9
Predictive Algorithm Development
The final predictive algorithms were defined on the training and validation sets, which
included 120 and 61 samples, respectively, (Figure 1).
Firstly, we defined an algorithm based on the 29-gene expression profiles. We refer
to it as a multi-gene multi-classifier (MGMC) algorithm since our algorithm definition
strategy envisaged the combination of multiple classifiers. This choice was based on
the fact that there is not a single optimal classification method and that model
combination can improve the robustness and stability of the test and its accuracy
31,32
.
The process could be broken into the following steps:
1. Classifier generation on the training set. In order to define optimal classifiers for
different classification problems, the following data subsets were used for model
fitting: Controls + CRC stage I-IV, Controls + LAP, Controls + CRC stage I-II,
Controls + Advanced Neoplasia (LAP+CRC I-IV). 144 statistical and 7200 fuzzy
classifiers were generated and internally validated by non-overlapped bootstrap.
1000 random datasets were drawn with replacement with the same size as the
training set. The model was re-fitted on each bootstrap and validated on the
out-of-bag samples. The specificity and sensitivity average values over 1000
bootstraps were calculated, Receiver Operating Characteristics (ROC) curves
were generated and the area under the curve (AUC) was calculated. External
validation on an independent validation set and performance estimation.
2. Selection of the best performing classifiers. Twelve classifiers (6 statistical and 6
fuzzy models) where selected according to the highest and most stable accuracy.
Stable classifiers were defined as the ones showing the minimum distance for
sensitivity and specificity across training, bootstrap and validation set.
3. To define the MGMC algorithm we repeated steps 1-3, using the 12 classifiers as
variables instead of the 29 biomarkers.
Among several tested MGMCs, only one was retained and tested on the
independent test sets. The final MGMC algorithm combines 5 classifiers fitted on
different classification problems and releases a binary result which suggests the
presence or absence of colorectal neoplasia.
Once the MGMC algorithm was defined, we combined it with tumor protein
markers, to give rise to a MGMC-Protein (MGMC-P) algorithm. First, the Wilcoxon
rank test was applied to CEA, CYFRA21-1, CA125 and CA19-9 plasma
concentrations, using the same data subsets described above, to select the most
significant tumor markers for CRC discrimination from the control group. For
selected markers, a cut-off value was defined by ROC curve analysis and by
optimal trade-off selection between sensitivity and specificity. They were then
combined with the MGMC algorithm, using a simple decision tree classification
approach. The node rules were set in such a way that the sensitivity of the MGMC
algorithm was maintained and the specificity was complemented and improved. The
selection and validation of the MGMC-P algorithm followed steps 1-3 described
above.
Supplementary Table 1. The 29-gene panel for colorectal cancer and large adenoma detection. Gene expression profiles obtained from the training set were explored by univariate analysis to compare the behavior of the 29 genes across the control (CON), the CRC and the LAP groups. Twelve genes were significantly differentially expressed in CRC and LAP compared to controls (p-value<0.05) by Wilcoxon rank test, applied to normalized gene expressions. Relative abundance of a gene transcript is represented by the fold change (FC), defined as 𝐹𝐹𝐹𝐹𝑔𝑔𝑔𝑔𝑔𝑔𝑔𝑔 = 2∆∆𝐶𝐶𝐶𝐶 , where ∆∆𝐹𝐹𝐶𝐶 = 𝑚𝑚𝑚𝑚𝑚𝑚𝑚𝑚(∆𝐹𝐹𝐶𝐶𝐷𝐷𝐷𝐷𝐷𝐷𝑔𝑔𝐷𝐷𝐷𝐷𝑔𝑔) − 𝑚𝑚𝑚𝑚𝑚𝑚𝑚𝑚(∆𝐹𝐹𝐶𝐶𝐶𝐶𝐶𝐶𝑔𝑔𝐶𝐶𝐶𝐶𝐶𝐶𝐶𝐶).
Gene Description Biological Function CRC/CON p-value CRC/CON FC LAP/CON p-value LAP/CON FC
S100 calcium binding protein A8 Cytokine / Chemotaxis/inflammation 5.07E-06 1.7 1.79E-01 1.1
interleukin 1, beta Cytokine / Chemotaxis/inflammation 4.19E-04 2.1 1.23E-03 1.7
chemokine (C-C motif) receptor 1 Cell signal
transduction/Chemotaxis/Inflammation
4.42E-04 1.7 6.85E-03 1.3
prostaglandin-endoperoxide synthase 2 Lipid metabolism/Inflammation 7.68E-04 2.1 6.85E-03 1.6
peroxisome proliferator-activated receptor
gamma Transcription Regulation/ Proliferation/ Differentiation 3.59E-03 1.4 1.36E-01 1.1 mitogen-activated protein kinase 6 Cell signaling/Proliferation 3.95E-03 1.2 6.01E-02 1.1
tumor necrosis factor (ligand) superfamily,
member 13b Cytokine/ Chemotaxis/inflammation 1.03E-02 1.2 7.82E-03 1.2 calcium channel, voltage-dependent, beta 4
subunit Cell signal transduction/Ion transport 1.31E-02 -1.3 4.24E-01 -1.1 matrix metallopeptidase 11 (stromelysin 3)
Protease/ Matrix remodelling
1.66E-02 -1.3 7.60E-02 -1.2
lactotransferrin Antimicrobial/Iron transport 2.14E-02 2.4 6.71E-02 1.6
CD63 molecule Signal transduction 3.14E-02 1.1 2.18E-02 1.1
carboxylesterase 1 Esterase/ Drug metabolism 5.70E-02 1.2 5.05E-01 -1.0
chemokine (C-X-C motif) ligand 10 Cytokine / Chemotaxis/inflammation 7.13E-02 -1.3 4.43E-01 1.1
mitogen-activated protein kinase kinase 3 Cell signaling/Proliferation 9.89E-02 1.1 3.47E-02 1.1
matrix metallopeptidase 9 (gelatinase B) Protease/ Matrix remodelling 1.21E-01 1.4 9.06E-01 -1.0
B-cell CLL/lymphoma 3 Transcription Regulation/ Cell Cycle 1.67E-01 1.1 7.82E-01 -1.1
ras homolog gene family, member C Transcription Regulation/Motility 2.02E-01 -1.1 1.58E-01 1.1
chemokine (C-X-C motif) ligand 11 Cytokine / Chemotaxis/inflammation 3.20E-01 -1.2 4.08E-01 1.1
prostaglandin E synthase Lipid metabolism/Inflammation 3.28E-01 -1.3 7.82E-01 1.0
early growth response 1 Transcription Regulation/Proliferation 3.79E-01 1.4 7.94E-02 1.7
integrin, alpha 2 (CD49B) Cell signal transduction/Cell adhesion 3.90E-01 1.2 5.84E-01 1.2
jun proto-oncogene Transcription Regulation/Proliferation 5.61E-01 -1.1 5.64E-01 -1.1
GATA binding protein 2 Transcription
Regulation/Proliferation/Differentiation
6.40E-01 -1.1 7.36E-01 1.1
non-metastatic cells 1, protein (NM23A) Transcription Regulation/ Cell Cycle 7.39E-01 1.0 4.75E-01 1.0
integrin, beta 5 Cell signal transduction/Cell adhesion 7.85E-01 1.1 5.05E-01 1.1
chemokine (C-X-C motif) receptor 3 Cell signal
transduction/Chemotaxis/inflammation
8.04E-01 -1.0 8.84E-01 -1.0
FXYD domain containing ion transport
regulator 5 Cell signal transduction/Ion transport 9.48E-01 1.0 8.52E-01 -1.0 male-specific lethal 1 homolog (Drosophila) Transcription Regulation /Histone
acetyltransferase
9.60E-01 -1.0 2.07E-01 1.0
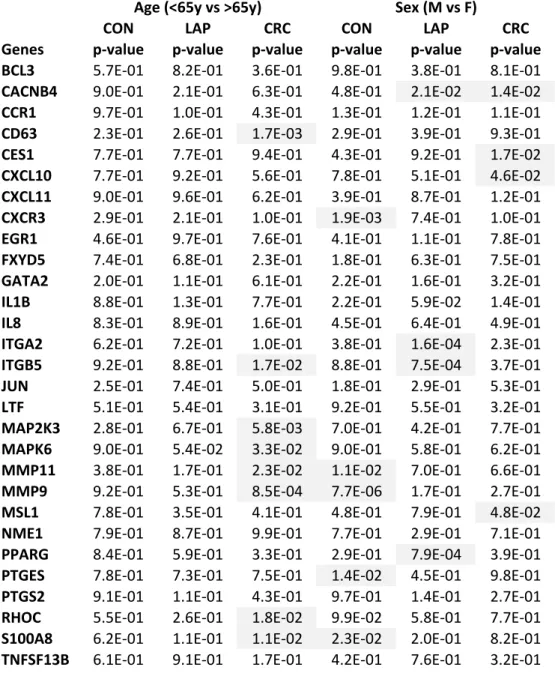
Table S2. Gene expression analysis of the 29 biomarkers according to age and sex in the 3 main study groups.
Two sided t-‐test was used to test genes differentially expressed between subjects younger or older than 65 years or between males and females. Statistical significance threshold was set at 0.05.
CON LAP CRC CON LAP CRC
Genes p-‐value p-‐value p-‐value p-‐value p-‐value p-‐value
BCL3 5.7E-‐01 8.2E-‐01 3.6E-‐01 9.8E-‐01 3.8E-‐01 8.1E-‐01
CACNB4 9.0E-‐01 2.1E-‐01 6.3E-‐01 4.8E-‐01 2.1E-‐02 1.4E-‐02
CCR1 9.7E-‐01 1.0E-‐01 4.3E-‐01 1.3E-‐01 1.2E-‐01 1.1E-‐01
CD63 2.3E-‐01 2.6E-‐01 1.7E-‐03 2.9E-‐01 3.9E-‐01 9.3E-‐01
CES1 7.7E-‐01 7.7E-‐01 9.4E-‐01 4.3E-‐01 9.2E-‐01 1.7E-‐02
CXCL10 7.7E-‐01 9.2E-‐01 5.6E-‐01 7.8E-‐01 5.1E-‐01 4.6E-‐02 CXCL11 9.0E-‐01 9.6E-‐01 6.2E-‐01 3.9E-‐01 8.7E-‐01 1.2E-‐01 CXCR3 2.9E-‐01 2.1E-‐01 1.0E-‐01 1.9E-‐03 7.4E-‐01 1.0E-‐01
EGR1 4.6E-‐01 9.7E-‐01 7.6E-‐01 4.1E-‐01 1.1E-‐01 7.8E-‐01
FXYD5 7.4E-‐01 6.8E-‐01 2.3E-‐01 1.8E-‐01 6.3E-‐01 7.5E-‐01 GATA2 2.0E-‐01 1.1E-‐01 6.1E-‐01 2.2E-‐01 1.6E-‐01 3.2E-‐01
IL1B 8.8E-‐01 1.3E-‐01 7.7E-‐01 2.2E-‐01 5.9E-‐02 1.4E-‐01
IL8 8.3E-‐01 8.9E-‐01 1.6E-‐01 4.5E-‐01 6.4E-‐01 4.9E-‐01
ITGA2 6.2E-‐01 7.2E-‐01 1.0E-‐01 3.8E-‐01 1.6E-‐04 2.3E-‐01 ITGB5 9.2E-‐01 8.8E-‐01 1.7E-‐02 8.8E-‐01 7.5E-‐04 3.7E-‐01
JUN 2.5E-‐01 7.4E-‐01 5.0E-‐01 1.8E-‐01 2.9E-‐01 5.3E-‐01
LTF 5.1E-‐01 5.4E-‐01 3.1E-‐01 9.2E-‐01 5.5E-‐01 3.2E-‐01
MAP2K3 2.8E-‐01 6.7E-‐01 5.8E-‐03 7.0E-‐01 4.2E-‐01 7.7E-‐01 MAPK6 9.0E-‐01 5.4E-‐02 3.3E-‐02 9.0E-‐01 5.8E-‐01 6.2E-‐01 MMP11 3.8E-‐01 1.7E-‐01 2.3E-‐02 1.1E-‐02 7.0E-‐01 6.6E-‐01
MMP9 9.2E-‐01 5.3E-‐01 8.5E-‐04 7.7E-‐06 1.7E-‐01 2.7E-‐01
MSL1 7.8E-‐01 3.5E-‐01 4.1E-‐01 4.8E-‐01 7.9E-‐01 4.8E-‐02
NME1 7.9E-‐01 8.7E-‐01 9.9E-‐01 7.7E-‐01 2.9E-‐01 7.1E-‐01
PPARG 8.4E-‐01 5.9E-‐01 3.3E-‐01 2.9E-‐01 7.9E-‐04 3.9E-‐01 PTGES 7.8E-‐01 7.3E-‐01 7.5E-‐01 1.4E-‐02 4.5E-‐01 9.8E-‐01 PTGS2 9.1E-‐01 1.1E-‐01 4.3E-‐01 9.7E-‐01 1.4E-‐01 2.7E-‐01
RHOC 5.5E-‐01 2.6E-‐01 1.8E-‐02 9.9E-‐02 5.8E-‐01 7.7E-‐01
S100A8 6.2E-‐01 1.1E-‐01 1.1E-‐02 2.3E-‐02 2.0E-‐01 8.2E-‐01 TNFSF13B 6.1E-‐01 9.1E-‐01 1.7E-‐01 4.2E-‐01 7.6E-‐01 3.2E-‐01
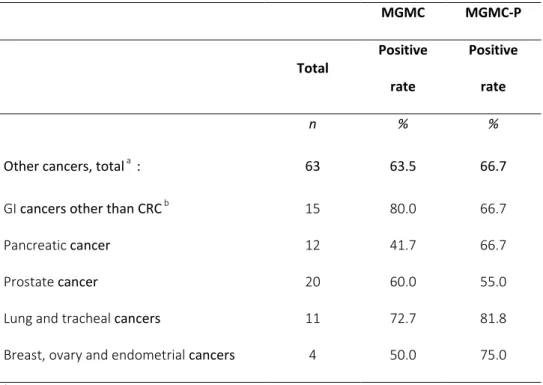
Table S3. Positive rate of the MGMC and MGMC-P algorithms for
non-colorectal cancers
MGMC MGMC-P Total Positive rate Positive rate n % %Other cancers, total a : 63 63.5 66.7
GI cancers other than CRC b 15 80.0 66.7
Pancreatic cancer 12 41.7 66.7
Prostate cancer 20 60.0 55.0
Lung and tracheal cancers 11 72.7 81.8
Breast, ovary and endometrial cancers 4 50.0 75.0
a
One metastatic cancer of unknown origin
b
Five Esophageal, 4 Gastric, 3 Liver, 2 Bile duct and 1 Duodenal cancer
Supplementary Table S4.
Positive rate of the predictive MGMC and MGMC-P algorithms applied to non per-protocol cases.
MGMC MGMC-P Total Positive Positive
n (% % Controlsa 16 6.2 6.2 LAPb 23 56.5 52.1 CRC c 21 90.5 85.7 CRC stage unknown 8 50.0 50.0 AP<1cmb 48 35.4 31.2
Other medical conditions
and diseasesd 42 54.7 40.5
Other cancerse 30 70.0 66.6
a These subjects presented with a personal history of polyps or asthma with
ongoing treatment
b Most of the cases presented with concomitant hyperplastic polyps,
inflammatory diseases or gallstones
C The majority of the cases presented with concomitant gallstones, bacterial
infections under treatment or other types of cancer.
d Cases were presenting with abnormal laboratory parameters, transplantation,
co-morbidities including inflammatory and/or autoimmune disease, etc.
e Most of the cases presented concomitant adenomas, bacterial infections
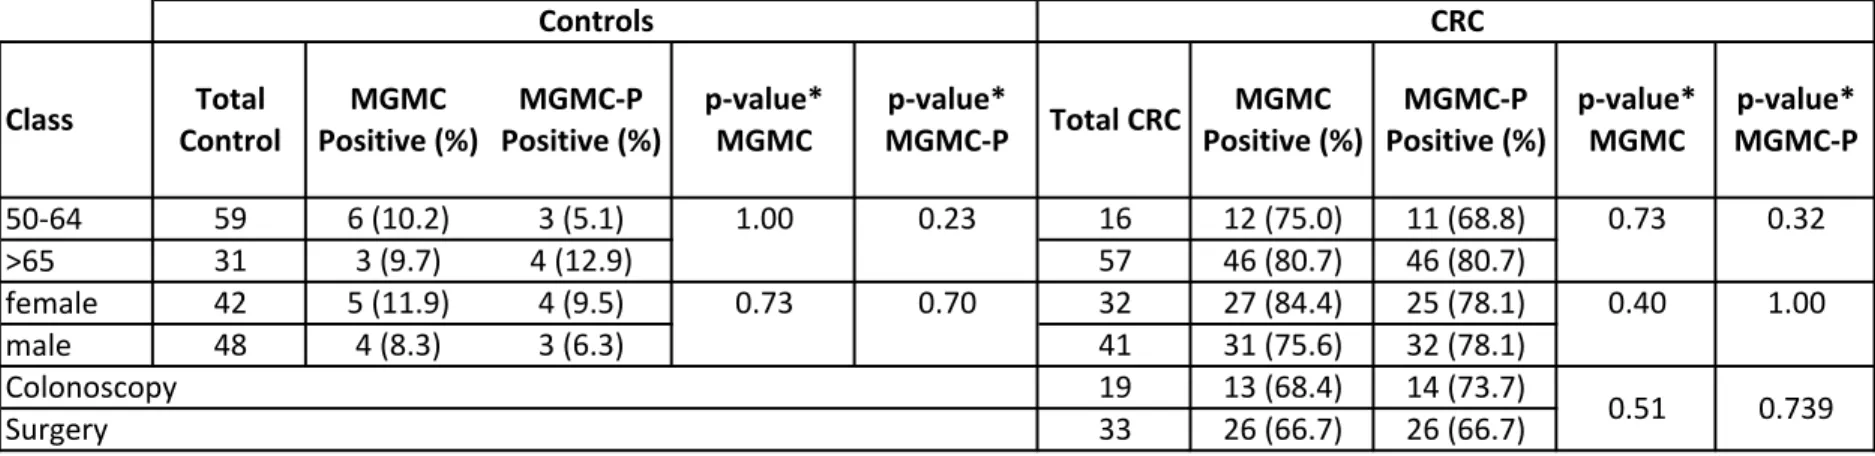
Variable Class ControlTotal Positive (%)MGMC Positive (%)MGMC-‐P p-‐value*MGMC MGMC-‐Pp-‐value* Total CRC Positive (%)MGMC Positive (%)MGMC-‐P p-‐value*MGMC MGMC-‐Pp-‐value* 50-‐64 59 6 (10.2) 3 (5.1) 16 12 (75.0) 11 (68.8) >65 31 3 (9.7) 4 (12.9) 57 46 (80.7) 46 (80.7) female 42 5 (11.9) 4 (9.5) 32 27 (84.4) 25 (78.1) male 48 4 (8.3) 3 (6.3) 41 31 (75.6) 32 (78.1) 19 13 (68.4) 14 (73.7) 33 26 (66.7) 26 (66.7) * two sided Fisher's exact test, p>0.05 is considered statistically significant
Sex
0.32
0.73 0.70 0.40 1.00
1.00 0.23 0.73
Table S5. Positivity of Colox test by age, sex and type of recrutment
Age Controls CRC 0.51 0.739 Type of recrutment Colonoscopy Surgery