HAL Id: hal-00607304
https://hal.archives-ouvertes.fr/hal-00607304v1
Submitted on 11 Jul 2011 (v1), last revised 12 Jan 2017 (v2)
HAL is a multi-disciplinary open access
archive for the deposit and dissemination of
sci-entific research documents, whether they are
pub-lished or not. The documents may come from
teaching and research institutions in France or
abroad, or from public or private research centers.
L’archive ouverte pluridisciplinaire HAL, est
destinée au dépôt et à la diffusion de documents
scientifiques de niveau recherche, publiés ou non,
émanant des établissements d’enseignement et de
recherche français ou étrangers, des laboratoires
publics ou privés.
Modeling Detection of HIV in Cuba
Hector de Arazoza, Rachid Lounes, Andres Sanchez, Jorge Barrios, Ying-Hen
Hsieh
To cite this version:
Hector de Arazoza, Rachid Lounes, Andres Sanchez, Jorge Barrios, Ying-Hen Hsieh. Modeling
Detec-tion of HIV in Cuba. IWANN 2011, Jun 2011, Malaga, Spain. pp.524-531,
�10.1007/978-3-642-21498-1_66�. �hal-00607304v1�
MODELING DETECTION OF HIV IN CUBA.
H´ector De Arazoza1,2, Rachid Lounes2, Andres S´anchez1, Jorge Barrios1, and
Ying-Hen Hsieh3
1
Facultad de Matem´atica y Computaci´on, Universidad de la Habana, Cuba. [email protected].
2
LaboratoireMAP5, UMR-CNRS 8145, University Paris Descartes, 45 rue des Saints-P`eres, 75270 Paris CEDEX 06, France. [email protected].
3
Department of Public Health and Center for Infectious Disease Education and Research, China Medical University Taichung, Taichung, Taiwan.
Abstract. A nonlinear compartmental model is developed for the HIV detection system in Cuba with different types of detections, some ran-dom and others non-ranran-dom. We analyze the dynamics of this system, compute the reproduction numbers, and use the data from the Cuban HIV/AIDS epidemic between 1986-2008 to fit the model. We obtain es-timates for the detection-related parameters during two separate time periods to reflect the timeline of the implementation of various types of searches. The reproduction numbers for each time period are also com-puted from the sets of values of the parameters. We found that random screening is most important as a mean of surveillance. Moreover, local asymptotic stability for the Disease Free Equilibrium can be achieved if (i) random screening is sufficiently effective and (ii) infection by detected HIV-positive individuals is minimal. Our results highlight the importance of education for the known infectious for the purpose of preventing fur-ther infection. Fitting the 1986-2008 HIV data to obtain the model pa-rameter estimates indicates that the HIV epidemic in Cuba is currently approaching an endemic equilibrium.
1
Introduction
The Cuban HIV/AIDS program was established in 1983 and the detection of the first HIV-positive person in Cuba took place in December 1985. The first AIDS case was diagnosed in Cuba in April 1986, this signaled the official start of the AIDS epidemic in the country.
The Cuban HIV/AIDS epidemic has the lowest prevalence rate in the Caribbean region [10]. The UNAIDS Epidemiological Fact Sheet on HIV and AIDS for Cuba reports an HIV prevalence of less than 0.1 % for adults [11].
The Cuban HIV/AIDS program includes a detection system that allows for de-tection of HIV-positive cases from several sources. Some of these sources were started at the beginning of the program, while others were introduced later and some have been discontinued in time. Since 1993, this detection system is com-posed, among others, of 6 major sources. These were screenings of all blood
donors, persons that were treated for other sexually transmitted infections, per-sons admitted to a hospital with a suspicion of HIV infection or subject to specific procedures like dialysis, persons that volunteered to be tested, persons having received a recommendation for HIV testing from his/her general practi-tioner (family doctor) and through sexual partner tracing. Other minor sources include testing of all pregnant women and prison inmates [3].
From 1986 up to 2008 more than 34 million tests were performed, in recent years since 2002, the total number of tests performed has stabilized to 1.6-1.7 million test every year [12]. From 1986, in keeping with the ”partner notification pro-gram”, a person tested to be HIV-positive is invited to give names and contact details of his/her sexual partners during the past two years. These partners are then traced and a recommendation for voluntary HIV testing is made.
The detection system has changed over the years. For example, during the pe-riod 1986-1999, the partner notification and contact tracing detected 30.7% of the new HIV infections while the Family Doctors Program detected only 8.9% of new infections reported. From 2000 and up to September 2008, the family doc-tors were responsible for the detection of 31.7% of the new cases while contact tracing detected 20.4% of the new cases. From this information we can deduce that the detection system is not static in terms of the contribution to the detec-tion of new HIV cases. Before 1999 the most important contribudetec-tion was from the contact tracing and partner notification program, while after 1999 the family doctors play a dominant role in the detection system. We will focus on modeling this change in the detection system by dividing the time period into two periods and introducing model parameters that will differentiate the detection by the family doctors from contact tracing and other (random) searches.
2
The model
As noted earlier, the primary objective of the Cuban Program to control the HIV/AIDS epidemic is the active search of persons infected with HIV long before they show any signs of AIDS. Our focus is not to model how new infections by HIV are generated, but how the HIV-infected persons are detected. We will consider the following variables and parameters.
Model Variables: X(t) the number of HIV infected persons that do not know they are infected (at time t), Y (t) the number of HIV infected persons that know they are infected, Z(t) the number of persons with AIDS.
Model Parameters:
1. λ the rate of recruitment of new HIV infected persons infected by X, 2. λ′ the rate of recruitment of new HIV infected persons infected by Y ,
3. k1, k2and k3rates at which the unknown HIV infected persons are detected
by the system through different methods of detection.
4. β the rate at which the undetected HIV-positive persons develop AIDS, reciprocal of the mean incubation
5. β′ the rate at which the detected HIV-positive persons develop AIDS, the
6. µ the mortality rate of the sexually active population, 7. µ′ the mortality rate of the population with AIDS.
The dynamics is described by the following system: dX dt = λX + λ ′Y − k 1X − k2XY − k3X2− βX − µX, dY dt = k1X + k2XY + k3X 2 − β′Y − µY, (1) dZ dt = βX + β ′Y − µ′Z.
We denote γ = β + µ, σ = λ − k1− γ, γ′ = β′+ µ and we consider the system
only in the region D = {X ≥ 0, Y ≥ 0, Z ≥ 0}. It is clear that D is positively invariant under the flow induced by (1).
We give the following remarks regarding model (1):
1. There are three ways for individuals to go from ”unknown HIV infected” (X) to ”known HIV infected” (Y ). One is through the nonlinear term k2XY
for contact tracing, where the individual is found through his contacts with persons that are known to live with HIV. The term k3X2models the
detec-tion through family doctors. The third way they can be detected is through the term k1X which models all the other ”random” ways of searching for
seropositives. It is important to note that 1/k1 can be viewed as the mean
time from infection to detection for the persons found through a random screening. We can look at all the ways that an ”unknown” can go from X to Y as a term of the form ”F (X, Y ) X”, where F (X, Y ) is a recruitment function from the class X into the class Y . For our study we take F (X, Y ) as a polynomial of degree 1: k1+ k2Y + k3X.
2. We assume that the known HIV-infected persons are infectious, but at a much lower rate than those that do not know they are infected due to edu-cation or change of behavior.
3. We assume that once a person develops AIDS it is no longer infectious. We consider the following two cases:
Case 1. If λ′− γ′= 0, the system has a disease-free equilibrium P0= (0, 0, 0) if
σ +k1= λ−γ 6= 0 and a set of endemic equilibria P∗= (X∗, Y∗, Z∗) of the form
(λ′− k
2X∗)Y∗+ (σ + k3X∗)X∗= 0 and Z∗= βX ∗+β′Y∗
µ′ if σ + k1= λ − γ = 0.
Case 2. If λ′− γ′ 6= 0, the system has two equilibria, P
0= (0, 0, 0) is the
disease-free equilibrium and P∗= (X∗, Y∗, Z∗) is the endemic equilibrium.
Set R1= λ′ γ′ , R2= λ γ and R0= k1 k1+ γ R1+ γ k1+ γ R2. (2) Then X∗= γ′(k1+ γ)(R0− 1) γk2(R2− 1) + γ′k3(1 − R1) , Y∗= X∗ γγ′ R2− 1 1 − R1 , Z∗= βX∗+ β′Y∗ µ′ .
The endemic equilibrium is feasible if and only if R0− 1, R2− 1 and 1 − R1
have the same sign.
The parameters R0, R1 and R2 play a significant role in the analysis of the
behaviour of trajectories for (1).
Since Case 1 requires specific values of the parameters and hence is of little practical importance, we will suppose that λ′− γ′6= 0.
The analysis of the stability of the equilibria points and the asymptotic behaviour of the trajectories is given in Table 1.
Table 1: Asymptotic states for the model. ”GAS” denotes equilibrium is globally asymptotically stable, ”LAS” denotes it is locally asymptotically stable and ”N E” denotes equilibrium does not exist in the domain.
R0 R1 R2 P0 P∗ (X, Y, Z) →
<1 <1 <1 GAS NE P0
<1 <1 >1 GAS NE P0
<1 >1 <1 LAS unstable P0 or unbounded
>1 <1 >1 unstable GAS P∗
>1 >1 <1 unstable NE unbounded >1 >1 >1 unstable NE unbounded
3
Conclusions
In this work, we have identified three threshold parameters of epidemiological importance, namely R0, R1, and R2, for the dynamic behavior of the system
in question. A summary of their respective roles in the asymptotic state of the system is given in Table 1. Previous modeling studies of HIV with secondary reproduction numbers includes [5], [6] and [8]. The biological interpretations of these parameters is the following. R0 gives the number of infections by an
in-fective who is detected via random screening; R1 is the number of infections
caused by an infective after he/she has been tested positive for HIV; and R2
is the number of infections caused by an infective that is not detected during asymptomatic period, i.e., if an infective either develops AIDS-related illness or pass away before progression to AIDS. We note that R0can be considered as the
basic reproduction number, if we do not consider the detection of HIV-positive individuals in Cuba as part of disease surveillance instead of an intervention mea-sure, especially in light of the realistic model assumption that those detected to be HIV-positive can still infected others, albeit at a lower level, before the onset of AIDS-defined illnesses [2]. Moreover, R0determines whether the DFE (P0) is
locally asymptotically stable, as is the typical role of a basic reproduction num-ber. R1 and R2 are secondary reproduction numbers, which help us determine
the asymptotic behavior of the system, often relating to the endemic equilibrium. In the present model, whether R1 is larger than unity determines the existence
in combination with R2 > 1 ensure the existence of a globally asymptotically
stable equilibrium P∗. Serving as threshold parameters for the model system,
these reproduction numbers have an obvious and epidemiologically meaningful interpretation. For the proposed model of detection and surveillance of HIV epi-demic in Cuba, our results indicate that random screening is most important as a mean of surveillance, since the number of infections due to an infective detected through random determines whether the DFE is (locally) asymptotically stable. In other words, if the averaged total number of infections by an infective detected through random screening exceeds one, then there will always be an epidemic. On the other hand, local asymptotic stability for the DFE can be achieved (i.e., R0 can be brought down to less than one) if: (i) random screening is sufficiently
effective (k1 large), and (ii) new infections by detected HIV-positive individuals
is minimal (λ′ small). Our results further highlight the importance of the
edu-cation for the known infectious, in light of the second threshold parameter R1.
If the known infectious do not change, through education, their behavior and continue to practice risky sexual habits and their infection rate is still high (i.e., λ′ sufficiently large) so that the average number of infections by a known
infec-tive (R1) exceeds unity, then the endemic equilibrium is always unstable and
there is always a possibility for the total number of infectious (i.e., X + Y ) to increase without bound. This is true even when R0< 1, provided that the initial
population sizes are outside the domain of attraction of the DFE. This scenario of adverse impact of public health measures, which had been shown previously to be theoretically possible in [1], [9], is only possible if k1 is sufficiently small
compared to γ, knowing that R0 is a convex combination of R1 and R2 (see
2). In other words, an ill-designed detection system might adversely lead to the epidemic increasing without bound if (i) random screening is not comprehensive enough (k1 too small); (ii) lack of an education program to change behavior (λ′
too high); and (iii) the prevalence is too high when the system is first imple-mented (initial infective populations outside of the domain of attraction of the DFE). This result further highlights the importance of universal testing in high-prevalence regions [4], [7]. On the other hand, if through an adequate education to change the behavior of the known infectious (so that λ′ is sufficiently low) the
average number of infections by a known infective is less than one, then either the DFE P0 or the endemic equilibrium P∗ is globally asymptotically stable,
leading to a more manageable epidemic for the public health purposes, even if the disease is not eradicated.
3.1 Application to the Cuban HIV/AIDS data.
The modeling results are clearly relevant to our understanding of the current state of the HIV epidemic in Cuba. We will use the model (1) to fit the data of the known HIV positives and AIDS cases in Cuba. We have divided the period 1986-2008 into two different time periods, namely 1986-1999 and 1999-2008, to take into account the introduction of the family doctors in the detection system. In each period we have parameters that can be estimated from the data. These are β, β′, µ, µ′ and X(0). Y (0) and Z(0) are known. In previous work [2], [8]
estimates for λ and λ′ have been obtained.
The family doctors program had actually started after 1990, but only as a pilot project where the family doctors typically did not prescribe HIV testing. It is only after 1999 that detection through the family doctors started to take on an important role in the yearly detection figures, arriving at more than 30% of new detections in a year. Another significant difference between the two pe-riods chosen is λ′. In the first years (1986-1999) the sanatorial system played
an important role in preventing HIV transmission from persons that had been detected. Hence we suppose that there is practically no transmission from the persons living with HIV (Y ) and assume λ′= 0 for the first period.
We fit the model to the data to obtain values for k1, k2 and k3 by minimizing
an error function. As traditional optimization methods failed to work properly we used a genetic algorithm approach to find an initial point for starting the optimization method using a gradient method. To compute standard errors for the parameters, 200 fitting runs were made using different values of the known parameters, taken randomly from their confidence interval.
Using PET a software written on MATLAB, we obtain the least-square estimates for the unknown model parameters (k1, k2 and k3), for each of the two periods
of the Cuban HIV epidemic from 1986 to 2008, by fitting the Cuban HIV data of the persons known to live with HIV to the model as described previously. Here the resulting numbers for 1999 obtained from the first stage of estimation using data from 1986-1999 were used as initial values for the second stage of estimation using the 1999-2008 data. The estimated mean values of the parameters k1, k2,
and k3for each of the two periods with 95% confidence intervals, obtained from
the 100 best fits, are given in Table 2.
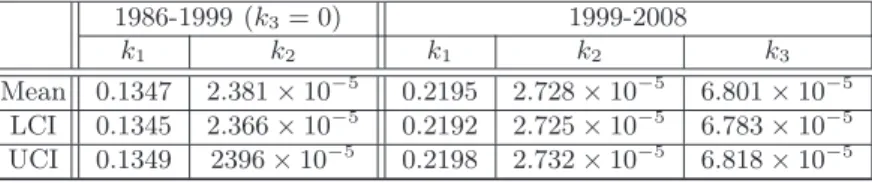
Table 2: Estimated mean values with the 95% confidence intervals for parameters k1, k2 and k3 for both periods. UCI and LCI denote the respective upper and
lower bounds for the 95% confidence intervals..
1986-1999 (k3= 0) 1999-2008
k1 k2 k1 k2 k3
Mean 0.1347 2.381 × 10⁻⁵ 0.2195 2.728 × 10⁻⁵ 6.801 × 10⁻⁵
LCI 0.1345 2.366 × 10⁻⁵ 0.2192 2.725 × 10⁻⁵ 6.783 × 10⁻⁵
UCI 0.1349 2396 × 10−5 0.2198 2.732 × 10⁻⁵ 6.818 × 10⁻⁵
We can also compute the theoretical values of the number of the unknown per-sons living with HIV, X(t), from the estimation results. For the unknown X we have between 2300 and 2400 at the end of 2008. By comparing the estimated results for the two periods, we conclude that detection by random screening (k1) improved significantly after 1999, perhaps reflecting the steeper increase in
reported cases after 2000 [3], while detection via contact tracing (k2) was at a
doctors (k3) was slightly higher than that of contact tracing after 1999 but of
similar magnitude. Both the analytical result (of the dynamics) and the data-fitting parameter estimates indicate that random screening was the most effective route of detection, while contact tracing and family doctors played mainly sec-ondary roles, as had been previously proposed in [7]. The estimated values of the parameters in the model also allow us to calculate the three reproduction numbers, R0, R1, and R2, with the 95% confidence intervals for each of the two
time periods which are given in Table 3
Table 3: Estimated mean values with the 95% confidence intervals for R0, R1,
and R2. UCI and LCI denote the respective upper and lower bounds for the 95%
confidence intervals. .
1986-1999 1999-2008 R0 R1 R2 R0 R1 R2
LCI 1.824 0 4.446 1.858 0.762 4.428 UCI 1.837 0 4.665 1.859 0.765 4.434
As we can see, for both time periods the Cuba HIV epidemic is in the case of R0 > 1, R1 < 1 and R2 > 1. P0 is unstable and P∗ is globally
asymptoti-cally stable with the trajectories approaching P∗ asymptotically. Hence we can
conclude that the HIV epidemic in Cuba is approaching (in the long term) an endemic steady state which we can estimate from our parameters using the ex-pression obtained from our modeling for P∗ = (X∗, Y∗, Z∗) given in Equation
(2). That is, assuming no drastic changes in the prevention, transmission, de-tection, or treatment of HIV in Cuba in the long term future, there could be, eventually, around 2700 persons living with HIV that do not know they are in-fected. Further noting that the theoretical number of unknown persons living with HIV from the model is a little under 2400, we speculate with optimism that, at the endemic steady state, the number of persons living with HIV that represent the main core for the transmission of the epidemic in Cuba will not increase drastically, in the long term future.
The assumption that the parameters do not change in the long term is not a very real one, taking into account that every year new information is gained on the virus and that there is ample research on treatment, vaccines and other aspects that affect the dynamics of the epidemic. For example existing therapy reduces the probability of transmission for HIV, in terms of our model this means that coefficient λ′ is reduced and this will make R1 smaller, changing the value of
the asymptotic point. But therapy delays the onset of AIDS, this means that β′
gets smaller, also changing R1 but making it bigger. So long term predictions
(as in the case of asymptotic behavior) make sense only as an indicator of how is the epidemic going to behave. In this sense in table 1, we see that if R1 > 1
trajectories could become unbounded, and this would mean that the epidemic is out of control. It is very important to manage the value of R1.
2 steps for now) that also produce a change in the model itself, changing the recruitment function from X to Y , F (X, Y ), from a linear polynomial in Y for the period 86-99, to a linear polynomial in X and Y for the period 99-2008.
Acknowledgments:
This work was carried out during visits to the University of Paris Descartes by YHH and H de A. H de A, YHH and RL received support from the French ”Agence National pour la Recherche” project ”Viroscopy”. H de A also received support as visiting professor from the Laboratoire Paul Painlev´e of the Univer-sity Lille 1, France. H. de A., A.S. and J.B. received support from the Spanish AECID, from their projects PCI D/023835/09 and D/030223/10. For all the support we have received from all the different sources we are grateful.
References
1. R. M. Anderson, S. Gupta, and R. M. May. (1991) Potential of community-wide chemotherapy or immunotherapy to control the spread of HIV-1, Nature, 350: 356-359.
2. H. de Arazoza, R. Lounes. (2002) A non linear model for a sexually transmitted disease with contact tracing. IMA. J. Math. Appl. Med. Biol. 19:221-234.
3. H. de Arazoza, J. Joanes, R. Lounes, S. C. Legeai, Cl´emen¸con, J. P´erez and B. Auvert. (2007) The HIV/AIDS epidemic in Cuba: Description and tentative ex-planation of its low HIV prevalence. BMC Infectious Diseases 7:130, 1-6.
4. R.M. Granich, C.F. Gilks, C. Dye, K.M. De Cock and B.G. Williams. (2009) Uni-versal voluntary HIV testing with immediate antiretroviral therapy as a strategy for elimination of HIV transmission: a mathematical model. Lancet 373: 48-57. 5. Y.H. Hsieh and K. Cooke. (2000) Behavior Change and Treatment of Core Group
and Bridge Population: Its Effect on the Spread of HIV/AIDS. IMA J. of Math. Appl. Biol. Med. 17(3): 213-241.
6. Y.H. Hsieh, H. de Arazoza, R. Lounes and J. Joanes. (2005) A Class of Models for HIV Contact Tracing in Cuba: Implications for Intervention and Treatment. Deterministic and Stochastic Models for AIDS Epidemics and HIV Infection with Interventions. (Ed. W.Y. Tan). Singapore: World Scientific.
7. Y.H. Hsieh and H. de Arazoza. (2009) Correspondence to ”Universal voluntary HIV testing and immediate antiretroviral therapy”. Lancet; 373:1079-1080. 8. Y.H. Hsieh, Y.S. Wang, H. de Arazoza and R. Lounes. (2010) HIV Model with
Secondary Contact Tracing: Impact of the Partner Notification Program in Cuba. BMC Infectious Diseases 10:194, 1-9.
9. S.B. Hsu and Y.H. Hsieh. (2006) Modeling intervention measures and public re-sponse during SARS outbreak. SIAM J. Appl Math. 66(2):627-647.
10. J.A. Inciardi, J.L. Syvertsen, H.L. Surratt. HIV/AIDS in the Caribbean Basin. AIDS Care 2005, 17 Suppl 1:S9-25.
11. WHO: World Health Organisation: Cuba. Accessed: June 20, 2006. [http://www.who.int/countries/cub/en/].
12. MINSAP. ”CUBA:PLAN ESTRATEGICO NACIONAL ITS/VIH/SIDA 2007-2011”, 2006.
[http://www.sld.cu/galerias/pdf/servicios/sida/anexo 2, plan estrategico 2007-2011.pdf]