INTRODUCTION
Animals possess highly specialized sensory neurons that are capable of perceiving information about a continuously chang-ing environment. Measurchang-ing neuronal activity in these cells is an important step toward understanding the basic coding principles, as well as the spatial and temporal dynamics, of sensory systems. The fruit fly Drosophila melanogaster is widely used as a genetic model organism to uncover basic mechanisms of taste coding and odor perception1–7. Recent insights into the
molecular and functional mechanisms of sensory perception in
Drosophila have been achieved by the use of single-sensillum
recordings of adult taste or olfactory sensilla1,4,8–13. This method
enables sensitive measurements of action potential patterns and shows whether responses are excitatory or inhibitory, but drawing final conclusions about the individual firing neuron is difficult, as each sensillum contains two to four neurons14. In the larva,
multicellular electrophysiological measurements of the taste system have been performed, but this method is technically challenging and it is not clear how many taste neurons are housed in which sensillum15.
Microfluidic devices have been used previously to image com-mand interneurons (AVA) and sensory neurons (ASH) in the nematode Caenorhabditis elegans and for studies of axotomy in peripheral sensory neurons of Drosophila larvae16–18. To
imple-ment a similar strategy for Drosophila larval chemosensation, we developed a simple and widely applicable microfluidic chip. We used this custom-made microfluidic device to deliver pre-cise and temporally restricted tastant stimulation in the first published physiological characterization of individual larval gustatory receptor neurons (GRNs) expressing the calcium sensor GCaMP5 (ref. 19).
Development of the protocol
The design of the chip is simple. It contains a single channel that is connected to a chamber in which the sample can be mounted to bring it into contact with fluids in the channel. The chamber was originally designed to exactly fit the head of a third-instar
Drosophila larva; however, it is also suitable for the proboscis
or the leg of an adult fly. The channel for delivering stimulants is relatively broad, designed at a width of 1 mm to reduce flow pressure on the sample. We use a single-channel system in which changes of liquids are performed by the tubing system outside the chip, allowing a relatively slow flow rate inside the chip. Here we provide information required for the design and production of this microfluidic device (Fig. 1; Supplementary Data), as well as a detailed protocol for live imaging to acquire GCaMP-based calcium imaging (Figs. 2 and 3). By introducing the larval head, or the adult proboscis or leg, into the chamber, neuronal activity can be recorded while chemosensory neurons are in contact with the solution pumped through the channel (Figs. 2 and 3). Overview of the procedure
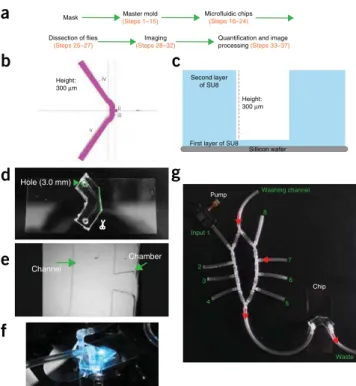
An overview of the workflow involved in implementing the pro-cedure is provided in Figure 1a. The microfluidic chip is designed using a layout program such as CleWin (Supplementary Data) and the design is used to fabricate a mask—for example, by chrome etching. This mask is then used to produce a resin (e.g., SU8) mold: the SU8 resin is spread onto a silicon wafer, with the desired thickness dependent on the required height of the microfluidic channels. Exposed areas of resin (i.e., those regions not protected by the opaque regions of the mask) are then hard-ened by exposure to UV light; unexposed (unhardhard-ened) areas of the mold are removed by applying a solvent. To fabricate the actual chip, a polydimethylsiloxane (PDMS) solution is poured onto the mold and allowed to solidify at high temperature before being detached from the mold. A single mold can contain multi-ple templates, allowing several PDMS microfluidic devices to be fabricated in parallel. The resulting PDMS block contains replicas of the microfluidic channels etched on the mask. Molds can be reused several times, and the chips can be cut and bonded to a cover slip. Subsequent imaging of the desired chemosensory neurons can be performed over several weeks and months, reus-ing the same chip.
A microfluidics-based method for measuring neuronal
activity in Drosophila chemosensory neurons
Lena van Giesen
1,2,4, G Larisa Neagu-Maier
1,4, Jae Young Kwon
3& Simon G Sprecher
11Department of Biology, Institute of Zoology, University of Fribourg, Fribourg, Switzerland. 2Department of Biology, Brandeis University, Waltham, Massachusetts, USA. 3Department of Biological Sciences, Sungkyunkwan University, Suwon, Republic of Korea. 4These authors contributed equally to this work. Correspondence should be
addressed to J.Y.K. ([email protected]) or S.G.S. ([email protected]).
Monitoring neuronal responses to defined sensory stimuli is a powerful and widely used approach for understanding sensory coding in the nervous system. However, providing precise, stereotypic and reproducible cues while concomitantly recording neuronal activity remains technically challenging. Here we describe the fabrication and use of a microfluidics system that allows precise temporally restricted stimulation of Drosophila chemosensory neurons with an array of different chemical cues. The system can easily be combined with genetically encoded calcium sensors, and it can measure neuronal activity at single-cell resolution in larval sense organs and in the proboscis or leg of the adult fly. We describe the design of the master mold, the production of the microfluidic chip and live imaging using the calcium sensor GCaMP, expressed in distinct types of Drosophila chemosensory neurons. Fabrication of the master mold and microfluidic chips requires basic skills in photolithography and takes ~2 weeks; the same devices can be used repeatedly over several months. Flies can be prepared for measurements in minutes and imaged for up to 1 h.
Published in "Nature Protocols 11(12): 2389–2400, 2016"
which should be cited to refer to this work.
Animals are dissected in a semi-intact manner, leaving the body part that is imaged intact. After separating the larval head, adult proboscis or leg from the rest of the body, it is introduced into the chip and the preparation is subsequently sealed using a drop of 2% (wt/vol) agarose (diluted in Adult-hemolymph like (AHL) saline) to maintain an appropriate osmolarity and to avoid leak-ing (Supplementary Video 1). Once the animal is in place, the chip can be installed on any inverted microscope and connected to a tubing system containing eight (or more) input channels, including one washing channel (Fig. 1f). Solutions containing chemical compounds of interest are pumped through a channel, stimulating the animal, and neuronal activity is measured in the peripheral sensory neurons or in the brain (Figs. 2 and 3). Applications
We recently measured neuronal activity in a single GRN stimu-lated with multiple tastants from all different taste categories, showing that larvae possess multimodal GRNs19, in contrast to
previously described unimodal taste neurons in the adult fly or
in the mammalian system20. However, the described protocol can
be used to characterize individual sensory neurons in different types of investigations. In principle, every driver line that labels individual sensory neurons (such as Or35a-Gal4 (1-pentanol-sensing olfactory neuron (ORN) driver) or C7-Gal4 (multimodal GRN driver)) or populations of neurons (such as n-syb-Gal4 or elav-Gal4 (pan-neuronal drivers)) can be used to image neuronal activity during stimulation with different chemical cues. The application of multiple chemicals can be used for functional- or forward-genetics screens, but also to describe the dynamics of sensory perception, as the range and timing of application are flexible.
In our previous publications19,21, we used the system to
per-form recordings from larval taste neurons. Here we show that the chip can also be used to record and measure neuronal activity directly in the cell bodies of GRNs of the adult proboscis or leg (Fig. 3). Furthermore, the system could be modified to measure signals from thermosensitive cells in the larva by pumping liquids at different temperatures through the channels. Using the same Height: 300 μm
b
Input 1 Chip Pump 2 3 4 5 6 7 8 Washing channel Wasteg
d
Sillicon wafer First layer of SU8 Second layer of SU8c
Hole (3.0 mm) Height: 300 μme
f
Channel Chamber i ii iii iv v Master mold (Steps 1–15)Mask Microfluidic chips
(Steps 16–24)
Dissection of flies
(Steps 25–27)
Imaging
(Steps 28–32)
Quantification and image processing (Steps 33–37)
a
Figure 1 | Overview of workflow, the design of the microfluidic chip and
the installation of the pumps and chip on the microscope. (a) Workflow highlighting the main steps of the protocol. (b) Schematic overview of the design (from CleWin 4) of the channel and connecting chamber. i = 400 Mm; ii = 600 Mm; iii = 500 Mm; iv = 1,000 Mm; v = 10,000 Mm. The height of the channel is ~300 Mm. (c) An overview of the fabrication of the master mold. A first ‘basic’ layer of SU8 with a thickness of 1 Mm is spread on the silicon wafer. The second, patterned layer has an approximate height of 300 Mm. (d) A microfluidic chip. The PDMS has been cut to open the chamber (see green dotted line), and holes have been punched before bonding (arrowhead, green dotted circle). (e) View of the empty chip under the microscope. The channel through which the liquids are pumped, as well as the connecting chamber, are indicated. (f) Chip installed on the microscope during a measurement. An agarose drop is visible, which ensures that no liquid is leaking out and that the preparation is kept at an appropriate osmolarity. (g) Overview of the whole setup. Eight channels plus a washing channel can be connected to the influx channel of the microfluidic chip. The liquids are pumped by micropumps connected to the channels.
t Larva
a
100% dF/F 10 s 1-Pentanol (10–4) SOG 100% dF/F 10 s Sucrose (500 mM) 100% dF/F 10 sb
c
d
100% dF/F 10 s L-leucine (100 mM)e
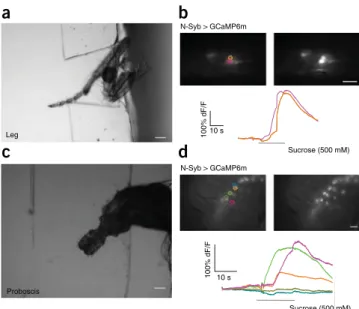
Ir76b > GCaMP5 Or35a > GCaMP6m C7 > GCaMP6m elav > GCaMP6m NaCl (100 mM) TOGFigure 2 | Measurements with larval preparations. (a) Bright-field
image of larval head installed in the chip. Scale bar, 100 Mm. Liquids can be pumped through the channel, coming in contact with the sensory organs of the animal, and neuronal activity can be measured in the brain (b), in ORNs (c) or in GRNs (d). (b) Example measurement of projections of IR76b-positive neurons in the SOG using GCaMP5. The larva was stimulated with 100 mM NaCl. Measurement area is
indicated by the inner small dotted circle. Scale bar, 10 Mm. (c) Calcium trace of an Or35a neuron, stimulated with 1-pentanol (10−4) and (d) a C7 neuron
stimulated with sucrose (500 mM) using GCaMP6m. All measurements were performed on a wide-field microscope with a time acquisition of 113 ms/frame. Scale bars, 10 Mm (c,d). (e) Left: maximum-intensity projection of a whole organ recording in the terminal organ ganglion with elav-Gal4. The animal was stimulated with L-leucine (100 mM) and measurements were performed at a rate of 0.5 Hz per frame, on a spinning-disk microscope. Scale bar, 10 Mm. Right: traces of the individual neurons highlighted in the left-hand panel with small dotted circles of the same color as the corresponding trace dF/F, fluorescence change as calculated at Step 36; SOG, subesophageal ganglion.
setup, we show that measurements in the larval brain can also be obtained, thereby enabling characterization of network dynamics related to taste, olfaction and thermosensation. More specialized laboratories might also be able to perform electrophysiologi-cal recordings from cells in the larval brain while the animal is installed in the chamber.
The use of the Gal4-UAS22 system, combined with our chip,
enables measurements from the same neuron or population of neurons while simultaneously knocking down receptors or other molecular players in these specific neurons. Versions of GCaMP6 have been shown to detect individual action poten-tials in layer 2/3 pyramidal neurons of the mouse visual cortex23.
These newest versions of GCaMP6 (s, m, and f (slow, medium and fast kinetics, respectively))23 can help to achieve detailed
and reliable calcium traces in sensory cells of the fly, therefore potentially showing different response dynamics for different substances in the same cell or across different cells in the same preparation. A few studies exist for assessing the in vivo per-formance of genetically encoded calcium sensors in Drosophila neurons24,25, so far using older versions of GCaMP that are less
reliable for reporting the underlying rapid calcium dynam-ics. An alternative approach toward resolving action potential frequency and shape will be the use of voltage sensors such as ArcLight26,27.
Advantages and limitations
Even though electrophysiological measurements provide details about action potential patterns, measurements of single sensory
cells using calcium imaging with genetically encoded sensors can help uncover mechanisms of signal transduction in defined neurons. In the adult fly, our method can provide an additional complementary approach to electrophysiological analysis, allowing fine dissection of cellular signaling and enabling observation of activity in more than one neuron at a time. Furthermore, this approach allows multiple recordings from the same neuron in different flies and from mutants or genetically manipulated (e.g., knockdown by RNAi) animals, to character-ize individual molecular players involved in signal transduction or sensory perception. Calcium imaging measurements (using genetically encoded calcium indicators) have been extensively used for monitoring of neural activity in flies24,28–30.
Recordings from larval ORN axons have been performed previously in the antennal lobe without a microfluidic chip but using a similar dissection strategy31. As compared with the
method discussed in that paper, our method allows stimulation of all sensory neurons, as well as removal of the applied chemical by washing. Using our microfluidic device, larval sensory neu-rons can be monitored in a semi-intact preparation with the larval head trapped in the chip, which mostly prohibits peristaltic movement of the animal.
Except for activity measurements of thermosensory neurons in the larval dorsal organ ganglion32,33, to our knowledge, no
other device has been designed to enable precise and restricted application of stimuli such as chemicals or other cues to the larva or, in the case of tastants, even to the adult fly. Our system goes beyond previous approaches32–34 by allowing for (i) precise
chemical stimulation of restrained, semi-intact larvae, (ii) multiple stimulus sweeps interspersed with wash steps and (iii) stimula-tion of the same animal with different chemicals or combinastimula-tions of chemicals.
A limitation of the device is that the chip was designed for a specific larval stage (third-instar larvae). In addition, as the animals are recorded in a semi-intact preparation, imaging cannot exceed a time limit of ~1 h. Different chips have been designed to allow the animal to be kept alive for longer18.
Experimental design
Choice of photoresist. Photoresists are light-sensitive materials that exist in two types: positive or negative. Positive photore-sists become soluble upon UV-light exposure, such that solvent treatment produces an exact copy of the microchannel pattern from the mask. Conversely, negative photoresists are hardened by UV-light exposure, and thus a solvent will wash away the unexposed areas, resulting in an inverse pattern of the mask (a negative of the desired microfluidic design). Although nega-tive photoresists are more prone to pattern distortions than their positive counterparts, they have better adhesion to different materials and lower manufacturing costs, making them a better choice when the process does not require very high resolution35.
Depending on the desired purpose, thickness and adhesion, several manufacturers offer a wide range of positive and negative photoresists. Here we use the SU8 negative photoresist and we describe the protocols suggested by Gersteltec. Once the master mold is obtained, several hundred chips can be produced with the same mold, and chips are reusable. Devices made of the polymer PDMS have low adsorption and can be reused after cleaning with isopropanol and water.
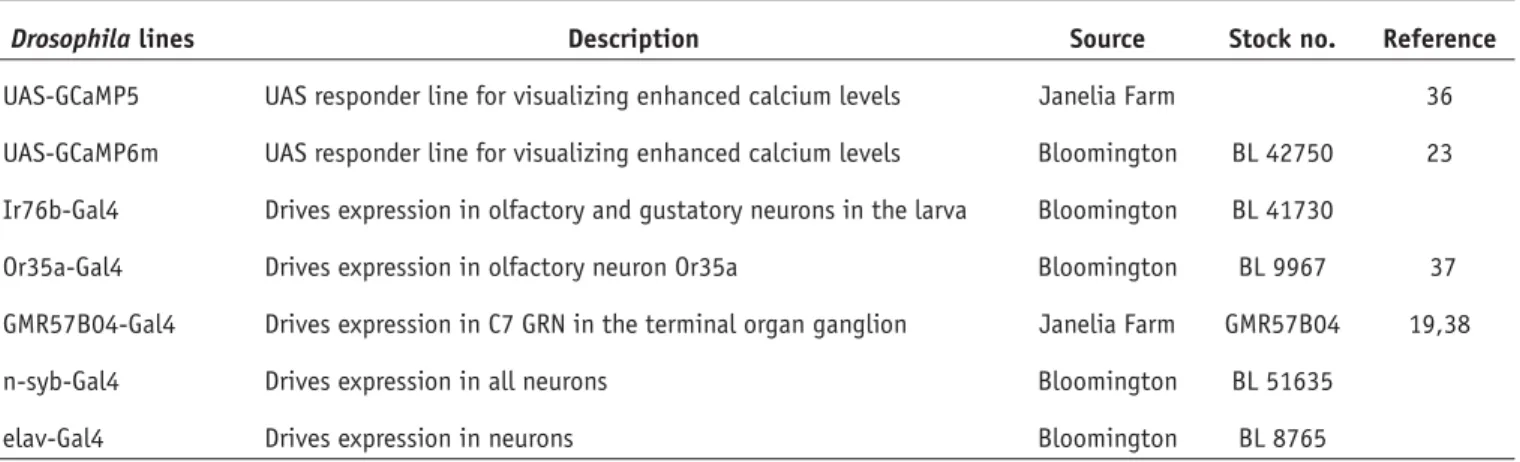
10 s 100% dF/F Leg Proboscis N-Syb > GCaMP6m 10 s 100% dF/F
a
b
c
d
N-Syb > GCaMP6m Sucrose (500 mM) Sucrose (500 mM)Figure 3 | Measurements using adult preparations. (a) Wide-field image
of adult leg in the chip. (b) Example measurements of GRNs using N-Syb-Gal4 > UAS-GCaMP6m, showing fluorescence of cells before (top left) and after (top right) stimulation with 500 mM sucrose. (Bottom) Traces of the response in two neurons marked with small dotted circles (in the top left panel) of the same color as the corresponding trace. (c) Adult proboscis installed in the chip. (d) Cell fluorescence before (top left) and after (top right) stimulation of the proboscis with sucrose (500 mM). (Bottom) Calcium imaging traces for the cells marked with dotted circles (in the top left panel) of the same color as the corresponding trace. All measurements were performed on a wide-field microscope with a time acquisition of 1F = 113 ms. Scale bars, 100 Mm (a,c) and 10 Mm (b,d).
Adapting the system to the neuronal population of interest. The preparation and installation of the animal in the chip is depend-ent on the population of neurons to be measured. The primary purpose of the described system is to assess the physiological response of sensory neurons while stimuli are perfused through the chip. The head of a third-instar larva, or the adult proboscis or leg, can be simply inserted into the chamber, and the peripheral neuronal activity can be recorded during stimulation. In addition, neuronal activity from the larval brain can be measured. If you are working with younger larvae or with other parts of the adult body, the design of the photomask may be adjusted accordingly. Choice of stimulant. This largely depends on the scientific question at hand. When recording the activity of taste neurons, test substances can be tastants such as sweet, bitter, sour or carbonated solutions in water. Substances can be delivered at different temperatures when investigating thermosensitive neurons, or olfactory cues in solution can be used when record-ing from olfactory neurons. The number of stimulants that can be tested for one preparation is dependent on the number of micropumps connected to the chip, as each pump operates the flow of one stimulant. Switching the pumps allows inter-changing between stimulants or washing with the control sub-stance. Parameters such as concentration, pH, temperature and
molarity can influence neuronal responses, and they should be kept constant when preparing test solutions.
Controls. The control substance used for washing between stimu-lations is usually the solvent used for the preparation of the test solutions—for instance, Millipore water. In addition, positive controls may be used to assess the viability of the cells of interest, if such a compound is known for these cells.
Choice of microscope. This is key to obtaining imaging results with the appropriate spatial and temporal resolutions. The chip can be installed on basically any inverted microscope, ranging from a comparatively simple wide-field microscope to a scanning or spinning-disk confocal microscope or even to two-photon microscopes. Individual genetically labeled somata, dendrites or axons of sensory neurons or large structures can be easily imaged using a wide-field microscope (Figs. 2b–d and 3). Multicellular structures can be imaged with a confocal or a spin-ning-disk confocal microscope to achieve appropriate resolution of individual cells, taking into account the fact that acquisition of stacks will result in a lower temporal resolution (Fig. 2e). Two-photon setups should be used when working with thick samples or when dealing with high levels of autofluorescence in the surrounding tissue.
MATERIALS
REAGENTS
Drosophila fly line of appropriate genetic background (Table 1)
Silicon Test Wafer 100/P/SS/01-100 (Siegert Wafer, based on specifications at https://cmi.epfl.ch/organisation/files/100_p_ss_01_100_test.pdf)
SU8 negative photoresist (e.g., GM1040/60 or GM1075; Gersteltec:
http://www.gersteltec.ch/su-8-Photoresists/)
Propylene glycol monomethyl ether acetate (PGMEA; developer, Sigma-Aldrich, cat. no. 484431)
Sylgard 184 Silicone Elastomer Kit (polydimethylsiloxane (PDMS); Dow Corning)
Isopropanol (Sigma-Aldrich, cat. no. 190764) Agarose (Roth, cat. no. 3810.4)
NaCl, 100 mM for stimulation or 108 mM for AHL saline (Sigma-Aldrich, cat. no. 71380)
KCl, 5 mM (Merck, cat. no. 104936)
MgCl2·6 H2O, 8.2 mM (Merck, cat. no. 172571) NaHCO3, 4 mM (Merck, cat. no. 106329) NaH2PO4·H2O, 1 mM (Merck, cat. no. 106346) HEPES, 5 mM (Sigma-Aldrich, cat. no. 7523) Sucrose (Sigma-Aldrich, cat. no. 84100) 1-Pentanol (Sigma-Aldrich, cat. no. 398268) l-Leucine (Sigma-Aldrich, cat. no. 8000)
EQUIPMENT
Plasma Cleaner (e.g., Diener electronic, Femto Oxygen) Coater for negative resist (e.g., Sawatec LMS200) Hotplate (e.g., Sawatec HP401Z)
Mask (chrome etching; see Equipment Setup)
Chrome blank, 5-inch (Nanofilm SLM 5) or 7-inch (Nanofilm SLM 7) Single-side mask aligner (e.g., Süss MJB4)
mp6-Micropumps and controllers (Bartels Mikrotechnik)
Tygon tubing: inner diameter (ID) 1/16 inches, outer diameter (OD) 1/8 inches and wall 1/32 inches (Cole Parmer, cat. no. 06407-37) MCRITICAL The ID of the tubing will have an influence on the flow rate of the pumped liquids. (Flow rate (Q) can be calculated (Q=V/t with V being the volume of the tubing and t being the elapsed time) or simply measured by recording the liquid output over time). Connectors with appropriate ID for tubing (e.g., Harvard Appartus, cat. no. 72-1410) MCRITICAL The ID of the connectors will have an influence on the flow rate of the pumped liquids.
• • • • • • • • • • • • • • • • • • • • • • • • •
Hole puncher (e.g., Harris Uni-Core 3.0 mm, cat. no. AGT5490-300)
MCRITICAL Hole should have the same diameter as the tubing. Microscope cover glasses, 24 × 60 mm (VWR, cat. no. 631-1575) 1,000-Ml Pipette tips (Treff, cat. no. 96.01702.6.01)
Aluminum foil (available at any supermarket) Scalpel (e.g., Swann-Morton Handle 3; cat. no. 0933) Surgical blades (e.g., Swann-Morton; cat. no. 0201) Petri dishes, 46 × 16 mm (Semadeni, cat. no. 1708)
Petri dishes, diameter 5.9 inches (e.g., Fisher Scientific, cat. no. 08-757-148) Fine forceps (Fine Science Tools, Dumont 5, cat. no. 11254-20)
Binocular microscope for larval brain dissection (e.g., Leica) Inverted fluorescence microscope (e.g., Leica CTR 700 HS)
Inverted spinning-disk microscope (e.g., Visitron VisiScope CSU-W1) Heidelberg DWL200 (Heidelberg Instrument)
Imaging software (e.g., LASAF (Leica (http://www.leica-microsystems. com/home/)), Fiji or ImageJ (https://imagej.net/ImageJ))
REAGENT SETUP
PDMS Always prepare the PDMS mixture fresh. Thoroughly mix the base
and the curing agent in a proportion of 10:1. 50–80 ml of PDMS in a Petri dish of 46 × 16 mm is sufficient to produce chips of an appropriate height.
AHL saline solution Prepare AHL saline solution by adding the following
chemicals to 1 liter of Millipore water (concentration in parentheses = final concentration): NaCl (108 mM), KCl (5 mM), MgCl2 (8.2 mM), NaHCO3 (4 mM), NaH2PO4 (1 mM) and HEPES (5 mM); adjust the pH to 7.5.
MCRITICAL Leave the solution in the refrigerator overnight and readjust the pH the next morning. Stock solution can be stored at 4 °C for ~1 month.
Sucrose solution Dissolve sucrose in Millipore water to a concentration of
500 mM; the solution can be stored for 1 week at 4 °C.
1-Pentanol solution Dilute 1-pentanol in Millipore water to a concentration
of 10–4; always prepare fresh solution for each experiment.
L-Leucine solution Dissolve l-Leucine in Millipore water to a concentration of 100 mM; always prepare fresh solution for each experiment.
Agarose Prepare a 2% (wt/vol) agarose solution in AHL saline. Always
prepare fresh solution for each experiment, and keep it at ~50 °C on a hotplate stirrer, ensuring continuous mixing with the help of a magnet immersed in the solution. This procedure will ensure that the agarose remains liquid, facilitating the sealing of multiple preparations before it solidifies. • • • • • • • • • • • • • •
EQUIPMENT SETUP
Clean room To conduct this experiment at an acceptable standard, it is
important to have access to a clean room with a low level of environmental pollutants, which is achieved with standard laminar flow and the appropriate machines for photolithography. Fabrication of a microfluidic device entails etching or molding structures in the range of micrometers. As this process could be impaired by the presence of particulates in the air, clean-room facilities ensure optimal conditions.
Mask Use chrome etching to produce a mask of the desired design
(Supplementary Data). The .cif design is patterned on a chrome blank by using, for example, Heidelberg DWL200 laser writing, and
subsequent wet etching is performed to obtain the desired pattern.
MCRITICAL Work in a clean room.
Pumps Cut tubing using a scalpel and, together with the connectors,
use the tubing to connect the pumps to the input channels, as suggested in Figure 1f; ensure that the tubing is long enough to reach the containers containing test solutions. Each pump should be connected to an individual controller. Adjust the parameters of the pump controllers (e.g., SRS-Signal; 200 Hz, 170 Vpp). MCRITICAL The controller of the micropumps has a USB port and can be directly operated by a computer. In our recent publication19,
we switched pumps manually, but an automatic control might enhance accuracy of measurements.
TABLE 1 | Useful Drosophila fly lines for visualizing sensory cells and measuring neuronal activity.
Drosophila lines Description Source Stock no. Reference
UAS-GCaMP5 UAS responder line for visualizing enhanced calcium levels Janelia Farm 36
UAS-GCaMP6m UAS responder line for visualizing enhanced calcium levels Bloomington BL 42750 23
Ir76b-Gal4 Drives expression in olfactory and gustatory neurons in the larva Bloomington BL 41730
Or35a-Gal4 Drives expression in olfactory neuron Or35a Bloomington BL 9967 37
GMR57B04-Gal4 Drives expression in C7 GRN in the terminal organ ganglion Janelia Farm GMR57B04 19,38
n-syb-Gal4 Drives expression in all neurons Bloomington BL 51635
elav-Gal4 Drives expression in neurons Bloomington BL 8765
Bloomington, Bloomington Drosophila Stock Center.
PROCEDURE
Preparation of master mold LTIMING ~1 week
MCRITICAL Steps 1–15 should be performed in a properly equipped clean room. When you are handling the wafer,
always place the coated side of the silicon wafer up, unless stated otherwise.
1| Spin-coat, SU8 layer 1. Program the spin-coater according to the table below, and coat a silicon test wafer with a 1-Mm layer of SU8 negative photoresist (GM1040).
Time (s) Speed (r.p.m.) Segment 1 5 500 Segment 2 5 500 Segment 3 31.16 3,616 Segment 4 40 3,616 Segment 5 1 4,616 Segment 6 1 3,616 Segment 7 5 3,616 Segment 8 36.16 0
MCRITICAL STEP This first layer of SU8 improves adhesion by reducing internal stress from the second, thicker SU8 layer, which can lead to cracking and detaching of the material from the wafer.
MCRITICAL STEP Optimal settings (e.g., thickness) depend on the supplier of the SU8. For details, see http://www.gersteltec.ch/ su-8-Photoresists/.
2| Remove the SU8-coated wafer from the spin-coater and let it relax for 1–5 min at room temperature (22 °C) on an even surface (ideally the hotplate that is used for softbake) to maximize uniformity of the SU8 layer. The relaxation time depends on the thickness of the layer; longer intervals are needed for thicker layers.
3| Softbake. If it is not there already, place the wafer on a hotplate (coated side facing up) and perform a softbake using the times and temperatures listed below. Note that these values may vary depending on the thickness of the first SU8 layer and on the supplier of the SU8.
Time (s) Temperature (°C)
Segment 1 10 30
Segment 2 1,200 130
Segment 3 300 130
Segment 4 1,200 30
4| Exposure. Place the wafer into a standard UV mask aligner and expose the entire surface of the SU8-coated wafer to UV light (flood exposure), setting the parameters for a 1-Mm thickness (for 4 s with 80 mJ/cm2 and 20 mW/cm2).
5| Postexposure bake. Place the wafer on a hotplate and perform a postexposure bake using the times and temperatures listed below (depending on the thickness/supplier; see exact values for desired thickness: http://www.gersteltec.ch/ su-8-Photoresists/). Time (s) Temperature (°C) Segment 1 10 30 Segment 2 1,200 100 Segment 3 900 100 Segment 4 2,700 60 Segment 5 2,700 30
6| Spin-coat, SU8 layer 2. Program the coater as tabulated below (depending on the thickness and/or supplier) to spin-coat the wafer with a second layer of SU8 (GM1075), this time with a thickness of 300 Mm.
Time (s) Speed (r.p.m.) Segment 1 5 500 Segment 2 5 500 Segment 3 2.18 718 Segment 4 40 718 Segment 5 1 1,718 Segment 6 1 718 Segment 7 5 718 Segment 8 7.18 0 ?TROUBLESHOOTING
7| Let the wafer relax at room temperature for at least 1 h.
8| Softbake. Place the wafer on a hotplate and perform a softbake using the times and temperatures tabulated below (depending on the thickness and/or supplier).
Time (s) Temperature (°C)
Segment 1 1,800 30
Segment 2 3,000 130
Segment 3 400 130
9| Exposure. For the exposure of the second layer, align the mask (with the required chip design) along with the wafer in the mask aligner and expose to UV light for 32.5 s at 650 mJ/cm2 and 20 mW/cm2.
?TROUBLESHOOTING
10| Postexposure bake. Place the wafer on a hotplate and perform a postexposure bake using the times and temperatures tabulated below (depending on the thickness and/or supplier).
Time (s) Temperature (°C) Segment 1 10 30 Segment 2 3,000 100 Segment 3 3,600 100 Segment 4 2,700 60 Segment 5 2,700 30
11| Let the wafer relax for at least 1 h (and up to overnight) at room temperature.
12| Development. Prepare two glass containers containing PGMEA at room temperature. Place the wafer in the first dish and leave it for 5–6 min, carefully and gently agitating it from time to time to help the SU8 dissolve.
MCRITICAL STEP For development, always place the wafer with the coated side facing down so that the dissolved SU8 sinks
downward and not onto the wafer.
13| Carefully transfer the wafer to the second dish of PGMEA and leave it there for ~5 min.
MCRITICAL STEP Always place the wafer with the coated side facing down so that the dissolved SU8 sinks downward
and not onto the wafer. Do not develop for >11 min in total (Steps 12 and 13). 14| Wash the wafer in a dish containing isopropanol for 1 min at room temperature.
?TROUBLESHOOTING
15| Remove residual dirt carefully with isopropanol from a wash bottle, and then let the mold dry.
J Master molds can be stored in a closed container to protect them from dust for several months at room temperature.
Preparation of PDMS chips LTIMING ~2 d
MCRITICAL Working under laminar flow is recommended to prevent the PDMS from getting dusty, but it is
not necessary.
16| Prepare the master mold by cleaning with isopropanol to remove dust, and let it dry.
17| Cover the inside of a Petri dish (diameter ~5.9 inches) carefully with aluminum foil. Make sure that there are no cracks or bubbles in the foil.
18| Prepare the 10:1 PDMS mixture as recommended by the supplier. Mix well and always prepare fresh mixture before use.
19| Place the cleaned master mold carefully in the middle of the Petri dish on top of the foil. Slowly pour 50–80 ml of PDMS mixture on top of the mold, ensuring that the mold is covered by a layer of PDMS to a thickness of 0.8–1 cm. 20| Let the dish stand still for ~30 min, until all the bubbles disappear from the PDMS.
21| Cure the PDMS for at least 1 h at 80 °C in a laboratory oven. Alternatively, let the PDMS harden at room temperature for 24–48 h.
22| Carefully separate the PDMS from the master mold and cut the chips with a scalpel. Cut open the chamber designed for the insertion of the animal. Punch holes with a 3.0-mm hole puncher to create input and output openings for the microfluidic channel (Fig. 1d).
MCRITICAL STEP Working under laminar flow helps to keep the chips clean, which results in better bonding.
23| Clean the PDMS chips carefully with isopropanol, and let them fully dry.
24| In a plasma cleaner, bond the PDMS chips to a glass cover slip using plasma oxygen (0.6 mbar, 100 W for 0.1 min). Enhance bonding by slightly pressing the PDMS onto the cover slip.
?TROUBLESHOOTING
J Chips can be stored for months in a clean box at room temperature. Preparation of the animals for imaging LTIMING 10–15 min
25| Collect third-instar larvae or adult flies of the desired genetic background (animals expressing a genetically encoded calcium indicator in the desired population of sensory neurons, see Table 1).
26| Prepare animals for imaging. Follow option A to prepare for imaging of external sensory neurons in the larva, option B to prepare for imaging in the larval brain and option C to prepare for imaging of the adult proboscis or leg.
(A) Preparation for imaging larval external sensory neurons
(i) Place a drop of AHL saline in front of the chamber on the microfluidic chip. (ii) Wash the animal carefully in a drop of water to remove residual food.
(iii) Dissect the animal’s head in a separate drop of AHL saline (for example, on the lid of a Petri dish) by removing and retaining the most anterior third of the larva. Carefully remove fat tissue and the gut, but keep the brain and related nerves intact. Introduce the dissected animal into the chamber in a manner that exposes the chemosensory organs to the liquids (Fig. 2a).
(iv) Place a drop of 2% (wt/vol) agarose diluted in AHL saline on top of the animal in front of the chamber in order to close the channel and to maintain the animal in physiological conditions (Supplementary Video 1).
?TROUBLESHOOTING
(B) Preparation for imaging brain neurons
(i) Place a drop of AHL saline in front of the chamber on the microfluidic chip. (ii) Wash the animal carefully in a drop of water to remove residual food.
(iii) In a separate drop of AHL saline on the lid of a Petri dish, separate the most anterior third of the larva from the rest of the body with fine forceps. Carefully remove fat tissue, the gut and the surrounding cuticle from around the brain, so that the brain is quite visible. Leave the brain and connecting nerves, as well as the most anterior part of the head, intact.
(iv) Carefully introduce the head into the chamber, making sure that the brain stays outside the chamber, close to the glass cover slip (Fig. 2a). Depending on the region of interest, place the brain with either the ventral or the dorsal side in contact with the cover slip.
(v) Slowly remove the liquid with a piece of tissue paper while keeping the brain on the glass slide, using the nerves of the ventral nerve cord to carefully pull the brain into position.
MCRITICAL STEP Handle the brain and connecting nerves carefully; if the connecting nerves are cut, no signal will reach the brain.
(vi) Add a drop of agarose on top of the brain preparation to close the channel and to maintain physiological conditions.
?TROUBLESHOOTING
(C) Preparation for imaging the adult proboscis or leg (i) Anesthetize adult flies on ice.
(ii) Carefully remove the whole head and introduce the proboscis into the chamber by gently pressing the head so that the proboscis protrudes. Install the head so that the proboscis is pointing inside the channel (Fig. 3c), and gently push the head into the chamber. For the leg, carefully remove the leg from the body of the fly and introduce the tarsus and tibia into the chamber. Bend the femur and trochanter so as to close the channel opening (Fig. 3a,c).
MCRITICAL STEP Avoid damage to the head, as this might impair the measurements.
(iii) Close the chamber with a drop of 2% (wt/vol) agarose.
?TROUBLESHOOTING
Calcium imaging of sensory neurons LTIMING variable 28| Connect the chip to the tubing system.
MCRITICAL STEP Before installing the chip on the microscope, make sure that the system is not leaking. Damage to the microscope can occur if liquid is leaking.
29| Install the connected chip on top of the inverted microscope (Fig. 1e) and search for the structure and/or cells of interest (e.g., gustatory sensory neurons).
?TROUBLESHOOTING
30| Fill all channels with liquid, start the water flow and acquire an image or stack during the water flow—i.e., before stimulation. Single cells can be imaged in a single plane to enhance frame rate, whereas populations of cells might require acquisition of a stack. The thickness of the steps used for acquiring a stack is typically ~1 Mm, but it can vary depending on the size of the cells of interest.
?TROUBLESHOOTING
31| Subject the animal to a stimulus by switching the pumps to deliver a stimulus from a second reservoir, which contains the stimulus-containing solution.
32| Wash the stimulant away by switching back to the water channel. Typically, it is recommended to measure the sample before, during and after stimulation in order to obtain a full picture of the cellular response, as well as a baseline fluores-cence value for the measured cell.
Quantification of fluorescence change LTIMING 10–15 min
33| View the images in a suitable imaging program such as LASAF (Leica) or Fiji. For each image, select a region of
interest—which can be part of the cell body, dendrite or axon—termed ‘ROIA’, and a second region of interest in a place that shows an approximately average amount of background fluorescence (Background), termed ‘ROIBG’.
34| Subtract the Background for each time point (t):
F t( ) ROIA( )t ROIBG( )t 35| Calculate F0, for example, as an average from five frames before stimulation. 36| Calculate the change of fluorescence as follows:
$F F t/ ( )(%) (( ( )F t F0)/F0)100
37| If there is evidence of small motion artifacts (caused by liquid flow or muscle movements), correct them by manually adjusting the resulting graph (Table 2; Supplementary Fig. 1a). Calculations of fluorescence changes and corrections of artifacts can be conducted in Excel or in the analysis tools of preference. In addition, artifacts caused by limited translation movement and 3D drift can be corrected using plugins designed for Fiji or ImageJ, which are available online (Supplementary Video 2). However, if the movement is substantial (Supplementary Fig. 1b), it is recommended to check on the pressure of the pumps and/or to discard the data and prepare a new sample.
?TROUBLESHOOTING ?TROUBLESHOOTING
Troubleshooting advice can be found in Table 2.
TABLE 2 | Troubleshooting table.
Step Problem Possible reason Solution
6 Thickness of SU8
is <300 Mm
300 Mm is at the upper limit of the maximal thickness achievable using SU8. For a proportion of chips, the height will be slightly under 300 Mm (e.g., 285 Mm)
The design does not require strict precision for the resist height. If uniformity is critical, choose a thickness slightly <300 (e.g., 280 Mm).
LTIMING
Steps 1–15, preparation of master mold: ~1 week Steps 16–24, preparation of PDMS chips: ~2 d
Steps 25–27, preparation of the animals for imaging: 10–15 min Steps 28–32, calcium imaging of sensory neurons: variable Steps 33–37, quantification of fluorescence change: 10–15 min ANTICIPATED RESULTS
The workflow, the design and the resulting chips are depicted in Figure 1. Representative types of measurements with this microfluidic chip are illustrated in Figures 2 and 3. The chip described here is designed as a tool to measure calcium-evoked signals in sensory neurons of Drosophila larvae and adult proboscis and leg. Live samples are secured in a chamber and can therefore easily be measured and stimulated at the same time. The measurements can be performed using genetically encoded calcium sensors in essentially every population of sensory cells. A time-lapse series of fluorescent changes can be acquired, and the intensity changes over time can be compared with the baseline fluorescence in
each cell, measured using imaging software such as LASAF or Fiji.
The solutions pumped through the channel will stimulate all exposed sensory cells. Therefore, depending on the Gal4 driver line, either single or multiple neurons in different parts of the animal (e.g., sensory organs or neurons in the brain)
TABLE 2 | Troubleshooting table (continued).
Step Problem Possible reason Solution
9 Poor exposure Suboptimal exposure times For longer exposure times (e.g., 30 s) split the
time into cycles (e.g., 3 cycles of 10 s)
14 White remnants
of SU8 on the wafer in the etched regions
SU8 did not develop fully Wash the wafer again in PGMEA for 1 min and
then in isopropanol (1 min); if necessary, repeat this procedure until no remnants are spotted
24 Poor bonding Dirty PDMS Clean the block of PDMS very carefully with
isopropanol, and use a strip of sticky tape to remove dust
26A(iv) Agarose is leaking into
the channel, thereby prohibiting stimulation of the animal
The larval chamber is too big; the larva is too small; or the chip is broken
Exchange the chip or choose animals of appropriate size
26B(vi) The brain is floating The agarose drop displaced the preparation Carefully move the brain back to the cover slip
before the agarose dries
26C(iii) Agarose is leaking into
the channel
The larval chamber is too big; the leg is too small; or the chip is broken
Exchange the chip or install the femur at a different angle
29 Low baseline
fluorescence
A weak driver; the reporter has low baseline fluorescence; or the structure is too deep inside the tissue
We observed that GCaMP6m has very low baseline fluorescence, and imaging of small structures, —e.g., measurements of projections in the SOG (Fig. 2b), might be easier to achieve with GCaMP5. For deep structures, imaging with a two-photon microscope might be more easily achievable
30 Movement of the larva Live preparation—animal is still capable of
moving
Wait for ~5 min, and if there is no improvement, use a new preparation
37 Artifacts in the graph Movement of the preparation, light artifacts Correct the graph by replacing the fluorescence
intensity values recorded during the movement frame with values from one time point before (Supplementary Fig. 1a). Correct for the difference in intensity by subtracting the difference
can be imaged while the stimulation takes place. Measurements of projections in the brain are shown here using
IR76b-Gal4 > UAS-GCaMP5 (Fig. 2b; Table 1). For single-cell recordings, we show an ORN (Or35a) from a larva (Fig. 2c), and a gustatory neuron (C7) from a larva (Fig. 2d)19. Multicellular recordings can be obtained; depending on the desired information, they are acquired as stacks (Fig. 2e) or in a single plane (Fig. 3b,d). Measurements in the larvae were taken from a Z stack of the whole terminal organ ganglion using elav-Gal4 (Fig. 2e). Adult preparations were focused in one plane, and different cells were measured (Fig. 3b,d). Depending on the frame rate of the acquisition, different response dynamics to the same stimulus can be observed in different sensory cells of the larval (Fig. 2e) or the adult (Fig. 3a,c) multicellular recording. Onset, duration and strength of the neuronal response are different parameters that can be analyzed in such measurements, and the details are enhanced with faster recordings—compare Figure 2e, in which a stack has been obtained, and Figure 3, in which recordings were obtained in a single plane. The animals were stimulated with odorants (1-pentanol) or tastants, respectively (100 mM NaCl, 500 mM sucrose and 100 mM L-leucine).
We initially used the chip for physiological recordings of the larval taste neurons; however, we show here that the microfluidic chip can also be used to measure neuronal activity in the proboscis and legs of the adult fly (Fig. 3). Therefore, the simple microfluidic chip developed here can be used for a variety of experiments in adults and larvae for different neuronal populations.
ACKNOWLEDGMENTS We thank the Bloomington Drosophila Stock Center
for reagents. We thank R. Benton, P. Renaud, L. Pethö, K. Suter and J. Dorsaz for help with the experiments, and T. Graham and B. Egger for helpful discussion of the manuscript. This work was supported by grants from the Swiss National Science Foundation (CRSII3_136307 and 31003A_149499) and the European Research Council (ERC-2012-StG 309832-PhotoNaviNet) to S.G.S. We further thank our colleagues in the Sprecher laboratory for fruitful discussions of the manuscript.
AUTHOR CONTRIBUTIONS L.v.G. and G.L.N.-M. performed the experiments.
L.v.G. and S.G.S. developed the protocol. L.v.G., G.L.N.-M., J.Y.K. and S.G.S. wrote the paper.
COMPETING FINANCIAL INTERESTS The authors declare no competing financial
interests.
1. de Bruyne, M., Foster, K. & Carlson, J.R. Odor coding in the Drosophila antenna. Neuron 30, 537–552 (2001).
2. Benton, R., Sachse, S., Michnick, S.W. & Vosshall, L.B. Atypical membrane topology and heteromeric function of Drosophila odorant receptors in vivo.
PLoS Biol. 4, e20 (2006).
3. Lee, Y., Moon, S.J. & Montell, C. Multiple gustatory receptors required for the caffeine response in Drosophila. Proc. Natl. Acad. Sci. USA 106, 4495–4500 (2009).
4. Weiss, L.A., Dahanukar, A., Kwon, J.Y., Banerjee, D. & Carlson, J.R. The molecular and cellular basis of bitter taste in Drosophila. Neuron
69, 258–272 (2011).
5. Root, C.M., Ko, K.I., Jafari, A. & Wang, J.W. Presynaptic facilitation by neuropeptide signaling mediates odor-driven food search. Cell 145, 133–144 (2011).
6. Mishra, D. et al. The molecular basis of sugar sensing in Drosophila larvae. Curr. Biol. 23, 1466–1471 (2013).
7. Zhang, Y.V., Ni, J. & Montell, C. The molecular basis for attractive salt-taste coding in Drosophila. Science 340, 1334–1338 (2013). 8. Clyne, P., Grant, A., O’Connell, R. & Carlson, J.R. Odorant response
of individual sensilla on the Drosophila antenna. Inver. Neurosci. 3, 127–135 (1997).
9. Hiroi, M., Marion-Poll, F. & Tanimura, T. Differentiated response to sugars among labellar chemosensilla in Drosophila. Zoolog. Sci. 19, 1009–1018 (2002).
10. Hallem, E.A., Ho, M.G. & Carlson, J.R. The molecular basis of odor coding in the Drosophila antenna. Cell 117, 965–979 (2004).
11. Hallem, E.A. & Carlson, J.R. Coding of odors by a receptor repertoire.
Cell 125, 143–160 (2006).
12. Dahanukar, A., Lei, Y.T., Kwon, J.Y. & Carlson, J.R. Two Gr genes underlie sugar reception in Drosophila. Neuron 56, 503–516 (2007).
13. Cameron, P., Hiroi, M., Ngai, J. & Scott, K. The molecular basis for water taste in Drosophila. Nature 465, 91–95 (2010).
14. Vosshall, L.B. & Stocker, R.F. Molecular architecture of smell and taste in Drosophila. Annu. Rev. Neurosci. 30, 505–533 (2007).
15. Oppliger, F.Y., Guerin, P.M. & Vlimant, M. Neurophysiological and behavioural evidence for an olfactory function for the dorsal organ and a gustatory one for the terminal organ in Drosophila melanogaster larvae. J. Insect Physiol. 46, 135–144 (2000).
16. Chalasani, S.H. et al. Dissecting a circuit for olfactory behaviour in
Caenorhabditis elegans. Nature 450, 63–70 (2007).
17. Chronis, N., Zimmer, M. & Bargmann, C.I. Microfluidics for in vivo imaging of neuronal and behavioral activity in Caenorhabditis elegans. Nat.
Methods 4, 727–731 (2007).
18. Ghannad-Rezaie, M., Wang, X., Mishra, B., Collins, C. & Chronis, N. Microfluidic chips for in vivo imaging of cellular responses to neural injury in Drosophila larvae. PloS One 7, e29869 (2012).
19. van Giesen, L. et al. Multimodal stimulus coding by a gustatory sensory neuron in Drosophila larvae. Nat. Commun. 7, 10687 (2016).
20. Liman, E.R., Zhang, Y.V. & Montell, C. Peripheral coding of taste.
Neuron 81, 984–1000 (2014).
21. Choi, J. et al. A pair of pharyngeal gustatory receptor neurons regulates caffeine-dependent ingestion in Drosophila larvae. Front. Cell. Neurosci.
10, 181 (2016).
22. Brand, A.H. & Perrimon, N. Targeted gene expression as a means of altering cell fates and generating dominant phenotypes. Development 118, 401–415 (1993).
23. Chen, T.W. et al. Ultrasensitive fluorescent proteins for imaging neuronal activity. Nature 499, 295–300 (2013).
24. Reiff, D.F. et al. In vivo performance of genetically encoded indicators of neural activity in flies. J. Neurosci. 25, 4766–4778 (2005).
25. Jayaraman, V. & Laurent, G. Evaluating a genetically encoded optical sensor of neural activity using electrophysiology in intact adult fruit flies.
Front. Neural Circuits 1, 3 (2007).
26. Cao, G. et al. Genetically targeted optical electrophysiology in intact neural circuits. Cell 154, 904–913 (2013).
27. Gong, Y. et al. High-speed recording of neural spikes in awake mice and flies with a fluorescent voltage sensor. Science 350, 1361–1366 (2015).
28. Tian, L. et al. Imaging neural activity in worms, flies and mice with improved GCaMP calcium indicators. Nat. Methods 6, 875–881 (2009).
29. Fiala, A. et al. Genetically expressed cameleon in Drosophila melanogaster is used to visualize olfactory information in projection neurons.
Curr. Biol. 12, 1877–1884 (2002).
30. Seelig, J.D. et al. Two-photon calcium imaging from head-fixed
Drosophila during optomotor walking behavior. Nat. Methods 7,
535–540 (2010).
31. Asahina, K., Louis, M., Piccinotti, S. & Vosshall, L.B. A circuit supporting concentration-invariant odor perception in Drosophila.
J. Biol. 8, 9 (2009).
32. Klein, M. et al. Sensory determinants of behavioral dynamics in
Drosophila thermotaxis. Proc. Natl. Acad. Sci. USA 112, E220–E229
33. Ni, L. et al. The ionotropic receptors IR21a and IR25a mediate cool sensing in Drosophila. eLife 5, e13254 (2016).
34. Miyamoto, T., Chen, Y., Slone, J. & Amrein, H. Identification of a
Drosophila glucose receptor using Ca2+ imaging of single chemosensory
neurons. PloS One 8, e56304 (2013).
35. Lin, Q. in Physical Properties of Polymers Handbook (ed. J.E. Mark) (2006).
36. Akerboom, J. et al. Optimization of a GCaMP calcium indicator for neural activity imaging. J. Neurosci. 32, 13819–13840 (2012).
37. Fishilevich, E. et al. Chemotaxis behavior mediated by single larval olfactory neurons in Drosophila. Curr. Biol. 15, 2086–2096 (2005). 38. Pfeiffer, B.D. et al. Tools for neuroanatomy and neurogenetics in