HAL Id: hal-00296405
https://hal.archives-ouvertes.fr/hal-00296405
Submitted on 7 Jan 2008
HAL is a multi-disciplinary open access
archive for the deposit and dissemination of
sci-entific research documents, whether they are
pub-lished or not. The documents may come from
teaching and research institutions in France or
abroad, or from public or private research centers.
L’archive ouverte pluridisciplinaire HAL, est
destinée au dépôt et à la diffusion de documents
scientifiques de niveau recherche, publiés ou non,
émanant des établissements d’enseignement et de
recherche français ou étrangers, des laboratoires
publics ou privés.
Sand/dust storm processes in Northeast Asia and
associated large-scale circulations
Y. Q. Yang, Q. Hou, C. H. Zhou, H. L. Liu, Y. Q. Wang, T. Niu
To cite this version:
Y. Q. Yang, Q. Hou, C. H. Zhou, H. L. Liu, Y. Q. Wang, et al.. Sand/dust storm processes in
Northeast Asia and associated large-scale circulations. Atmospheric Chemistry and Physics, European
Geosciences Union, 2008, 8 (1), pp.25-33. �hal-00296405�
www.atmos-chem-phys.net/8/25/2008/ © Author(s) 2008. This work is licensed under a Creative Commons License.
Chemistry
and Physics
Sand/dust storm processes in Northeast Asia and associated
large-scale circulations
Y. Q. Yang, Q. Hou, C. H. Zhou, H. L. Liu, Y. Q. Wang, and T. Niu
Centre for Atmosphere Watch and Services (CAWAS), Chinese Academy of Meteorological Sciences, China Meteorological Administration (CMA), Beijing 100081, China
Received: 27 March 2007 – Published in Atmos. Chem. Phys. Discuss.: 29 June 2007 Revised: 22 October 2007 – Accepted: 5 December 2007 – Published: 7 January 2008
Abstract. This paper introduces a definition of sand/dust storm process as a new standard and idea of sand/dust storm (SDS) groups a number of SDS-events in Northeast Asia. Based on the meteorological data from WMO/GOS network, 2456 Chinese surface stations and NCEP-NCAR reanalysis, the sand/dust storm processes in Northeast Asia in spring 2000–2006 are investigated. And the evolutions of anoma-lies of general circulation in the troposphere are analyzed by comparing the spring having most and least occurrences of SDS in year 2006 and 2003. Associated with the notice-ably increased occurrence of SDS processes in spring 2006, the anomalies in 3-D structure of general circulation espe-cially in the mid-and high latitudes of the Northen Hemi-sphere (NH) are revealed. The transition period from the winter of 2005 to spring 2006 has witnessed a fast-developed high center over the circumpolar vortex area in the upper tro-posphere, which pushes the polar vortex more southwards to mid-latitudes with a more extensive area over the east NH. In spring 2006, there are the significant circulation anomalies in the middle troposphere from the Baikal Lake to northern China with a stronger southward wind anomaly over North-east Asia. Compared with a normal year, stronger meridional wind with a southward wind anomaly also in the lower tropo-sphere prevail over the arid and semiarid regions in Mongolia and northern China during spring 2006. The positive anoma-lies of surface high pressure registered an abnormal high of 4–10 hPa in the Tamil Peninsular make a stronger cold air source for the repeated cold air outbreak across the desert ar-eas in spring 2006 resulting in the most frequent SDS sar-easons in the last 10 years in Northeast Asia.
Correspondence to: Y. Q. Yang
1 Introduction
Spring 2006 was regarded as one of the most frequent sand/dust storms (SDS) seasons in the last 10 years in north-east Asia. For example the dust fall in Beijing on 17 April 2006 was estimated to be 330 k tons which translated corre-spondingly into 20 kg per capita in Beijing. Damages were also reported in Mongolia, China, Korea and Japan (Yang et al., 2006; Zhang, 2006).
SDS episode is influenced by synoptic circulation patterns of both regional and global scales (Franzen, 1995; Wang et al., 2006; Xu, 1997; Zhao, 1993). Around the lati-tude band of 40◦N where arid and semiarid areas are
lo-cated, such as the area of Mongolia, North of China, Sahara of Africa, westerly jet stream carries the wind-blown dust particles and transports them into other parts of the globe (Zhang et al., 1999). Recent researches point out that the fre-quent occurrence of the sand/dust storm is one of the char-acteristics of global climate changes. There are complex in-teractions and influences between sand/dust storm and cli-mate (Zhang et al., 2002). It is found that Asian sand/dust originated from the desert area by surface wind in Asia is transported through westerly jet stream aloft to a long dis-tance that includes North Pacific and North America. Al-though changes in atmospheric dust concentrations may trig-ger large-scale climate responses, as suggested by Zhang et al. (2002), the feedback between dust and climate can also be viewed as a mechanism by which the monsoon climate can be modulated by the dusts’ radiative effects, including any attendant effects on the hydrological cycle. That is, the climatic conditions governing dust transport may be sensitive to the dusts’ effects on atmospheric circulation and precipita-tion that result from dust-induced changes to the land/ocean temperature structure.
26 Y. Q. Yang et al.: Northeast Asia SDS and 3-D large-scale circulations
Surface conditions and winds in the desert areas are two major factors controlling sand/dust production (Gong et al., 2003). Global and regional circulations govern the frequency of SDS occurrence in Northeast Asia through their impacts on surface winds and surface conditions including vegeta-tion, snow covers and soil moisture in the desert areas. The circulations could also influence Asian dust transport. It is very important to establish a relationship between the SDS and weather patterns in order to improve our understand-ing of the SDS processes and enhance our ability for the forecasting of them (Qian et al., 2002a; Yang et al., 2006). Wang et al. (2003, 1995) analyzed the spatial and tempo-ral distributions of dust storm weathers in Northern China and showed the characteristics of them. Using the network monitoring data, the dust storm and floating dust weathers in China and the trends and inter-annual variations of the dust storm weathers were also obtained (Qian et al., 2002b; Zhou, 2001). Nevertheless, the analysis of large-scale circulations and its anomaly characteristics such as the meridional wind anomalies and polar vortex and their relationship with SDS occurrence is not well understood.
In this paper a definition method of SDS process will be discussed. And a study for the spring SDS in 2006 and its synoptic weather analysis is given. Comprehensive data sets are used in this study that include the surface dust concentra-tion monitoring net work, FY-2C satellite retrieval, weather data from 2456 CMA (the China Meteorological Administra-tion) weather monitoring stations, WMO data and NCEP re-analysis data. It is aimed to link the anomalies of the major synoptic circulations to the SDS occurrence in spring 2006 and investigate the role of these anomalies in the processes of dust production and transports.
2 SDS processes in Northeast Asia
2.1 Criteria for defining and classifying a SDS event and process
A SDS event is usually defined in terms of visibility and wind speed at a location (Chen et al., 2004). Accord-ing to the meteorological observation standard defined by CMA. (CMA, 1979), the weather phenomenon of a general SDS can be classified into four levels for reporting purpose, i.e. floating dust, blowing dust, sand/dust storm (SDS), and severe sand/dust storm. A floating dust event is defined, when dust and fine sands floating in the air can be observed in an evenly distributed manner, with light breeze, or wind-less near the surface of the premises where the observation is made with a horizontal visibility less than 10 km. For blow-ing dust, winds blow up dust or sand from the ground, with a horizontal visibility between 1 km and 10 km. When a SDS occurs, strong winds stir up a turbid air by blowing up dust or sand from the ground, left a horizontal visibility of 500 m– 1000 m. A severe SDS blows up dust or sand particles from
the ground in an aggressive manner, causing a heavily con-taminated air with a horizontal visibility less than 500 m.
To give a nicety definition of SDS process and making a comparative and relative standard of SDS is very important. A certain number of SDS events to be prescribed as a SDS process in a particular area, so called “affected areas with SDS features”, (Wang et al., 2006) have been used. The standard to classify the SDS processes are considered both WMO’s standard for observation density and the practical standards applied to intensive observations at major sand-dust monitoring sites. Global synoptic data exchanged via WMO’s GTS at 00061218UTC, and Chinese domestic syn-optic data collected at 00:00, 03:00, 06:00, 09:00, 12:00, 15:00, 18:00, 21:00 UTC, are used as major evidences for classifying the SDS processes affecting the northeast Asia. No separate efforts have been made to characterize the float-ing dust weather process. The criteria for classifyfloat-ing a SDS process are defined as follows.
1. Within the existing WMO- and CMA - monitoring net-work of meteorological stations in northeast Asia, the num-ber of stations observing sand dust phenomenon could be used to determine the sand dust area. A blowing dust storm (BLDS) process begins when a blowing dust phenomenon meantime occurs in five or more adjacent stations over an area under the same synoptic system. The BLDS process ends with the termination of the synoptic system or the dis-appearance of blowing dust phenomenon.
2. The definition of SDS- and SSDS (severe SDS)- process are base on the same principle for BLDS as mentioned above. The only difference is a SDS- or SSDS- process is registered as onset, when the SDS- or SSDS- phenomena are observed from three or more adjacent stations over an area at a given time.
3. The highest–level class of SDS process will be recorded if two or three processes of BLDS, SDS and SSDS are met at the same time under the same synoptic system.
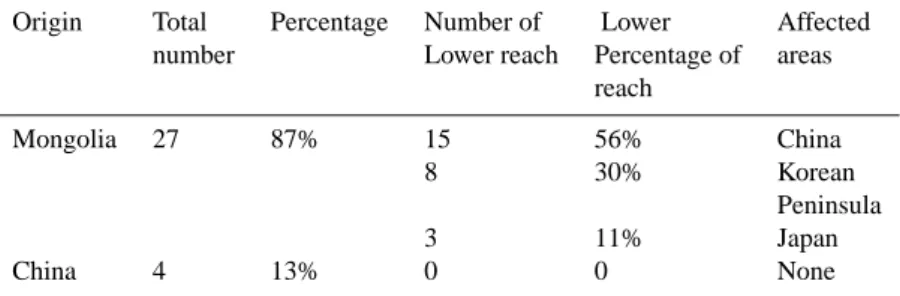
2.2 Frequency of spring SDS across the northeast Asia Based on the above definition and classification, an analysis has been made to the origins of the SDS processes across the northeast Asia in spring 2006. The study shows that the northeast Asia had 31 SDS processes in the spring of 2006, 27 of which, or 87% of the total, originated from the deserts of Mongolia and 26 transferred to the lower reach areas, af-fecting a number of parts of the region, including China, Ko-rean Peninsula, and Japan. During the same period, only 4 of the total 31 processes were originated from China (Table 1). However, China was affected by 15 SDS processes that had an origin from Mongolia and got reinforced in the course of the lower reach transportation, by the sand sources across the desert areas of north China. In this context, 19 SDS processes all together find in China,under the combined influence of long range transport and local origin. Of them, 5 were rated as severe SDS, 8 SDS and 6 blowing dust processes.
Table 1. The calculation of percentage for sand/dust storm processes over the Northeast Asia in the spring of 2006.
Origin Total Percentage Number of Lower Affected number Lower reach Percentage of areas
reach Mongolia 27 87% 15 56% China 8 30% Korean Peninsula 3 11% Japan China 4 13% 0 0 None
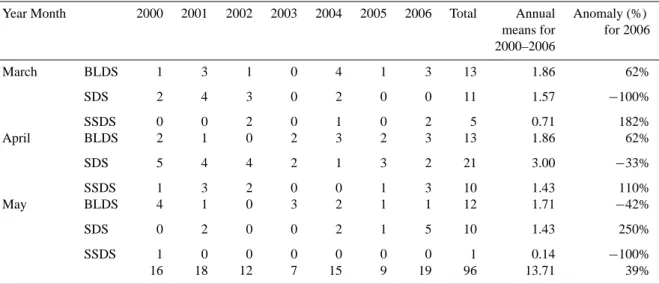
To further illustrate the severity of SDS in spring 2006, a compared analysis of the sand/dust storm processes affecting China since 2000 was given in Table 2. 5 SDS processes occurred in March, with 21% more than the average. 8 pro-cesses find in April with 27% up over the seven-year average. 6 SDS processes occurred in May with 82% more than the seven-year average (Table 2). Table 2 also shows the SDS frequencies during the year 2000–2006 in three categories: blowing dust storm (BLDS), sand/dust storm (SDS), and se-vere SDS (SSDS). It is indicated that the most number of SDS processes has been find in 2006 since 2000, with 39% higher than the average of the preceding seven years. 2.3 Synoptic features of SDS processes in spring 2006 An analysis comparing the genesis and dying out of SDS pro-cesses in the springs since the year from 2000 shows that the sand/dust storms affecting China in the spring of 2006 have the following features:
2.3.1 Early onset for severe SDS
Table 3 shows that two severe SDS processes occurred in March 2006, with an increased frequency of 182%, com-pared with the average of the past seven years. Under the influence of the cold air outburst, the first severe SDS process took shape over the west part of Mongolia at 14 h, 8 March 2006. 21 h later (1100, 9 March) it made its impacts on the north of China. It furthered its course in the following hours to affect ten provinces, including western part of China,north of China and northeast of China. After that, it made an east-ward transportation, and reached the Korea Peninsula in 30 h (1700, 10 March). The episode became the earliest severe SDS process in the spring of 2006, with an extensive affected area. It also makes the earliest severe SDS process with a widest coverage since the years from 2000.
2.3.2 Most frequent SDS in April
There are 8 sand/dust storm processes came through China in April 2006, of which 3 were rated as severe SDS processes, 2 SDS processes, and 3 blowing dust process. In the past
Table 2. A frequency comparison of total SDS hit China during the
period of 2000–2006
Year March April May Subtotal 2000 3 8 5 16 2001 7 8 3 18 2002 6 6 0 12 2003 0 4 3 7 2004 7 4 4 15 2005 1 6 2 9 2006 5 8 6 19 Total 29 44 23 96 Averaged 4.14 6.29 3.29 13.71 Anomaly 21% 27% 82% 39% percentage for 2006
years since 2000, it was rare to see 2 severe SDS and 1 SDS occured in a short period of 7 days from 5 April to 11 April. This leads to a sharply raised frequency of 110% for the oc-currence of severe SDS processes over the average of the past years.
2.3.3 Heavy dust fall
All 19 sand/dust storm processes processes affecting China were accompanied by floating dust. This is especially true to the severe SDS process from Mongolia affecting Beijing area on 16–18 April 2006. According to incomplete figures, Beijing had a dust fall of 330 000 tons of sand-dust, which resulted in a seriously contaminated air rated Grade-5 indi-cating the very poor air quality.
The cold air break out associated with the synoptic sys-tems are occurred frequently in the north of China and its surrounding area. Such the synoptic systems, Mongolia cy-clones, north-eastern depression of China are very often oc-curred in those area. It provided favorable conditions for SDS process development.
28 Y. Q. Yang et al.: Northeast Asia SDS and 3-D large-scale circulations
Table 3. Comparison of SDS frequency in 2000–2006 for three types of SDS: blowing dust storm (BLDS), sand/dust storm (SDS), and
severe SDS (SSDS).
Year Month 2000 2001 2002 2003 2004 2005 2006 Total Annual Anomaly (%) means for for 2006 2000–2006 March BLDS 1 3 1 0 4 1 3 13 1.86 62% SDS 2 4 3 0 2 0 0 11 1.57 −100% SSDS 0 0 2 0 1 0 2 5 0.71 182% April BLDS 2 1 0 2 3 2 3 13 1.86 62% SDS 5 4 4 2 1 3 2 21 3.00 −33% SSDS 1 3 2 0 0 1 3 10 1.43 110% May BLDS 4 1 0 3 2 1 1 12 1.71 −42% SDS 0 2 0 0 2 1 5 10 1.43 250% SSDS 1 0 0 0 0 0 0 1 0.14 −100% 16 18 12 7 15 9 19 96 13.71 39%
3 Variation and anomalies of general circulation
Studies indicated that SDS phenomena usually occurred un-der the conditions of complicated atmosphere activities in dynamical and thermodynamical process, but the weather circulation in multi-scale interaction can push emission of SDS and offer an organized system for SDS form and its transportation in a long distance. An analysis of the evo-lution and variation of 3-D structures of large-scale circula-tion over the lower and middle level of troposphere, from the winter of 2005 to the spring of 2006, was done using NCEP-NCAR reanalysis data to link their roles in and contributions to the raising frequency of SDS across the northeast Asia in the spring of 2006.
3.1 Evolution of circumpolar vortices over the Northern Hemisphere
A circumpolar vortex in the Northern Hemisphere is a seasonal-scale circulation system, playing an important mod-ulator role in the seasonal transition (Zhang and Wang, 1995; Zhu and Lin, 1981). Its scope and intensity variations impose a larger impact on the cold air activities across the Eurasian continents, especially for the transitional period from winter to spring.
A 100 hPa geopotential height field comparison between 2006 having most sand/dust episodes, and 2003 enjoying least sand/dust episodes (Fig. 1) shows that:
1. There is a strong circumpolar vortex over 100 hPa in the February of both 2006 and 2003, with a similar sphere of influence. However, there is a noticeable high center in the 100 hPa circumpolar vortices of 2006 (small oval in Fig. 1a).
2. A comparison between February and March of 2006 (small oval in Fig. 1a) shows that the high-value center gains a substantial development across the 100 hPa cir-cumpolar vortices from February through March, with an extensive coverage (large oval in the lower chart of Fig. 1a). This makes a significant difference against the 100 hPa circumpolar vortices of 2003. There is no high-value center in the circumpolar vortices of 2003. 3. There is a fast developing high-value center in the
cir-cumpolar vortices of 2006, which pushes the prevailing circumpolar vortices further to an area close to 52 N. The circumpolar vortices travel southwards, and domi-nate a large area across the northeast hemisphere, for a long duration. The circumpolar vortices of 2003 keep up a stable status with limited motion. There are no no-ticeable variations from February to March, in terms of dominating areas.
3.2 Anomalies of mid-tropospheric circulations
Figure 2 is calculated the anomaly fields which are relative to the mean from 1971–2000. In general the anomaly fields can describe what is the meanly difference from its average sta-tus in the atmospheric circulations. For example, an anomaly southward meridional circulation in the Fig. 2 means a south-ward current could be very stronger then those in the average circulation status.
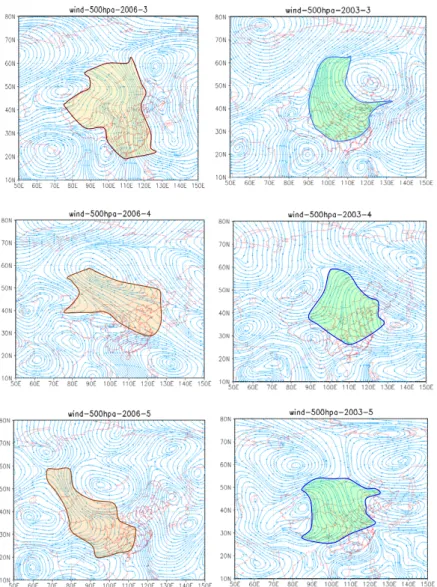
Figure 2a shows a 500 hPa wind field anomaly for March (upper chard), April (mid chard) and May (lower chard) 2006. It indicates that in the anomaly wind field, there is a significant southward current occupied about 2/3 part of China area at the mid-level troposphere from Baikal Lake to
(a) (b)
Fig. 1. 100 hPa geopotential height fields in February–March 2006 (left), and February–March 2003 (right) (oval area in Fig. 1a shows high
value center.) (Unit: m*10).
most part of China for March (shadow area shows in Fig. 2a upper). The area for the northern of China, south part of North-east of China and north to the Yangtse River prevailed by a stronger southward current anomaly in April (shadow area shows in Fig. 2a mid chard). Also the area of western part of China, center of China and south-western of China was prevailed by the stronger southward current anomaly in May (shadow area shows in Fig. 2a lower chard) 2006. The shadow areas in Fig. 2a are just consistent with the up-steam area notorious for desertification, including the Mongolia, north part of China, Hexi Corridor stands. Once sands and stirred and blown up from ground, the mid-level southward abnormal current will be easier to make a powerhouse en-ergizing for long distance transport of sand and dust. As it was mentioned earlier, this abnormal southward current right over a lower reach area made up of the mid and west parts of Mongolia, and an array of deserts in north China, includ-ing the Badain Juran Desert, the Kubuqi (Hobq) Desert, and the Onqin Daga sandy land that are sensitive to the sand-dust processes. In this context, the area from north China to the Hexi Corridor, tends to be under the influence of lower
troposphere, which is desirable for an ascending turbulence and blowing sand/dust up from ground.
The circulation for March, April and May 2003 (Fig. 2b) presents a completely different distribution pattern of 500 hPa field anomaly.The shadow area with a noticeable northward wind field anomaly appeare there. It is mainly consistent with the area of Mongolia, the northern part, the west part, the center part of China and north to the Yangtse River. All these are not in a position to create a condition favorable for the long distance transport as it was in 2006. In this context, of northward current anomaly at the mid-level troposphere, which also covered with the major sand-dust sources of the northeast Asia, makes another reason behind the reduced frequency of sand/dust episodes in 2003. 3.3 Anomalies of meridional wind field at the lower
tropo-sphere
As we know, the meridioal winds are more important factor that triggers up the onset of sand dust process in the lower atmosphere (especially from 850 hPa to surface). It is well
30 Y. Q. Yang et al.: Northeast Asia SDS and 3-D large-scale circulations
(a) (b)
Fig. 2. 500h Pa wind field anomaly for March to May of 2006 (a), and March to May of 2003 (b) (shadow area in Fig. 2a shows southward
wind anomalies, shadow area in Fig. 2b shows northward wind anomalies.)
known that Asia dust storms are caused by cold air break associated with cold fronts with the strong meridional (south ward) winds sweeping southwards across Northeast Asia.
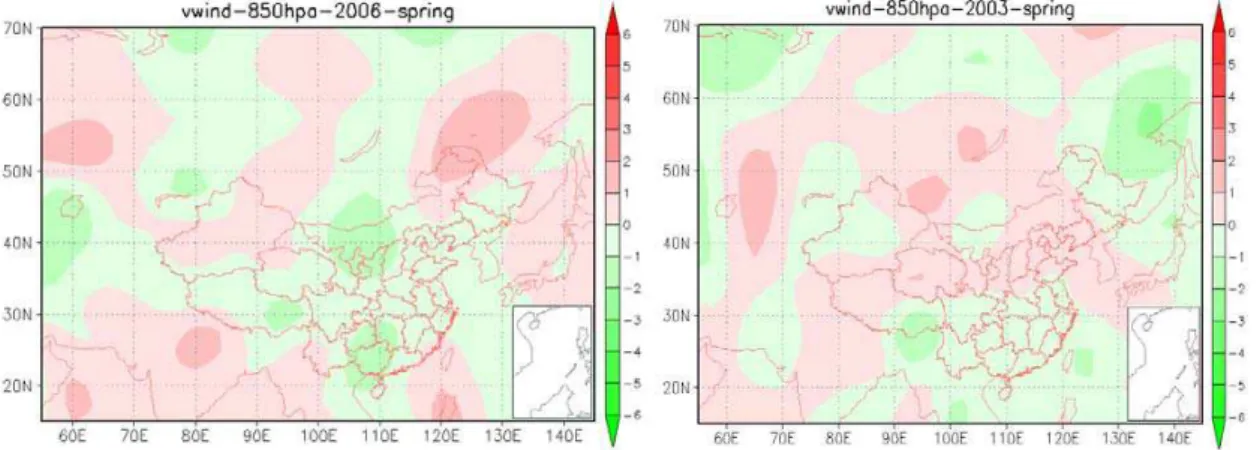
Figure 3 is calculated an anomaly meridianal wind field for the spring of 2006 from the average winds by the years of 1971–2000.
It can be seen from the Fig. 3a that compared with nor-mal year, at the lower troposphere (850 hPa), a strong nega-tive anomaly of meridional winds (southward wind anomaly) with an unusually strong wind speed anomalies of 1–2 m/s has recorded in a vast area, ranging from Mongolia to most part of China including western, north and center of China, south part of North-east of China and south of China.
High meridional momentum just covered in the major sand source of the northeast Asia mentioned above. It is a favor-able condition for triggering up the turbulence movement at
the boundary layer, which led to sand blowing and sending a downward transport. This makes an important footprint to explain the increased outbursts of sand/dust storms in 2006.
Figure 3b shows the distribution of 850 hPa meridional wind anomaly in the spring of 2003. It can be seen that major sand effecting area of the northeast Asia, including Mongo-lia, northwest China, north China, the southern part of north-east China, Korea Peninsula, and south of Japan, have been well covered by the positive anomaly of meridional winds (northward wind anomaly).
As we mentioned above, those situation are not a favorable condition for cold air break associated with stronger merid-ional northward winds anomalies.
Fig. 3. Meridional wind anomalies at 850 hPa for spring 2006 (a) and spring 2003 (b).
(a) (b)
Fig. 4. Sea level pressure anomalies. (a) for Winter 2005 (upper) and Spring 2006 (lower) and (b) for Winter 2002 (upper) and Spring 2003
(lower).
3.4 Evolution of sea level pressure anomalies
Figure 4a shows the distribution of sea level pressure anomaly for the winter of 2005 (upper), and the spring of 2006 (lower). The distribution of sea level pressure anomaly for the winter of 2002 (upper), and for the spring of 2003
(lower) is given in Fig. 4b. A comparison between Fig. 4a and Fig. 4b indicates that:
(a) In the winter of 2005, an area from the Tamil Peninsu-lar to Siberia on the Northern Hemisphere was affected by an extremely strong polar high, with an annual positive anomaly as high as 6–12 hPa, with a large coverage (Fig. 4a upper). It
32 Y. Q. Yang et al.: Northeast Asia SDS and 3-D large-scale circulations
is well known that the Tamil Peninsular is a key source of cold air for the northeast Asia. The positive anomaly area in 2002 only affected a limited part of the northwest Europe, with a weak intensity (Fig. 4b upper).
(b) In the spring of 2006, in the Northern Hemisphere had a polar high at the sea level pressure chart. It moved in a south-eastwards (Fig. 4a lower). The positive anomaly high center, originally located at the Tamil Peninsular, was shifted to the Bering Strait. At the same time, another pos-itive anomaly high center, originally sat at the Greenland area, moved in the eastwards to the Tamil Peninsular. On the contrary, in the transitional period from winter to spring of 2003, in the Northern Hemisphere,the polar high pressure shows only an apparent shift, with a noticeably weak posi-tive anomaly center, and only a limited sphere of influence there (Fig. 4b lower). Meanwhile, the negative anomaly of the Tamil Peninsular got reinforced.
4 Conclusions
Through the discussing in this paper some conclusions can be drawn:
1. A definition of sand/dust storm process as a new stan-dard of sand dust storm (SDS) for Northeast Asia, which groups a number of SDS-events in a period and region ac-cording to the synoptic system controlling the SDS-events in Northeast Asia has been given.
2. The evolutions and anomalies of general circulation in the troposphere are analyzed by comparing the spring having most and least occurrence of SDS process in the year 2006 with the year 2003. The results are indicated as followings.
(1) In the upper troposphere 100 hPa, it is found that, there is a fast developing high-value center in the circumpolar tices of 2006, which pushes the prevailing circumpolar tices further to an area close to 52 N. The circumpolar vor-tices travel southwards, and dominate a large area across the Northeast Hemisphere for a long duration. The circumpo-lar vortices of 2003 keep up a stable status with limited mo-tion. So, there are no noticeable variations from February to March, in terms of dominating areas.
(2) Comparing with a normal year, the structures of po-lar circulations over the Northern Hemisphere are noticeably different at the mid-level troposphere 500 hPa in 2006, espe-cially with the year enjoying a reduced frequency of SDS in 2003. It shows that the southward wind anomaly was found in March, April and May 2006. It indicates that because of a significant northwestern wind current occupied about 2/3 part of China area at the mid-troposphere 500 hPa, once sand stirred and blowned up from ground, the mid-level south-ward abnormal current will be easier to be a powerhouse en-ergizing for long distance transport of sand and dust. This has played an important role in causing frequent attacks of cold air, triggering up the blowing dust and subsequent lower reach transport. The circulation for March, April and May
2003 presents a completely different distribution pattern of 500 hPa field anomaly with a noticeable northward wind field anomaly. All these are not in a position to create a condition favorable for the long distance transport as it was in 2006. The some characteristics could be found at lower-level tro-posphere 850 hPa.
(3) At the surface, the positive anomaly high center, origi-nally located at the Tamil Peninsular, a key cold air source in the northeast Asia is found in the spring of 2006. It leads a southward shift of cold air, with a large coverage of the north-east hemisphere, and a long duration, which is favourable of the higher frequency activities of SDS processes. On the con-trary, in the transitional period from the winter to spring of 2003, polar high in the Northern Hemisphere did not show an apparent shift, with a noticeably weak positive anomaly center, and limited sphere of influence.
It is very important to understanding and studying the foot-prints of 3-D global circulations that affect the SDS system for raising the operational capability of monitoring and early warning of SDS weathers. The effort also benefits an im-proved understanding of the genesis, development, and long distance transport of sand/dust storms.
Acknowledgements. The authors wish to thank for the
fi-nancial supports from the National Basic Research Program (973) (2006CB403701 and 2006CB403703) and the MOST (2004DIB3J115) of China for this project. Special thanks to X. Y. Zhang of Chinese Academy of Meteorological Sciences and S. Gong of Environment Canada for his scientific advice and hard work to polish this manuscript.
Edited by: S. Gong
References
Chen, X. G., Zhang, C. J., and Dong, A. X.: Classification of sand/dust storm processes in Gansu Province, and associated sta-tistical analysis, Journal of Plateau Meteorology, 23(3), 371— 381, 2004.
CMA: Regulations of Surface Meteorological Observation, Beijing, China, Meteorological Press, 21–27, 1979.
Franzen, L. G.: The Saharan dust episode of southern and central Europe and northern Scandinavia March, Weather, 50, 313–318, 1995.
Gong, S. L., Zhang, X. Y., Zhao, T. L., McKendry, I. G., Jaffe, D. A., and Lu, N. M.: Characterization Of Soil Dust Dis-tributions In China And Its Transport During ACE-ASIA 2. Model Simulation and Validation, J. Geophys. Res., 108, 4262, doi:10.1029/2002JD002633, 2003.
Qian, W., Quan, L., and Shi, S.: Variability of the Dust Storm in China and its Climatic Control, J. Climate, 15, 1216–1229, 2002a.
Qian, Z. A., Song, M. H., and Li, W. Y.: Distribution and variation of sand/dust storms in north China in last 50 years, Journal of China Desert Research, 22, 106–111, 2002b.
Sun, J. and Yao, X. P.: Numerical diagnosis of frontogenesis pro-cess of a sand/dust storm, and associated surface thermal flux, Journal of Plateau Meteorology, 21, 488–494, 2002.
Wang, S. G., Wang, J. Y., and Zhou, Z. J.: Regional features of China’s sand/dust storms, J. Geography, 58, 193–200, 2003. Wang, S. G., Yang, D. B., and Jin, J.: An analysis of spatial and
temporal distribution and causes of sand/dust storms in north-west China Proceedings of 2nd China Association for Science and Technology annual meeting for young scientists (resources and environmental science), China S and T Press, Beijing, 364– 370, 1995.
Wang, Y. Q., Arimoto, R., and Zhang, X. Y.: The Contribution from Distant Dust Sources to the Atmospheric Particulate Mat-ter Loadings at XiAn, China during Spring, Sci. Total. Environ., 368, 875–883, 2006.
Xu, Q. Y.: Spatial and temporal distribution of sand/dust storms in northwest China, China Meteorological Press, 11–l5, 1997. Yang, Y. Q., Zhang, X. Y., Hou, Q., Zhou, C. H., Wang, Y. Q., Niu,
T., Liu, H. L., and Gong, S. L.: An analysis of China’s sand/dust storms in the spring of 2006, Proceedings of Chinese Society of Meteorology annual meeting for 2006, 223, 2006.
Zhang, D. E. and Wang, J. H.: Preliminary studies on atmospheric circulation and synoptic-dynamic conditions for dustfall pro-cesses, in: Loess, edited by: Liu, T. S. and An, Z. S., Quaternary Geology, Global Change, Science Press, Beijing, pp. 151–157, 1992.
Zhang, X. Y.: Sand/dust storms of the northeast Asia in the spring of 2006, China Meteorological Press, 9–19, 2006.
Zhang, X. Y., Arimoto, R., and An, Z. S.: Glacial and interglacial patterns for Asian dust transport, Quaternary Sci. Rev., 18, 811– 819, 1999.
Zhang, X. Y., Liu, H. Y., Arimoto, R., and Gong, S. L.: Atmospheric Dust Loadings and Their Relationship to Rapid Oscillations of the Asian Winter Monsoon Climate: Two250-ka Loess records, Earth Planet. Sc. Lett., 202, 637–643, 2002.
Zhao, X. L.: Damages of severe sand/dust storms in Gansu Province and associated countermeasures, Journal of China Desert Re-search, 13, 1–7, 1993.
Zhou, Z. J.: Blowing dust and sand/dust storm processes in last 45 years, J. Quaternary Study, 21, 9–17, 2001.
Zhu, Q. G. and Lin, J. R.: Principles and Methods of Synoptic Me-teorology, China Meteorological Press, Beijing, 48–102, 1981.