HAL Id: insu-01326834
https://hal-insu.archives-ouvertes.fr/insu-01326834
Submitted on 6 Jun 2016
HAL is a multi-disciplinary open access
archive for the deposit and dissemination of
sci-entific research documents, whether they are
pub-lished or not. The documents may come from
teaching and research institutions in France or
abroad, or from public or private research centers.
L’archive ouverte pluridisciplinaire HAL, est
destinée au dépôt et à la diffusion de documents
scientifiques de niveau recherche, publiés ou non,
émanant des établissements d’enseignement et de
recherche français ou étrangers, des laboratoires
publics ou privés.
topography above an oceanic ridge collision: Southern
Patagonian Andes (47°S), Chile
Viktoria Georgieva, Daniel Melnick, Taylor Schildgen, Todd Ehlers, Yves
Lagabrielle, Eva Enkelmann, Manfred Strecker
To cite this version:
Viktoria Georgieva, Daniel Melnick, Taylor Schildgen, Todd Ehlers, Yves Lagabrielle, et al.. Tectonic
control on rock uplift, exhumation, and topography above an oceanic ridge collision: Southern
Patago-nian Andes (47°S), Chile. Tectonics, American Geophysical Union (AGU), 2016, 35 (6), pp.1317-1341.
�10.1002/2016TC004120�. �insu-01326834�
Tectonic control on rock uplift, exhumation, and topography
above an oceanic ridge collision: Southern Patagonian
Andes (47°S), Chile
Viktoria Georgieva1, Daniel Melnick1,2, Taylor F. Schildgen1,3, Todd A. Ehlers4, Yves Lagabrielle5, Eva Enkelmann6, and Manfred R. Strecker1
1
Institute of Earth and Environmental Science, University of Potsdam, Potsdam-Golm, Germany,2Facultad de Ciencias, Escuela de Geología, Universidad Austral de Chile, Valdivia, Chile,3Helmholtz-Zentrum Potsdam, Deutsches GeoForschungsZentrum
GFZ, Potsdam, Germany,4Department of Geosciences, University of Tübingen, Tübingen, Germany,5Geosciences Rennes UMR 6118, Université de Rennes 1, Rennes, France,6Department of Geology, University of Cincinnati, Cincinnati, Ohio, USA
Abstract
The subduction of bathymetric anomalies at convergent margins can profoundly affect subduction dynamics, magmatism, and the structural and geomorphic evolution of the overriding plate. The Northern Patagonian Icefield (NPI) is located east of the Chile Triple Junction at ~47°S, where the Chile Rise spreading center collides with South America. This region is characterized by an abrupt increase in summit elevations and relief that has been controversially debated in the context of geodynamic versus glacial erosion effects on topography. Here we present geomorphic, thermochronological, and structural data that document neotectonic activity along hitherto unrecognized faults along theflanks of the NPI. New apatite (U-Th)/He bedrock cooling ages suggest faulting since 2–3 Ma. We infer the northward translation of an ~140 km long fore-arc sliver—the NPI block—results from enhanced partitioning of oblique plate convergence due to the closely spaced collision of three successive segments of the Chile Rise. In this model, greater uplift occurs in the hanging wall of the Exploradores thrust at the northern leading edge of the NPI block, whereas the Cachet and Liquiñe-Ofqui dextral faults decouple the NPI block along its eastern and westernflanks, respectively. Localized extension possibly occurs at its southern trailing edge along normal faults associated with margin-parallel extension, tectonic subsidence, and lower elevations along the Andean crest line. Our neotectonic model provides a novel explanation for the abrupt topographic variations inland of the Chile Triple Junction and emphasizes the fundamental effects of local tectonics on exhumation and topographic patterns in this glaciated landscape.1. Introduction
The collision of oceanic ridge segments at subduction margins can significantly affect the structural, magmatic, and topographic evolution of the overriding plate [Scholz and Small, 1997; Gräfe et al., 2002; Taylor et al., 2005; Groome and Thorkelson, 2009]. Upper plate responses to ridge collision include an increase in interplate coupling and subduction erosion [Maksymowicz et al., 2012], near-trench mag-matism [Bourgois et al., 1996; Lagabrielle et al., 2000], fore-arc uplift and deformation [Taylor et al., 1987; Hsu, 1992; Gardner et al., 1992; Collins et al., 1995; Sak et al., 2009; Margirier et al., 2015], as well as decou-pling and motion of large fore-arc slivers [Forsythe and Nelson, 1985; Cembrano et al., 2002; Witt et al., 2006; Michaud et al., 2009; Melnick et al., 2009]. Furthermore, the collision of an active oceanic spreading center leads to the formation of a slab window below the overriding plate, where hot asthenospheric mantle rises through the gap created between the two diverging plates and thus modifies the thermal structure and buoyancy state of the upper plate [Thorkelson, 1996; Breitsprecher and Thorkelson, 2009; Groome and Thorkelson, 2009; Guenthner et al., 2010; Guillaume et al., 2013]. The formation of a slab win-dow has been specifically associated with modifications of upper mantle structure and asthenospheric flow [Murdie et al., 1993; Groome and Thorkelson, 2009; Guillaume et al., 2010; Russo et al., 2010b], a gap in arc volcanism [Ramos and Kay, 1992; Gorring et al., 1997], back-arc extension [Lagabrielle et al., 2007; Scalabrino et al., 2010; Scalabrino et al., 2011], and volcanism with an asthenospheric signature [Gorring et al., 1997; Guivel et al., 2006; Boutonnet et al., 2010]. Finally, an areally extensive region of upper plate dynamic uplift creating up to a few hundred meters of transient dynamic topography has been modeled in slab window settings [Groome and Thorkelson, 2009; Braun, 2010; Guillaume et al., 2010, and references therein]. Such a long-wavelength pulse of dynamic uplift and ensuing exhumation
Tectonics
RESEARCH ARTICLE
10.1002/2016TC004120
Key Points:
• Apatite (U-Th)/He thermochronometry records neotectonic activity inland of the Chile Triple Junction
• Decoupling and margin-parallel movement of a fore-arc sliver at the Chile Triple Junction
• Impact of oceanic ridge collision on upper plate topography
Supporting Information: • Supporting Information S1 • Data Set S1 • Data Set S2 • Data Set S3 Correspondence to: V. Georgieva, viktoria@geo.uni-potsdam.de Citation:
Georgieva, V., D. Melnick, T. F. Schildgen, T. A. Ehlers, Y. Lagabrielle, E. Enkelmann, and M. R. Strecker (2016), Tectonic con-trol on rock uplift, exhumation, and topography above an oceanic ridge collision: Southern Patagonian Andes (47°S), Chile, Tectonics, 35, doi:10.1002/ 2016TC004120.
Received 2 JUN 2015 Accepted 13 APR 2016
Accepted article online 28 APR 2016
©2016. American Geophysical Union. All Rights Reserved.
has been proposed for the Antarctic Peninsula above the colliding Antarctic-Phoenix spreading center [Guenthner et al., 2010] and for Southern Patagonia above the Patagonian slab window [Guillaume et al., 2009; Guillaume et al., 2010; Braun et al., 2013; Guillaume et al., 2013; Jeandet, 2014].
In the Patagonian Andes, an abrupt and major increase of both summit elevations and local relief along the orogenic crest occurs immediately inland of the Chile Triple Junction (CTJ), where the Chile Rise col-lides with the South American continent (Figure 1). Collision has resulted in opening of an areally exten-sive slab window below Southern Patagonia [Cande and Leslie, 1986; Cande et al., 1987; Murdie et al., 1993; Breitsprecher and Thorkelson, 2009; Russo et al., 2010a]. Recent studies have proposed dynamic sup-port of high topography above the Patagonian slab window as a plausible explanation for the sudden increase in summit elevations and relief, corresponding to some extent to the predictions of analog [Guillaume et al., 2010] and numerical models [e.g., Braun et al., 2013; Guillaume et al., 2013], as well as thermochronological data from the eastern foreland [Haschke et al., 2006; Thomson et al., 2010; Guillaume et al., 2013]. In an alternative interpretation, based on a thermochronology data set spanning the entire Patagonian Andes, Thomson et al. [2010] linked increased summit elevations in Southern Patagonia with latitudinal climate gradients and changes in the efficiency of glacial erosion, leading to protection of high topography from erosion and promotion of orogenic growth.
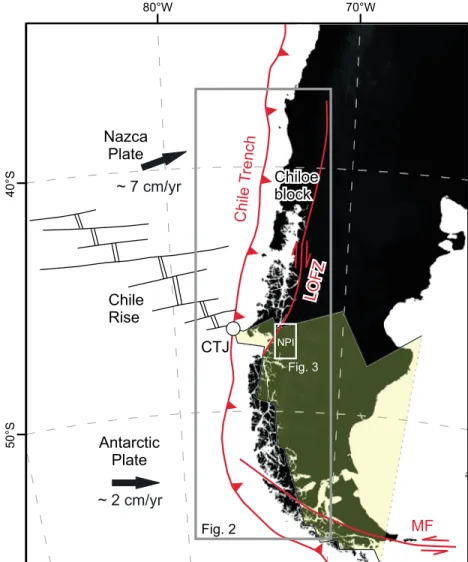
Figure 1. Tectonic setting and location of study area. The grey rectangle (Figure 2) spans the Patagonian Andes along the subduction margin of South America. The white rectangle (Figure 3) marks location of the Northern Patagonian Icefield (NPI). The yellow-shaded area outlines the present extent of the Patagonian slab window. CTJ: Chile Triple Junction, LOFZ: Liquiñe Ofqui Fault Zone, MF: Magallanes Fault.
While appealing in various aspects, neither of these hypotheses specifically accounts for the role of crustal tectonics along the continental margin, which has experienced oblique subduction, strain partitioning, and oceanic ridge collision since the middle Miocene [Breitsprecher and Thorkelson, 2009]. The oblique collision of the Chile Rise has been considered to be a major driver of transpressional defor-mation along the continental margin [Forsythe and Nelson, 1985; Murdie et al., 1993; Nelson et al., 1994], causing the detachment and northward translation of a large (>1000 km) crustal sliver—the Chiloé block [Forsythe and Nelson, 1985; Nelson et al., 1994; Cembrano et al., 2002; Rosenau et al., 2006; Melnick et al., 2009]. Ramos [2005] suggested that ridge collision enhanced shortening in the Andean fold-and thrust belt, resulting in uplift and higher topography south of the CTJ. However,field data show that shorten-ing perpendicular to the margin in this sector of the Andes ceased before the onset of ridge collision [Coutand et al., 1999; Suarez et al., 2000; Lagabrielle et al., 2004; Blisniuk et al., 2005; Scalabrino et al., 2011]. Thus, the link between topographic growth and possible neotectonic activity inland of the CTJ has not been fully explored.
We aim to address this lacuna and focus on the hypothesis that ridge collision triggered tectonic activity inland from the CTJ, with topographic impacts that were superimposed on those associated with other regional processes, such as glacial erosion and slab window-related dynamic uplift. Our investigation is based on geomorphological, geological, and structural observations from the Northern Patagonian Icefield (NPI)—the elevated area that marks the pronounced increase of summit elevations and relief immediately inland of the CTJ (46°30′S; Figure 2). Furthermore, we use low-temperature thermochronol-ogy (apatite (U-Th)/He dating) on bedrock samples to track exhumation patterns in the study area over the last several million years and assess those data in the context of mapped faults, glacial erosion
Figure 2. (a) Topography and tectonic setting of the Patagonian Andes. The shaded area outlines the present extent of the Patagonian slab window [Breitsprecher and Thorkelson, 2009]. The white circles and ages indicate the spatiotemporal path and present position of the Chile Triple Junction [Breitsprecher and Thorkelson, 2009]. The white arrows indicate plate con-vergence. The black rectangle locates Figure 3. The blue line corresponds to glacial extent during the Last Glacial Maximum. CTJ: Chile Triple Junction, LOFZ: Liquiñe-Ofqui Fault Zone, MF: Magallanes Fault. The dotted black line shows location of the latitudinal swath profile along the orogenic divide presented in Figure 2b. (b) Latitudinal swath profile (4-longitudinal-degrees width) including bathymetry. The red line represents swath profile of mean local relief calculated for 10 km radius moving window across the swath area. The grey shaded stripe indicates the abrupt increase in relief and summit elevations at the latitude of the Chile Triple Junction. NPI/SPI: Northern/Southern Patagonian Icefield.
processes, and the spatiotemporal evolution of ridge collision. Finally, we propose a tectonic model for the structural evolution of the margin that provides an alternative explanation for the topographic evolution inland from the CTJ.
2. Methods
2.1. Geomorphic and Structural Mapping
We surveyed geomorphic features and performed structural and geological mapping along theflanks of the Northern Patagonian Icefield (NPI). We used the SRTM-1 30 m resolution digital elevation model (DEM) as well as Google Earth and Advanced Spaceborne Thermal Emission and Reflection Radiometer (ASTER) satellite imagery for mapping faults at the macroscale (103–104m) and for morpho-metric analysis of displaced glacial landforms. At the outcrop mesoscale and microscale (10 1–102m), we mapped faults and collected structural data of fault planes and lineations with fault-kinematic indi-cators such as mineral-growth fabrics of slickensides to infer the sense of displacement. Data collection at outcrop scale was hampered by challenging access conditions and dense vegetation in this remote and glaciated region. The available outcrop-scale kinematic data are presented using the Stereonet 9 fault-analysis software by R. Allmendinger (http://www.geo.cornell.edu/geology/faculty/RWA/).
2.2. Sample Preparation and Analytical Methods
We collected 30 bedrock samples along the eastern and northern foothills of the NPI (Data Set S1 in the supporting information). After standard mineral separation procedures (jaw crushing, sieving, magnetic separation, and heavy liquids) we performed apatite (U-Th)/He (AHe) analyses on all samples. Clear, euhedral apatite grains mostly with diameters≥70 μm and without visible inclusions were selected using a binocular microscope. The grain dimensions were measured for the calculation of the alpha-correction factor [Farley et al., 1996]. Subsequently, single grains were packed in Nb-tubes for (U-Th)/He analysis.
We applied AHe thermochronometry to determine the exhumation history of bedrock samples as they pass through the upper 1–3 km of the crust [Wolf et al., 1996; Ehlers and Farley, 2003]. We analyzed 3 to 5 aliquots per sample using the Patterson Helium-extraction line at University of Tübingen (for details see the support-ing information). The analytical errors of the mass spectrometer measurements are generally very low and do not exceed 2%. In contrast, the reproducibility of the sample aliquots constitutes a much larger range. We therefore report the mean AHe age and the standard deviation of the measured aliquots as the sample error.
3. Regional Setting
3.1. General Tectonic and Geodynamic Setting
The fore-arc of the southern Andes comprises the Chile Triple Junction (CTJ), which joins the Nazca, Antarctic, and South American plates (Figure 2). North of the CTJ, the Nazca plate has been subducting in a northeast-erly direction since the early Miocene (20 Ma) [Pardo-Casas and Molnar, 1987; Kendrick et al., 2003] at a rate of ~7 cm/yr [Angermann et al., 1999; Kendrick et al., 2003; Wang et al., 2007; DeMets et al., 2010]. Oblique plate convergence in addition to collision of several oceanic ridge segments has resulted in the structural decou-pling of the Chiloé block from the rest of the orogen along the Liquiñe-Ofqui fault zone (LOFZ; Figures 1 and 2a) [Cembrano et al., 1996; Rosenau et al., 2006; Melnick et al., 2009]. The LOFZ constitutes a crustal-scale intra-arc, dextral-transpressional fault system extending >1000 km north of the CTJ that accommodates the margin-parallel component of oblique plate convergence [Cembrano et al., 2002; Thomson, 2002; Rosenau et al., 2006]. The LOFZ is seismically active [Lange et al., 2008; Agurto-Detzel et al., 2012] and has been asso-ciated with recent crustal earthquakes, volcanic activity, rock uplift, exhumation, and enhanced cooling that initiated between 16 and 10 Ma [Thomson, 2002; Cembrano et al., 2002; Rosenau et al., 2006]. The LOFZ is aligned with the Southern Volcanic Zone located 250–300 km inland of the trench, comprising volcanic units of Pliocene to Quaternary age that overlie the Northern Patagonian Batholith, an exhumed Jurassic-Miocene magmatic arc segment [Pankhurst et al., 1992; Seifert et al., 2005].
South of the CTJ, subduction of the Antarctic plate initiated at 16 Ma with collision of the Chile Rise with South America at ~54°S (Figure 2a) [Breitsprecher and Thorkelson, 2009]. The oblique collision geometry resulted in the northward migration of the CTJ as subsequent trench-parallel ridge segments collided. Since about 6 Ma, the CTJ has remained close to its present-day location due to the closely spaced collision of three relatively
short ridge segments at 6 Ma, 3 Ma, and 0.3 Ma in the Golfo de Penas region. Ridge collision has resulted in the opening of an asthenospheric slab window beneath southern Patagonia, which is rapidly widening due to the differences in convergence velocity between the Nazca and Antarctic plates relative to South America [e.g., Forsythe and Nelson, 1985; Breitsprecher and Thorkelson, 2009]. At present, the Antarctic Plate is subducting orthogonally below South America with a convergence rate of ~2 cm/yr [Wang et al., 2007].
3.2. Geomorphology and Geology of the Northern Patagonian Icefield
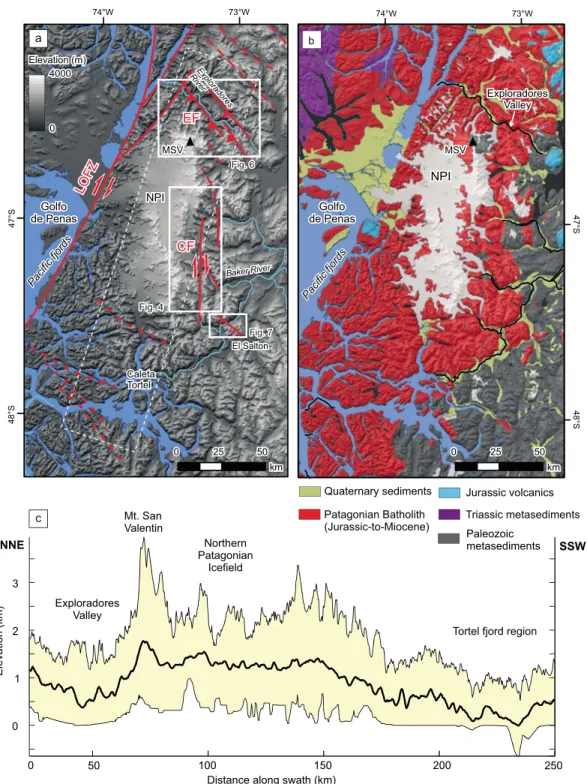
The Patagonian Andes extend over 2000 km, from 38°S to 53°S, parallel to the Andean subduction margin (Figure 2a). Since approximately 7 Ma, the orogen has been subjected to repeated, extensive glaciations [e.g., Mercer and Sutter, 1982; Ton-That et al., 1999; Singer et al., 2004; Hein et al., 2009; Lagabrielle et al., 2010] that have shaped the mountain belt. The topography of the Patagonian Andes reveals distinct variations along strike. North of 46°30′S (current location of the CTJ), maximum and mean elevations approach 2000 and 1000 m, respectively. Maximum relief (including the bathymetry of glacial fjords) is uniform, averaging 2000 m, with localfluctuations of several hundred meters associated with isolated volcanic summits or deep glacial fjords (Figure 2b). South of the CTJ, topography abruptly rises toward the peak summits of the NPI, with maximum elevations between 3000 and 4000 m, whereas mean elevations increase by several hundred meters and become more variable. Maximum relief doubles, becomes highly variable, and locally exceeds 5000 m, where the highest peaks are adjacent to deep glacial fjords (Figure 2b).
The NPI caps a high massif bounded by steepflanks. The ~3000 m high northern edge of the icefield includes Mount San Valentin (4058 m), Patagonia’s highest peak. From the northern edge, the ice plateau is gently inclined toward the south and punctuated by several high summits aligned along sigmoidal ridges (Figure 3a). In the southern foothills of the NPI surrounding Caleta Tortel, the rugged terrain and high summits abruptly change to a relatively subdued morphology, where mean and summit elevations drop below 500 and 1500 m, respectively. In this region, numerous fjords traverse the orogen reaching the eastern foreland, and reflecting the deep incision of former outlet glaciers, which connected with the NPI with the Southern Patagonian Icefield located further south (Figure 2).
The bedrock underlying the NPI comprises Paleozoic metamorphic rocks intruded by Jurassic to Miocene plutons of the Patagonian Batholith [Hervé et al., 2007] (Figure 3b). To the east of the NPI, Jurassic to Oligocene volcanic rocks and marine sedimentary units and Miocene synorogenic deposits record episodic shortening and uplift during the Late Cretaceous to Middle Miocene (22 to 14 Ma) [Coutand et al., 1999; Suarez et al., 2000; Lagabrielle et al., 2004; Blisniuk et al., 2005; Scalabrino et al., 2011]. Most shortening occurred during deposition of Early Miocene synorogenic sediments [Ramos, 1989; Lagabrielle et al., 2004; Blisniuk et al., 2005]. At 14 Ma, sedi-mentation rates dramatically decreased, as reflected by the limited thickness and extent of younger deposits [Blisniuk et al., 2005]. These sedimentary units (younger than 14 Ma) were not affected by shortening [Suarez et al., 2000]. Since 12 Ma, extensive plateau basalts with geochemical signatures of asthenospheric mantle likely associated with the evolving Patagonian slab window [Gorring et al., 1997; Guivel et al., 2006; Boutonnet et al., 2010] were emplaced in the eastern foreland on a gently eastward sloping surface, sealing the eastern thrust front of the Southern Patagonian Andes [Ramos, 1989; Lagabrielle et al., 2004]. Coutand et al. [1999] reported similar observations to the south at 49°S, where undeformed early Pliocene basalts unconformably overlie older shor-tened units. After 14 Ma, only minor Pliocene-to-recent extensional deformation has been documented within the former Patagonian fold-and-thrust belt [Suarez et al., 2000; Lagabrielle et al., 2007; Scalabrino et al., 2011]. Together, these observations suggest that lateral orogenic growth associated with an active fold-and-thrust belt terminated synchronously with the onset of ridge collision and slab window opening in Southern Patagonia [Suarez et al., 2000; Lagabrielle et al., 2007; Breitsprecher and Thorkelson, 2009; Scalabrino et al., 2011].
4. Geomorphic and Structural Observations
In this study we characterize neotectonic activity along the hitherto unrecognized Cachet, Exploradores, and El Salton faults, located respectively in the eastern, northern, and southeastern foothills of the NPI (Figure 3a).
4.1. Cachet Fault
The Cachet Fault is a N-S striking, dextral strike-slip fault spanning the eastern foothills of the NPI for at least 60 km (Figures 3a and 4). It follows a low-elevation corridor that defines a major axial drainage in the eastern
Figure 3. Study areas at the Northern Patagonian Icefield. (a) Topography (SRTM-1 30 m resolution) and tectonic structures (red lines) in the study area; LOFZ: Liquiñe-Ofqui Fault Zone, EF: Exploradores Fault Zone, CF: Cachet Fault, NPI: Northern Patagonian Icefield, MSV: Mount San Valentin. The white rectangles indicate location of Figures 4, 5, and 7. The stippled white rectangle indicates the area of the swath profile presented in Figure 3c. (b) Geological map of the Northern Patagonian Icefield modified after SERNAGEOMIN [2000], 1:1 Mio. Geological Map of Chile. (c) Swath profile along strike of the Northern Patagonian Icefield (white rectangle in Figure 3a). The vertical exaggeration factor ~ 26.
foothills of the NPI, which is perpendicular to the west-to-east regional drainage direction. A continuous seg-ment of the fault extends between the Pared Norte and Soler glaciers (Figure 4b), sporadically represented by brittle faults observed at outcrop scale. Unfortunately, well-exposed fault planes and slickensides with clear kinematic indicators are rare. Nonetheless, mafic, pegmatitic, and aplitic dikes are displaced along the fault between the Soler and Nef glaciers and east of the Colonia glacier. The few observed submeter displace-ments record a right-lateral sense of motion along steep (60 to 90° dipping) faults striking between N10W and N10E with subhorizontal lineations (inset in Figure 3b; see Data Set S2 and Figure S1 in the supporting information). North of the Soler glacier, the Cachet Fault loses continuity. Based on satellite imagery, we infer that it transitions into several NNW-SSE striking, right-stepping en échelon faults that merge into the Exploradores Fault Zone farther north (Figure 3a).
The Cachet Fault crosscuts the three main eastward draining glacial outlet streams—the Nef, Colonia, and Pared Norte glaciers (Figure 4a). A pronounced dextral deflection of the main glacial valleys and glaciers occurs at the fault crossing. Furthermore, three smaller glaciers and glacial cirques west of the fault can be consistently correlated with beheaded valleys east of the fault (red lines in Figure 4b), confirming the dextral offset pattern. The upper ends of the three eastward draining beheaded valleys east of the Cachet Fault are exposed along the three main glacier valleys (Figures 4a and 4b and Figure 5a). The truncated valleyfloors lie between 300 and 450 m above the main trunk valleys. They form narrow (<1 km wide), headward open cir-ques containing small lakes. The most conspicuous case of valley beheading occurs wherefluvial or glacial valleys have been completely truncated by faults and disconnected from upstream areas [Brocard et al., 2011;
Figure 4. Cachet Fault (a) satellite image (ASTER imagery, U.S. Geological Survey) of the easternflank of the Northern Patagonian Icefield spanning the Cachet Fault (CF). Note the pronounced right-lateral deflection of the Nef, Colonia, and Pared Norte outlet glaciers at their intersection with the Cachet Fault. (b) Topography (SRTM-1 30 m) and fault structures (white lines) related to the Cachet Fault. The red lines indicate beheaded valleys along the main fault trace. Note that all three beheaded valleys drain toward the east. Inset shows stereoplot of fault planes an lineations along main fault trace. The white dashed arrow lines indicate the correlation of displaced glacial and beheaded valleys across the fault trace. The colored circles correspond to pinpoints (three per displaces valley) used for displacement estimates and calculation of error bars in Figure 4c. See text for explanation. (c) Displacement-distance plot along the Cachet Fault. The symbols are color-coded according to Figure 4b.
Simon et al., 2013]. Beheading by lateral erosion of the trunk glacier is possible [Bishop, 1995], but in this case unli-kely, given the consistency of truncation and the correlation with valleys west of the main fault. Beheading by strike-slip faults occurs where the rate of horizontal displacement is significantly larger than the rate of lateral migration of the river or glacier crossing the fault [e.g., Sieh and Jahns, 1984; Lindvall et al., 1989; Simon et al., 2013]. The smaller glaciers were probably not able to keep pace with rates of horizontal offset and lost continuity with their lower valley sectors, which were then disconnected from the corresponding accumulation areas. To provide afirst-order approximation for the amount of dextral slip along the Cachet Fault, we selected three pinpoints (two ridgelines and the valley bottom) for each displaced valley on either side of the fault trace (Figure 4b) and measured their displacements across the fault. The variability within each set of six pinpoints (representing 1 displaced valley) is recorded in the error bars for each measured offset. The Pared Norte and Pared Sur glaciers (southernmost site along the Cachet Fault) appear to have flowed together into the wider corresponding valley on the eastern side of the Cachet Fault. In this case, we tested for the maximum and minimum offsets by independently correlating these two glacial valleys from the
Figure 5. (a) Field view of the deflected Nef glacier and the northernmost beheaded glacial valley along the trace of the Cachet Fault. The white stippled line indicates the ridgeline along the truncated valley head. Note the low-elevation cor-ridor toward the south in the continuation of the Cachet Fault. (b) View of the northernflank of the Northern Patagonian Icefield where summit elevations and relief abruptly increase from the bottom of the Exploradores Valley to the top of Mount San Valentin. (c and d) Steep reverse, top to NNW fault structures along the Exploradores Valley.
western fault block with the trunk valley east of the fault (see Table S1 in the supporting information). For the present discussion we prefer a more conservative approach and favor the lower estimate in order to avoid an over-interpretation of the offset trend.
The displacement along the Cachet Fault varies between 3 and 10 km. It appears to decrease northward along the main fault strand between the Pared Sur and Soler glaciers (Figure 4c), although this pattern is ambiguous because of the large uncertainties of the method. To the north, the Cachet Fault changes to discontinuous, NNW-SSE striking faults with a right-stepping en échelon geometry, whereas south of the Pared Sur glacier, it appears to die out abruptly close to the intersection with El Salton normal fault (Figure 3a and section 4.3).
4.2. Exploradores Fault Zone
The Exploradores Fault Zone spans the northern foothills of the NPI (Figures 3 and 6) and consists of N120E-striking, moderate–to-steeply southwestward dipping (50–80°) reverse faults with a minor strike-slip
Figure 6. (a) Exploradores Fault Zone Satellite image (Landsat, data available from the U.S. Geological Survey) of the NW-SE oriented Exploradores Valley spanning the northern foothills of the NPI. Note the sharp NW-SE striking landscape linea-ments parallel to the mapped fault structures in Figure 6b. (b) Topography (SRTM-1 30 m) and main fault structures (white lines) along the Exploradores Valley. Note sharp turns in the course of the upper Exploradores Valley coinciding with fault structures related to the Exploradores Fault Zone. Stereoplots summarize structural measurements (fault planes and striations with shear sense where measured) from outcrops (white circles on map) in the NW (plot 1) and SE (plot 2) part of the valley. The red and blue fault planes highlight orientation of structures related to the Exploradores Fault Zone (EF) and LOFZ, respectively. The black great circles in the lower stereoplot correspond to likely older fault planes with differing orientation originating from the metamorphic basement (cf. Figure 3b).
component. It coincides with the course of the Exploradores Valley, which marks the almost 4 km drop in relief at the northernflank of the NPI (Figures 2b and 5b). The valley traverses the orogen obliquely at low elevations (<350 m) between Lake General Carreras in the east and the Pacific fjords in the west (Figure 6a).
In the southeastern Exploradores Valley, metamorphic basement of siliciclastic metasediments with abundant intercalations of marble is exposed [Herve et al., 1999], which constitutes the host rock for the Patagonian Batholith (Figure 3b). Passing the transition into the granitoids toward the northwest, the valley narrows and slopes become steeper; metamorphic basement is exposed only at the summit of Mount San Valentin and its northern face. In this part of the valley, the general NW-SE oriented course of Rio Exploradores is interrupted by several sharp turns (Figure 6b), which are associated with pronounced N120E-striking lineaments that intersect the valley at a high angle, suggesting a possible structural control on the river course. In thefield, these lineaments coincide with 10 to 15 m wide fault zones characterized by closely spaced brittle faults (Figures 5c and 5d) The fault planes dip steeply toward the SW (fault plane 237/76, dip direction/dip), and the SE plunging lineations indicate oblique reverse faulting with a minor lateral component (lineation 154/35, dip direction/plunge; Figure 5d). Along the Exploradores Valley, numerous road cuts expose similar faults.
The structural data from the Exploradores Valley are presented in two groups corresponding to outcrops from the northwestern and southeastern parts of the valley (Figure 6b, side panel). Outcrops are scarce and difficult to access, which limited the number of structural measurements collected, thus precluding a more quantitative interpretation of the data. The northwestern data set (upper stereoplot in Figure 6b) reveals two main preferred orientations: A NW-SE striking set of fault planes moderately to steeply dips to the SW (N30W, 60–80°) and is parallel to the strike of the Exploradores Valley, with N90W–N140W plunging lineations consistently showing reverse shear sense. Another NNE-SSW striking set of fault planes dips steeply or vertical (N20E–N40E, 60–80°) with a similar orientation with respect to the LOFZ. The structural data from this part of the valley likely reflect an interference pattern resulting at the intersection of the Exploradores Fault Zone with the eastern strands of the LOFZ (Figures 6b and 3a). The few measurements from the south-eastern part of the valley (lower stereoplot in Figure 6b) still reflect the NW-SE orientation of the Exploradores Fault Zone, although the overall pattern is less systematic. The geometry of macroscale and mesoscale struc-tures and the analysis of fault-kinematic indicators suggest oblique reverse faulting along the Exploradores Fault Zone.
4.3. El Salton Fault
Recent extensional deformation was observed at the El Salton Fault located in the southeastern foothills of the NPI near the southern termination of the Cachet Fault (Figure 3a). The NW-SE striking El Salton Fault is oriented at a high angle to the Rio Baker, whichflows along the eastern flank of the icefield, draining the east-wardflowing glacial outlets and Lake General Carreras into the Pacific Ocean. Near the southern termination of the Cachet Fault, Rio Baker follows a pronounced gorge with steep walls bounding afloodplain up to 1 km wide (Figure 7). The area locally known as“El Salton” (“the Big Jump” in Spanish) is characterized by an abrupt, 600 m long narrow segment of Rio Baker (down to only 20 m width) associated with a 15 m high abrupt drop in elevation forming a distinct knickpoint (Figure 7a). Based on published maps andfield observations, we found no evidence for a more resistant lithology that might control the location of the knickpoint. The pro-nounced knickpoint and channel narrowing at El Salton are unique along the entire course of the Rio Baker, which is otherwise characterized by a wide, gently meandering channel. The Rio Baker valley has been free of ice since at least 13 kyr [Turner et al., 2005]. Subsequentfluvial erosion appears to have obliterated subgla-cially formed knickpoints, which could be potentially mistaken for those associated with active faulting. Immediately adjacent to the El Salton knickpoint, two 3 km long, N120E oriented and SW facing scarps are found northwest of Rio Baker, forming a staircase morphology clearly visible on a DEM generated from 1 m topographic contours (surveyed by a local mapping agency) (Figure 7b). The scarps cross the river and farther to the southeast bend toward a more westerly direction (N90E–N100E), where they lose continuity and geomorphic expression as the valley walls become steeper. Field observations confirmed that the scarps are related to N120E–N90E striking and SSW dipping faults with moderate-to-steep (50–80°) SSW plunging lineations and kinematic indicators of dip-slip, normal displacement (Figure 7b, inset). Rio Baker is the river with the highest discharge in Chile [Escobar, 1992], and thus knickpoints that are not associated with active faults would be expected to retreat rapidly as a result of rigorousfluvial erosion. The persistence of a
pronounced river knickpoint in this major glacial valley coincident with the sharp disruption of the smooth glacial landforms by the faults suggests active deformation by extensional processes. Given that the Rio Baker valley has been ice-free since at least 13 kyr [Turner et al., 2005] and assuming that tectonic offset pre-dating this time was somehow balanced by glacial erosion, this interpretation implies a maximum vertical fault slip rate of 1.2 mm/yr since 13 kyr to produce the observed 15 m of vertical offset.
5. Results From Apatite (U-Th)/He Thermochronometry
We sampled bedrock for apatite (U-Th)/He (AHe) thermochronology with two main objectives: (1) to decipher late Cenozoic apparent exhumation rates from age-elevation relationships (AERs) of bedrock samples, which represent thefirst elevation transects documenting cooling histories from the glaciated region of the oro-gen’s interior south of the CTJ, and (2) to detect differences in the level of exhumation between the two main sampling regions (Nef and Leones catchments), which could constrain relative deformation as well as the timing and magnitude of movement along the Exploradores Fault Zone.
We obtained AHe cooling ages from 30 bedrock samples (Figure 8a). All samples are from Late Jurassic to Cretaceous granites and granodiorites of the Patagonian Batholith. Twenty three of the dated samples were taken along two elevation transects in the Leones and Nef glacial catchments, which lie 30 km apart at the easternflank of the NPI (Figures 8a and 8b). Of the remaining samples, one originates from the lower parts of the Leones valley (~200 m above sea level (asl)), one from the valley bottom of the Exploradores Valley
Figure 7. El Salton Fault. (a) High-resolution topography (based on 1-m contour lines) of the El Salton region along the Rio Baker at the southeastern tip of the Northern Patagonian Icefield (cf. Figure 3a). Note the river knickpoint associated with the location of the El Salton Fault. (b) Hill-shaded relief of the El Salton region. White arrows indicate the trace of pronounces landscape scarps likely associated with fault structures. Inset in the upper right corner shows measured fault planes (n = 34, black lines) and lineations (n = 15) with shear sense indicators (red arrows). The stereoplot is a composite projection of measurements collected at outcrops indicated by red circles. (c) Field view of the Baker River at the exit from the narrow channel known as El Salton. Note the exposed fault planes aligning with the knickpoint of the river in the lower part of the channel. More degraded landscape escarpments toward the north form staircase morphology and correspond to the clear lineaments visible in the hill-shade topography in Figure 7b.
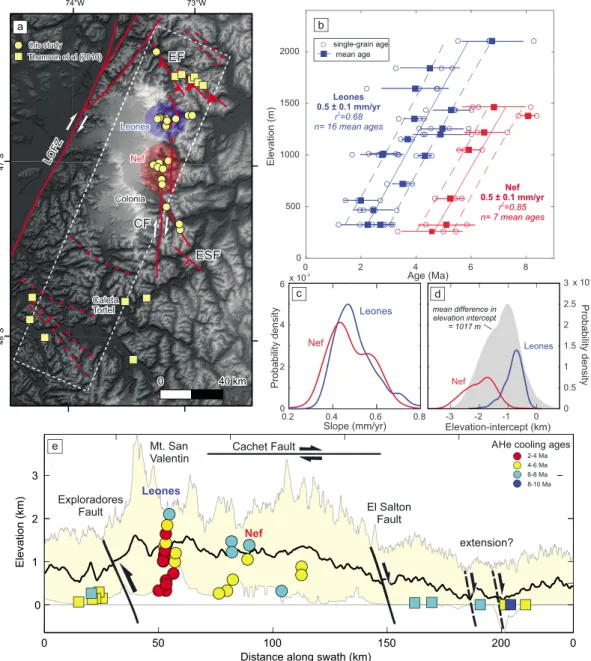
Figure 8. (a) Topography (SRTM-1 30 m) of the Northern Patagonian Icefield region with main fault structures and location of bedrock samples used for apatite (U-Th)/He (AHe) dating. The circles are samples presented in this study; the squares corre-spond to AHe data from Thomson et al. [2010]. The dashed white rectangle indicates area for swath profile in Figure 8e. EF/CF/ ESF: Exploradores/Cachet/El Salton faults. (b) Age-elevation relationships with single (hollow circles) and mean (filled circles) ages from the Nef (red) and Leones (blue) catchments. The dashed lines indicate the 1σ confidence interval for the linear regression of mean ages. Note (c) the equal slope and (d) the difference in zero-age elevation intercept between both AERs of about 1 km as inferred from the mean of the difference in probability density functions of the intercepts obtained from a bootstrap analysis of the linear regressions. (e) AHe data color-coded by mean ages and projected with sample elevation along the swath profile from the area indicated in Figure 8a. The black lines indicate the approximate location of the Exploradores and Cachet faults at theflanks of the NPI, as well as possible extension in the Tortel fjord region. Vertical exaggeration factor ~ 15.
(35 m asl), and three other samples come from the Colonia valley, east of the Cachet Fault at elevations between 300 and 880 m. Two dated samples were excluded from the AER-regressions due to high age dispersion in the single aliquots that lack correlation with variations in U-content or grain size (Data Set 1). The Leones profile in the north encompasses 16 samples between 300 and 2100 m asl over a horizontal distance of 18 km, reaching the accumulation zone of the Leones Glacier above the ice plateau. The Nef pro-file in the south encompasses seven samples between 230 and 1450 m over a horizontal distance of 13 km in the upper catchment of the Nef Glacier, also slightly exceeding the local level of the ice plateau. The quality of the obtained apatite grains is mostly very good, but it decreases with elevation in both profiles. It was not possible to obtain good-quality apatites from samples collected at more than 300 m above the local level of the ice plateau. Also, dispersion in single-grain ages within individual samples increases with elevation, which is reflected in the larger age uncertainties for the highest samples. Mean ages were calculated for three tofive single-grain aliquots per sample.
Mean ages range from 4.6 ± 1.1 Ma to 8.1 ± 0.3 Ma for the Nef profile and from 2 ± 0.5 Ma to 6.8 ± 1.1 Ma for the Leones profile (Figure 8b). The three samples from the Colonia Valley yield mean ages between 5.3 ± 0.4 and 6.6 ± 0.9 Ma, and sample VG12-EX11 from the Exploradores Valley has a mean age of 4.2 ± 0.4.
6. Interpretation of Apatite (U-Th)/He Data
The AHe cooling ages are positively correlated with elevation in both the Leones and Nef elevation transects (Figure 8b). Sample LE08-02 (4.3 ± 0.7 Ma, not shown in Figure 8b) from the lower Leones Valley has not been included in the age-elevation regression analysis because it is located 10 km downstream from the steep elevation transect (Figure 8a). This sample shows an incipient trend toward older ages downstream, although there are not enough data to confirm this. Similarly, a low-elevation sample from the downstream Nef region yields relatively older ages (AG08-08, not shown in Figure 8b); this sample was not included in the regression ana-lysis due to a large spread of single-grain ages (between 8 and 19 Ma; see Data Set 1). The samples from the Nef region were collected across the northern tip of the Cachet Fault. Samples from similar elevations on either side of the fault yield similar ages, indicating that there is no significant vertical offset, at least within the resolution of the data. This result is in line with ourfield-based interpretation of dominant lateral movement along the Cachet Fault. The slope calculated from a linear regression of mean ages (bootstrap analysis with 1000 samples) averages 0.5 ± 0.1 mm/yr in both Nef (r2= 0.85) and Leones (r2= 0.68) age-elevation relationships (AERs) (Figures 8b and 8c). There is no evident break in slope in the AERs, suggesting uniform apparent exhumation rates between ~6 and 2 Ma for the Leones catchment and between ~8 and 4 Ma for the Nef catchment.
A notable feature in the AER plot is the prominent offset in cooling ages between the two regression lines (Figure 8b). Both single-grain and mean ages from the Leones catchment (blue symbols in Figure 8b) are con-sistently younger than the cooling ages of corresponding samples at similar elevations from the Nef catch-ment (red symbols in Figure 8b). The offset between the two AERs averages 2 Ma and is distinct at the 1σ confidence level (dashed blue and red lines in Figure 8b). The observed offset between the two regression lines is equivalent to a vertical offset of about 1 km, as can be inferred from the mean difference in the zero-age intercepts of the linear regressions (bootstrap analysis with 1000 iterations) (Figure 8d).
The observed offset between the AERs could result from a differing depth of the AHe closure isotherm below both regions. In this case, because there is no prominent break-in-slope in the AERs, the difference in iso-therm depth must have been established and stayed stable since at least 6–8 Ma, which is the time when the highest (oldest) samples from both AERs crossed the AHe closure isotherm. If the closure isotherm were shallower in the north (Leones catchment), the exhumation paths above it would be consistently shorter and the samples would yield younger cooling ages. In this case, assuming a background exhumation rate of 0.5 mm/yr (Figures 8b and 8c), approximately 1 km of deflection of the closure isotherm would be required to explain the 2 Ma age difference between the two catchments. Localized warping of shallow isotherms could result from the existence of a long-lived fault between the elevation transects [e.g., Ehlers and Farley, 2003]; however, there is nofield evidence for any active or inherited faults between them. Alternatively, spatial differences in the thermal structure of the crust could arise in slab window environments [Thorkelson, 1996; Groome and Thorkelson, 2009]. A northward migration of crustal heating related to slab-window opening has been proposed for this region based on cooling ages from the eastern foreland
[Guillaume et al., 2013]. This heating wave was detected over large distances (~250 km) and proposed at 15 Ma for the latitudes of Leones and Nef regions (47°S) and at 5 Ma for the Coyhaique region ~200 km to the north (45.5°S). Given the short distance between the Leones and Nef regions (~30 km) rela-tive to the spatial extent of the slab win-dow (several hundreds of km), it is likely that both regions would be equally and nearly synchronously affected by crus-tal thermal perturbations, likely well before the samples from both AERs crossed the closure isotherm. Moreover, the thermal impact of the migrating slab window is a dynamic signal [Groome and Thorkelson, 2009; Guillaume et al., 2010], which is unlikely to have remained stable for 6 to 8 Myr. Based on these arguments, we conclude that a differing depth of the closure isotherm is not a likely scenario. Alternatively, if the closure isotherm beneath both regions were located at a similar depth (Figure 9), systematically younger ages from the Leones region in the north would reflect deeper levels of exhumation. Because both AERs have the same slope within error, we assume similar exhumation rates for the time frame constrained by AHe cooling ages—between ~8 and 4 Ma in the Nef region and between ~6 and 2 Ma in the Leones region. Hence, the differential pulse of exhumation responsible for the 2 Ma offset in cool-ing ages between samples from similar elevations, which corresponds to ~1 km of differential exhumation, must have occurred after closure of the AHe system for the youngest (lowest elevation) samples, i.e., 2–3 Ma (Figure 8b). A process inducing differen-tial rock uplift is necessary, because deeper erosion alone (Figure 9a) could not account for the consistent offset in cooling ages between the AERs at similar elevations. Differential uplift could result from (1) an iso-static response to differential erosion (with more effective erosion in the Leones region compared to the Nef region; Figure 9b), (2) differential (e.g., tectonic) rock uplift (with a higher magnitude of tectonic uplift in the Leones region; Figure 9c), or (3) a combination of both.
Assuming a range of geothermal gradients between 35 and 45°C/km, the calculated apparent exhumation rate of 0.5 mm/yr yields a cooling rate of 17–22°C/Ma. For such relatively fast cooling rates, together with the rela-tively young AHe bedrock cooling ages, we can assume that the effect of radiation damage on He diffusion (i.e., on closure temperature) [Flowers et al., 2009; Gautheron et al., 2009] is negligible and that the commonly used closure temperature for He diffusion in apatite of ~70°C is a reasonable assumption [Shuster et al., 2006]. A range of geothermal gradients between 35 and 45°C/km results in an expected closure depth between 2 and 1.5 km. We explored probable erosion rates and depths to the closure-temperature environment using Willett and Brandon [2013]’s MATLAB script AGE2EDOT, which provides a steady state solution of 1D erosion rates from
Figure 9. Schematic representation of different scenarios for landscape evolution and sample history with corresponding plots of age versus ele-vation for Nef (red symbols) and Leones (blue symbols) regions. The samples at 300 m elevation with AHe cooling ages of 2 Ma (Leones) and 4 Ma (Nef) represent a reference level from the original data set. The red stippled and continuous lines sketch AHe closure isotherm before and after incision, respectively. (a) Deeper incision in the Leones region after 2 Ma without differential isostatic response to erosion. (b) Deeper incision in the Leones region and differential isostatic response after 2 Ma with higher magnitude in Leones. (c) Similar incision in both regions with superposed differential tectonic uplift after 2 Ma with higher magnitude in Leones (located closer to the fault). This scenario represents best the observed topography (similar catchment morphology) and thermochro-nological data (AERs; see Figure 8b).
a single thermochronometric age [Willett and Brandon, 2013]. Assuming typical thermal properties of the crust and a modern geothermal gradient between 35 and 45°C/km, the youngest apatites from the Leones region (~2 Ma at an elevation of ~ 300 m) require exhumation rates between 0.6 and 0.9 mm/yr, equivalent to 1.2 to 1.8 km of eroded material since 2 Ma. For the Nef region, the same calculation for the youngest sam-ples (~4 Ma at an elevation of ~ 300 m) results in exhumation rates between 0.2 and 0.4 mm/yr, equivalent to 0.8 to 1.6 km of eroded material since 4 Ma (see Figure S2 and Table S2 and AGE2EDOT script in the support-ing information). Compared to the exhumation rates between 6 and 2 Ma for the Leones region (0.5 mm/yr), the above calculation implies an increase in exhumation rate of between 0.1 and 0.4 mm/yr averaged over the last 2 Ma. For the Nef region, no increase in exhumation rate after 4 Ma can be detected. Given that the extent of Plio-to-Pleistocene glaciations in Patagonia was similar to previous advances [Mercer and Sutter, 1982; Singer et al., 2004; Lagabrielle et al., 2010], and that glacial erosion was likely a major controlling factor of regional exhumation during this time period, we consider a decrease in exhumation rate down to 0.2 mm/yr after 4 Ma unlikely (lower estimate in the Nef region based on higher geothermal gradient). Therefore, we rather favor the assumption of a lower geothermal gradient around 35°C/km and the higher estimates for exhumation rates after 2 and 4 Ma in the Leones and Nef regions, respectively.
Thefirst possibility for differential uplift (differential erosion) requires a higher magnitude of erosional exhumation in the Leones region compared to the Nef region since 2 Ma (youngest/lowest elevation samples; Figure 8b). The Patagonian Andes have been glaciated since 5–7 Ma [Mercer and Sutter, 1982; Lagabrielle et al., 2010] and were repeatedly subjected to extensive glacial advances during glacial maxima [Singer et al., 2004; Kaplan et al., 2009]. Moreover, glaciation intensified during the Quaternary [Haug et al., 1999; Ravelo et al., 2004; Clark et al., 2006], which may have impacted erosion, as inferred from several thermochronometric studies elsewhere, such as in British Columbia [Shuster et al., 2005; Ehlers et al., 2006] and the European Alps [Valla et al., 2011; Herman et al., 2013]. More intense regional glacial erosion might have contributed to the accelerated exhumation after 2 Ma (steepening of both AERs), but erosional exhumation must have been more efficient in the Leones relative to the Nef region to explain the observed shift in ages between the sample transects.
Ice dynamics comprise nonlinear processes [Cuffey and Paterson, 2010; Herman et al., 2015], and glacial ero-sion is proportional to ice sliding velocity [Hallet, 1979; Humphrey and Raymond, 1994; MacGregor et al., 2009; Iverson, 2012] or iceflux [Anderson et al., 2006]. Erosional processes are therefore very sensitive to changes in topography or ice accumulation. It is questionable whether the analysis of modern catchment hypsometries and glacial characteristics is representative of the erosional potential averaged over several million years, but they could be used to providefirst-order assessments of major differences in glacial erosion efficiency [Brocklehurst and Whipple, 2004; Anderson et al., 2006; Sternai et al., 2011; Yanites and Ehlers, 2012].
The neighboring Leones and Nef catchments host two of the principal eastward draining glacial outlets of the NPI, the Leones, and Nef glaciers. Both glacial catchments are located on the sameflank of the icefield and therefore have been exposed to analogous climatic conditions affecting the dynamics and thermal state of the ice, which are in turn linked to erosion [Hallet, 1979; MacGregor et al., 2009; Iverson, 2012]. Both catch-ments have very similar topographic characteristics as indicated by hypsometric integrals (0.463 for Nef, 0.387 for Leones) and catchment-surface areas (230 km2for Nef, 208 km2 for Leones; see Figure S3). The ice-surface and ice-accumulation areas of the Nef glacier are 126 km2and 79 km2, respectively, and are nearly twice the corresponding areas in the Leones catchment (66 km2and 47 km2). Both catchments feature similar overdeepenings of the valleys close to the glacier termini, reaching sea level and below. In the Leones region, where glacier retreat has been more significant, the overdeepened sector is occupied by a proglacial lake (Lake Leones). In the Nef region, the overdeepened section is still covered by ice, but has been inferred from a ground-penetrating airborne radar system [Centro de Estudios Cientificos, 2012; Rivera et al., 2014]. In sum-mary, neither catchment nor glacial characteristics in these regions support more efficient erosional exhuma-tion in the Leones catchment compared to the Nef catchment. Hence, differential glacial erosion and isostatic rebound cannot be responsible for the ~1 km greater rock uplift in Leones since 2–3 Ma compared to Nef. We argue here that another process must have not only created the observed difference in uplift/exhumation but also compensated for potentially greater glacial erosion and isostatic rebound in the Nef catchment. A second hypothesis for differential exhumation invokes a superimposed pulse of tectonic rock uplift that affected the Leones region, but not (or less so) the Nef region (Figure 9c). Again, such a pulse must have occurred after 2–3 Ma, uplifting the samples from the Leones AER after all samples had already crossed the
AHe closure isotherm. The southernmost strands of the N120E striking Exploradores Fault Zone are located approximately 30 and 60 km north of the Leones and Nef catchments, respectively (Figure 8a). These are stee-ply dipping reverse faults that may represent inherited, steestee-ply dipping basement structures, linked to the long-term structural evolution of the margin and likely reaching deeper crustal levels. Reactivation of these structures in recent times could account for a gradual increase of rock uplift and exhumation in the hanging wall approaching the faults, and therefore be responsible for deeper levels of exhumation in the Leones catchment. We therefore favor the interpretation of the shift in cooling ages between the AERs resulting from an increasing depth of exhumation related to differential tectonic rock uplift along the Exploradores Fault Zone (Figure 9c). The absolute magnitude of the increase in exhumation rate (0.1–0.4 mm/yr for Leones; Figure S2) likely reflects the combined effects of locally superimposed tectonic uplift along the Exploradores Fault Zone and of possibly more intense glacial erosion over the Quaternary. However, because there is no detectable increase in exhumation rates for the Nef catchment during the Quaternary, the effect of Quaternary glaciations on exhumation patterns is probably similar to that of earlier glaciations. Based on the previous arguments, we conclude that 2–3 Ma (youngest samples in Leones) is the maximum timing for the onset of motion along the Exploradores Fault Zone.
7. Discussion
7.1. The Controversy on Patagonian Topography
Several hypotheses have been put forward to explain the abrupt rise in summit elevations and relief from the Northern to the Southern Patagonian Andes at ~46°S [Ramos and Kay, 1992; Ramos, 2005; Lagabrielle et al., 2007; Thomson et al., 2010; Guillaume et al., 2010; Guillaume et al., 2013]. Thomson et al. [2010] explained the higher elevations in Southern Patagonia with afirst-order influence of climatically controlled processes on inter-nal dynamics of mountain building [Whipple and Meade, 2006; Tomkin and Roe, 2007]. In their interpretation, less erosive glaciers associated with the cooler climate of the Southern Patagonian Andes were inferred to have armored the mountains, inhibited erosion, and ultimately promoted topographic growth. The authors based their conclusion on an extensive low-temperature thermochronometry data set (AHe and apatitefission track). However, their observed trends toward older ages to the south are likely an artifact of spatially biased sampling [Thomson et al., 2010, their Figure 1]. For example, younger cooling ages from the Northern Patagonian Andes (north of the CTJ) are from the intra-arc region of the orogen and mainly along the active transpressive LOFZ [Cembrano et al., 1996; Thomson, 2002; Adriasola et al., 2006; Rosenau et al., 2006; Lange et al., 2008], where active faulting is responsible for rock uplift and faster exhumation rates, resulting in younger cooling ages [Thomson, 2002; Adriasola et al., 2006]. South of the CTJ, older cooling ages from their data set correspond mainly to samples located along the shoulders of deep glacial fjords in the fore-arc, where regional exhumation is less pronounced due to very localized erosion along distal glacial outlets. We therefore suggest that certain aspects of the model of Thomson et al. [2010] need to be reconsidered to reconcile their interpretation with our new data.
The thermochronological data set presented here reveals the exhumation history of the glaciated interior of the Southern Patagonian Andes, south of the CTJ. The well-constrained AERs from the Leones and Nef glacial catchments record moderate background exhumation rates of ~0.5 mm/yr between 8 and 2 Ma, likely re flect-ing the pace of glacial erosion over this time period. Guillaume et al. [2013] reported a similar range of AHe data from a comparable elevation transect located ~80 km southeast of our study area. Likewise, Fosdick et al. [2013] reported AHe data from the proximate retroarc region at ~51°S documenting similarly young ages (<10 Ma, and mostly between 6 and 4 Ma), which they interpreted to indicate significant late Miocene and Pliocene denudation byfluvioglacial erosion.
Notably, the data sets of Guillaume et al. [2013] and Fosdick et al. [2013] are rather similar to the Nef AER; i.e., they are ~2 Ma older at equivalent elevations compared to the Leones AER. Hence, these data and the Nef AER likely reflect the regional exhumational patterns governed by glacio-fluvial erosional exhumation, whereas the Leones AER reflects the same regional erosion signal and an additional locally superimposed effect, which we relate to tectonic uplift after 2–3 Ma. The Nef region might have been tectonically uplifted as well, but by a magnitude that is below the resolution of our data.
All together, the range of AHe ages matches cooling ages and predicted exhumation rates from the interior of the Northern Patagonian Andes (north of the CTJ), where Thomson et al. [2010] argued for efficient glacial ero-sion (see Figures 3 and 4 in Thomson et al. [2010]). Notably, the magnitude of glacial eroero-sion, as estimated from
AERs of AHe and apatitefission track data in Thomson et al. [2010]’s study, might be somewhat overestimated, considering that many of the<2-Ma AHe and <5-Ma AFT cooling ages north of the CTJ originate from the immediate vicinity of the active transpressive LOFZ [Thomson, 2002; Adriasola et al., 2006; Thomson et al., 2010]. Taken together, our results combined with the data from Guillaume et al. [2013], Fosdick et al. [2013], and Thomson et al. [2010] are incompatible with the hypothesis of Thomson et al. [2010] and show instead that high elevations south of the CTJ are not associated with inhibited glacial erosion.
The spatial coincidence of the CTJ with the increase in summit elevations and relief suggests potential feed-back between oceanic ridge collision, upper plate deformation, and relief evolution in Southern Patagonia. Modeling approaches combined with thermochronology data [Guillaume et al., 2010; Braun et al., 2013; Guillaume et al., 2013] have highlighted how mantleflow through the slab window and related dynamic topography may be linked to the cooling history and relief evolution in Southern Patagonia. Mantle convec-tion results in uplift or lowering of Earth’s crust, with an amplitude reaching a few hundred meters and wave-lengths exceeding 100 km [Hager et al., 1985; Mitrovica et al., 1989; Ricard et al., 1993; Braun, 2010; Braun et al., 2013; Faccenna et al., 2014]. In the Patagonian foreland, areally extensive and transient uplift is documented by uplifted Pleistocene marine terraces along the Atlantic coast reaching 180 m asl [Darwin, 1846; Pedoja et al., 2011] and tilted river terraces [Guillaume et al., 2009]. These effects have been inferred to reflect the dynamic response of the continental lithosphere to the opening of the slab window [Guillaume et al., 2009; Guillaume et al., 2010; Pedoja et al., 2011]. Furthermore, AHe and apatitefission track data east of the main divide spanning ~200 km along strike of the former fold-and-thrust belt have been inferred to show a north-ward trend tonorth-ward younger ages, probably reflecting a pulse of dynamic uplift, progressive heating, and/or erosional exhumation associated with slab window formation [Braun et al., 2013; Guillaume et al., 2013]. However, explaining all aspects of high topography in the Southern Patagonian Andes with deep, dynamic mechanisms is difficult. Although Guillaume et al. [2013] and Guillaume et al. [2010] proposed that the high summits of the Patagonian Andes could be explained with a transient and northward-migrating pulse of dynamic uplift, the modeled location of both the maximum dynamic uplift since 4 Ma and the cumulative dynamic uplift since 8 Ma is in the low-elevation fjords south of the NPI [Guillaume et al., 2013, their Figure 5]. Furthermore, the abrupt increase in relief and summit elevations at the northern edge of the NPI and the similarly sudden drop in topography south of it occur over distances that are too short to be explained by dynamic topography. In summary, while dynamic uplift likely played an important role in the long-wavelength topographic evolution of Southern Patagonia [Guillaume et al., 2009; Jeandet, 2014] and might have influenced the regional cooling signal in the eastern foreland [Braun et al., 2013; Guillaume et al., 2013], we emphasize the need for alternative mechanisms to explain the short-wavelength topographic variations, structural and geomorphic observations, and thermochronological data in the NPI region.
7.2. Neotectonics of the Northern Patagonian Icefield
The structural, geomorphic, and thermochronological data presented in this study document late Pliocene to Quaternary fault activity at the northern and easternflanks of the NPI. The geomorphic signature of displaced landforms along the dextral Cachet Fault suggests active lateral translation. Although the timing of the onset of motion along this structure is difficult to assess due to the lack of sedimentary deposits or unambiguous, datable markers, the displacement of previously carved large glacial landforms implies that accrued dextral offset began some time after the onset of glaciation in this region 5–7 Ma ago [Mercer and Sutter, 1982; Ton-That et al., 1999; Lagabrielle et al., 2010]. Recent studies from the foreland at these latitudes suggest the main incision and glacial overprint of the landscape occurred as recently as 3 Myr ago and was accompanied by the reactivation of tectonic structures and disruption of the foreland in the course of oceanic ridge collision and slab window opening [Lagabrielle et al., 2010; Scalabrino et al., 2011]. A time window around 3 Ma might fur-nish a maximum constraint for the onset of faulting along the Cachet Fault, although this is speculative. Considering the lateral offsets of glacial valleys between 3 and 10 km (section 4.1 and Figure 4), afirst-order estimate for a slip rate between 1 and 3 mm/yr may be inferred for the Cachet Fault.
The AHe data from the Leones and Nef regions presented here further support the onset of tectonic exhuma-tion along the Exploradores Fault Zone at around 2–3 Ma. We infer the anomalous course of the Exploradores Valley to be at least partly structurally controlled, crosscutting the entire Andean orogen at a high angle from the eastern foreland to the Pacific fjords (Figure 6). Faults with N120E strikes and steep dip angles are com-mon farther north along the trace of the LOFZ and have been mostly interpreted as inherited basement
structures that were reactivated and kinematically linked to the LOFZ during the Quaternary [Adriasola et al., 2006; Rosenau et al., 2006; Glodny et al., 2008; Lange et al., 2008; Melnick et al., 2009]. The Exploradores Fault Zone mimics this structural expression in the basement and likely represents an inherited set of structures that have been reactivated due to their favorable orientation in the course of strain partitioning and margin-parallel shortening triggered by closely spaced oblique ridge collision in this region.
The inferred neotectonic activity at the NPI is reflected in an along-strike projection of the entire data set of cooling ages from the Exploradores Valley in the north to the fjord region around Caleta Tortel to the south (Figure 8e). Over the 150 km long zone from Caleta Tortel toward the Exploradores Fault Zone, a northward trend of increasing elevations for samples with similar cooling ages can be observed. At Caleta Tortel, samples with 6–8 Ma AHe mean cooling ages are located at sea level, whereas in the Nef and Leones catchments, similar ages are characteristic for elevations around 1000 and 2000 m, respectively (Figure 8e). The Tortel region is located between the Northern and Southern Patagonian icefields and is characterized by numerous linked glacial fjords that traverse the orogen. During glacial maxima, this region was entirely covered by ice, whereas during interglacial periods, outlet glaciers from both icefields were restricted to valleys developing into future fjords [Hulton et al., 2002; Hubbard et al., 2005]. Although this region was extensively affected by glacial erosion, the shallow levels of exhumation reflected by AHe data (Figure 8e) argue against efficient erosional exhumation of the landscape being solely responsible for low elevations along the orogenic divide. Based on this argument and ourfield observations of recent normal faulting at El Salton, we speculate that extension across the Tortel fjord region contributed to the low relief, low elevations, and relatively older ages found along the southern foothills of the NPI. Farther north, when cross-ing the Exploradores Fault Zone from Leones in the south (hangcross-ing wall) to the bottom of the Exploradores valley in the north (footwall), the elevation of 4–6 (yellow symbols) and 6–8 Ma (cyan symbols) samples abruptly drops by nearly 2000 m. This pattern can be explained by north-vergent thrusting along the Exploradores Fault Zone.
Overall, we interpret the latitudinal AHe cooling-age pattern along the orogenic crest in the NPI region (Figure 8e) to reflect the regional erosional exhumation signal that is spatially disrupted by tectonically con-trolled differential rock uplift accommodated by the Exploradores and Cachet faults systems and possibly by extensional subsidence across the Tortel fjords in the south. Despite extensive glacial exhumation and mod-ification of the landscape reflected by AHe ages between 9 and 2 Ma (Figure 8e), superimposed differential tectonic uplift after 2–3 Ma appears to be largely responsible for relative elevation shifts across uplifting (Exploradores Fault Zone) or lowering (Tortel fjord region) crustal blocks.
The activity of the Cachet Fault and the Exploradores Fault Zone that we infer is further supported by the pat-terns of crustal microseismicity registered by a local seismic network installed between 44.6°S and 48.3°S between 2004 and 2005 [Miller et al., 2005; Agurto-Detzel et al., 2014] (Figure 10). The distribution of microseis-micity occurs in clusters, notably associated with the Hudson Volcano located ~80 km north of the NPI, the LOFZ, and the CTJ, and the clusters are mostly shallower than 10 km depth, where stick-slip fault behavior and intraplate seismicity might be expected. The cluster of events at the westernflank of the NPI in the area of San Quintin and San Rafael glaciers aligns well with the southern termination of the LOFZ. However, smaller clusters at the eastern and northern NPIflanks were not assigned a specific origin by these authors (Figure 10b). Agurto-Detzel et al. [2014] speculated that calving events and avalanches were possible seismo-genic sources for“glacial earthquakes” based on the coincidence of terminal zones of calving glaciers. We consider this explanation unlikely, mainly because (1) the interpretation was not supported by the necessary frequency analysis of the seismic waveforms, necessary to distinguish between tectonic and glacial sources [Ekström et al., 2003; Amundson et al., 2008; West et al., 2010]; (2) the seismic events in question occur mainly at depths between 2 and 10 km, which is not compatible with glacial triggers located at shallow depths; and (3) there are several other larger calving outlet glaciers at the NPI that do not exhibit such seismic activity. Instead, despite location uncertainties (Figure 10a), the seismic clusters in question coincide remarkably well with the tips of the Cachet Fault and the Exploradores Fault Zone and their intersection (Figure 10b) and therefore might support active faulting along the NPIflanks. Notably, these clusters represent chance find-ings, as the local seismic network was not initially designed to track the faulting along theflanks of the NPI. However, it is noteworthy that seismicity is fairly well resolved along known strands of the LOFZ, which are located even farther away from the seismic network. A more targeted positioning of seismic stations with such purpose would likely provide better constraints on fault geometries along the NPIflanks.
7.3. Tectonic Control on Topography Inland of the Chile Triple Junction
We argue that the inferred geometry, timing, and kinematics of deformation at the NPI can provide the link between processes related to oceanic ridge collision and changes of topography at the latitude of the CTJ. We interpret margin-parallel strike-slip deformation along the Cachet Fault at the easternflank of the ele-vated NPI to arise from closely spaced oblique collision of three segments of the Chile Rise at 6, 3, and 0.3 Ma between in the Golfo de Penas region (Figures 2 and 11). These collisions resulted in the decoupling of the NPI block from the Patagonian foreland along the LOFZ and the Cachet Fault, forming a crustal sliver. We suggest that northward translation of the NPI block results in (1) localized N-S shortening accommodated by reverse faults of the Exploradores Fault Zone system along its leading edge and possibly (2) coeval exten-sion accommodated by normal faults in the Tortel fjord region along its southern trailing edge (Figure 11b). This tectonic model not only reasonably explains local fault kinematics, deformed geomorphic features, and cooling patterns in the NPI region but also provides a straightforward link to the regional tectonic framework. Margin-parallel translation of crustal slivers along active subduction zones is characteristic of fore-arc defor-mation, reflecting strain partitioning due to oblique subduction [e.g., Witt et al., 2006; Melnick et al., 2006; Manaker et al., 2008; LaFemina et al., 2009; Michaud et al., 2009]. In Patagonia, oblique convergence since 20 Ma has induced strain partitioning, resulting in normal shortening in the fore-arc and margin-parallel dextral shear in the intra-arc region along the LOFZ, defining a typical transpressive environment [e.g., Cembrano and Hervé, 1993; Cembrano et al., 1996; Thomson, 2002; Adriasola et al., 2006; Rosenau et al., 2006; Lange et al., 2008; Hernandez Moreno et al., 2014]. Besides oblique subduction, collision of the Chile Rise with the margin since 10 Ma south from the Golfo de Penas region [Breitsprecher and Thorkelson, 2009] has been considered a major driving mechanism for the activity of the LOFZ, which decouples and accommodates northward motion of the Chiloé fore-arc sliver relative to the South American foreland
Figure 10. (a) Seismicity distribution in the vicinity of the Chile Triple Junction (CTJ) with data from the study by Agurto-Detzel et al. [2014]. The inverted white triangles indicate locations of seismic stations. The orange circles indicate loca-tions of seismic events. The ellipses in plan view and error bars in profiles correspond to 68% confidence of location uncertainties. The histogram shown in lower right corner indicates averaged values from the three semiaxes of the uncertainty ellipsoids. The red rectangle outlines area shown in Figure 10b. HV: Hudson Volcano, CBM: Cerro Bayo Mine, LOFZ: Liquine-Ofqui Fault Zone. (b) Distribution of background local seismicity at the Northern Patagonian Icefield [Agurto-Detzel et al., 2014]. The circles represent single seismic events color-coded by depth. Event magnitudes range between 0.5 and 2.8 for this region.