HAL Id: hal-00295689
https://hal.archives-ouvertes.fr/hal-00295689
Submitted on 11 Jul 2005
HAL is a multi-disciplinary open access
archive for the deposit and dissemination of
sci-entific research documents, whether they are
pub-lished or not. The documents may come from
teaching and research institutions in France or
abroad, or from public or private research centers.
L’archive ouverte pluridisciplinaire HAL, est
destinée au dépôt et à la diffusion de documents
scientifiques de niveau recherche, publiés ou non,
émanant des établissements d’enseignement et de
recherche français ou étrangers, des laboratoires
publics ou privés.
Analysis of the decrease in the tropical mean outgoing
shortwave radiation at the top of atmosphere for the
period 1984-2000
A. Fotiadi, N. Hatzianastassiou, C. Matsoukas, K. G. Pavlakis, E. Drakakis,
D. Hatzidimitriou, I. Vardavas
To cite this version:
A. Fotiadi, N. Hatzianastassiou, C. Matsoukas, K. G. Pavlakis, E. Drakakis, et al.. Analysis of the
decrease in the tropical mean outgoing shortwave radiation at the top of atmosphere for the period
1984-2000. Atmospheric Chemistry and Physics, European Geosciences Union, 2005, 5 (6),
pp.1721-1730. �hal-00295689�
Atmos. Chem. Phys., 5, 1721–1730, 2005 www.atmos-chem-phys.org/acp/5/1721/ SRef-ID: 1680-7324/acp/2005-5-1721 European Geosciences Union
Atmospheric
Chemistry
and Physics
Analysis of the decrease in the tropical mean outgoing shortwave
radiation at the top of atmosphere for the period 1984–2000
A. Fotiadi2, N. Hatzianastassiou1,2, C. Matsoukas2,3, K. G. Pavlakis2, E. Drakakis2,4, D. Hatzidimitriou2,3, and I. Vardavas2,3
1Laboratory of Meteorology, Department of Physics, University of Ioannina, Greece 2Foundation for Research and Technology-Hellas, Heraklion, Crete, Greece
3Department of Physics, University of Crete, Crete, Greece
4Department of Electrical Engineering, Technological Educational Institute of Crete, Greece
Received: 19 October 2004 – Published in Atmos. Chem. Phys. Discuss.: 31 January 2005 Revised: 21 April 2005 – Accepted: 2 June 2005 – Published: 11 July 2005
Abstract. A decadal-scale trend in the tropical radiative en-ergy budget has been observed recently by satellites, which however is not reproduced by climate models. In the present study, we have computed the outgoing shortwave radiation (OSR) at the top of atmosphere (TOA) at 2.5◦ longitude-latitude resolution and on a mean monthly basis for the 17-year period 1984–2000, by using a deterministic solar ra-diative transfer model and cloud climatological data from the International Satellite Cloud Climatology Project (IS-CCP) D2 database. Anomaly time series for the mean monthly pixel-level OSR fluxes, as well as for the key phys-ical parameters, were constructed. A significant decreas-ing trend in OSR anomalies, startdecreas-ing mainly from the late 1980s, was found in tropical and subtropical regions (30◦S– 30◦N), indicating a decadal increase in solar planetary heat-ing equal to 1.9±0.3 Wm−2/decade, reproducing well the features recorded by satellite observations, in contrast to cli-mate model results. This increase in solar planetary heating, however, is accompanied by a similar increase in planetary cooling, due to increased outgoing longwave radiation, so that there is no change in net radiation. The model com-puted OSR trend is in good agreement with the correspond-ing linear decadal decrease of 2.5±0.4 Wm−2/decade in trop-ical mean OSR anomalies derived from ERBE S-10N non-scanner data (edition 2). An attempt was made to identify the physical processes responsible for the decreasing trend in tropical mean OSR. A detailed correlation analysis us-ing pixel-level anomalies of model computed OSR flux and ISCCP cloud cover over the entire tropical and subtropical region (30◦S–30◦N), gave a correlation coefficient of 0.79, indicating that decreasing cloud cover is the main reason for the tropical OSR trend. According to the ISCCP-D2 data
Correspondence to: N. Hatzianastassiou
derived from the combined visible/infrared (VIS/IR) analy-sis, the tropical cloud cover has decreased by 6.6±0.2% per decade, in relative terms. A detailed analysis of the inter-annual and long-term variability of the various parameters determining the OSR at TOA, has shown that the most im-portant contribution to the observed OSR trend comes from a decrease in low-level cloud cover over the period 1984– 2000, followed by decreases in middle and high-level cloud cover. Note, however, that there still remain some uncertain-ties associated with the existence and magnitude of trends in ISCCP-D2 cloud amounts. Opposite but small trends are in-troduced by increases in cloud scattering optical depth of low and middle clouds.
1 Introduction
The climate of the Earth-atmosphere system is driven by the Earth’s radiation budget. Clouds interact with radiation play-ing thus a key role for the Earth’s radiation balance, and hence they strongly affect the Earth’s climate. However, cloud-radiation interactions currently introduce the largest uncertainty in climate variability and climatic change pre-diction through various feedback processes (IPCC, 2001).
In the last few years, there is increasing evidence of a large decadal trend in the top of atmosphere (TOA) tropical radia-tion budget, attributed to changes in cloud amount (Wielicki et al., 2002a,b; Allan and Slingo, 2002; Chen et al., 2002; Lin et al., 2004; Zhang et al., 2004). Wielicki et al. (2002a,b) analysed satellite broadband observations from the Earth Radiation Budget Satellite (ERBS), Wide Field of View (WFOV), Earth Radiation Budget Experiment (ERBE/ERBS scanner), Scanner for Radiation Budget (ScaRaB), Clouds and the Earth’s Radiation Energy System (CERES) of the
1722 A. Fotiadi et al.: Changes of tropical mean outgoing shortwave radiation
outgoing longwave (OLR) and shortwave radiation (OSR) at TOA over the 22-year period 1979–2001, and reported a sig-nificant decadal-scale variation of ∼3 Wm−2in the tropical OLR and OSR at TOA. They suggested that this variation is caused by changes in tropical cloudiness. Chen et al. (2002) using ISCCP data, also reported that there has been a cor-responding variation in total cloud amount in tropical and sub-tropical regions, over the same period, that might ex-plain the SW radiative flux anomalies. They provide evi-dence that these cloudiness changes are related to changes in vertical air-motion possibly associated with a strengthening of the tropical Hadley and Walker circulations. Jacobowitz et al. (2003) using the Advanced Very High Resolution Ra-diometer (AVHRR) Pathfinder Atmosphere (PATMOS) cli-mate data set, examined the time series of the OSR at TOA in the tropics (20◦S–20◦N), and found that tropical PATMOS
and ERBS OSR fluxes are in quite good agreement. How-ever, for the OLR at TOA they found no significant long-term trend in the corrected PATMOS data against the significant increasing trend found in ERBE OLR fluxes. Hatzidimitriou et al. (2004) performed an analysis on the tropical OLR at TOA and its causes. They have reported a decadal increase in OLR at TOA of 1.9±0.2 Wm−2, mainly attributed to a de-crease in high-level cloud cover over the period 1984–2000, followed by a drying of the upper troposphere and a de-crease in low-level cloudiness. Zhang et al. (2004) calculated time-series of monthly mean TOA SW and LW fluxes from ISCCP-FD data, confirming that there is a decadal variation in the tropical mean radiative energy budget. It is notewor-thy that climate models studied by Wielicki et al. (2002) and Allan and Slingo (2002), failed to reproduce this variation in the tropical energy budget, as measured by satellites, with the currently used climate forcings, due to either some additional external forcing or some internal physical processes which are not included in the climate models (Allan and Slingo, 2002). Most of the existing studies, however, give more em-phasis to the decadal trend in OLR rather than OSR flux at TOA, probably because it is generally more difficult to ob-tain correct SW than LW fluxes in climate models (Wielicki et al., 2002a, data supplement http://www.sciencemag.org/ cgi/content/full/295/5556/841/DC1). Besides, in most cases, the existing studies do not examine the causes of the decadal scale trends.
Recently Hatzianastassiou et al. (2004a), using a deter-ministic radiative transfer model along with ISCCP-D2 data, reported a decreasing trend in the OSR flux at TOA, of 2.3 Wm−2on a global scale, over the 14-year period 1984– 1997. This global OSR trend was ascribed to low latitudes, while clouds, as given by ISCCP, were identified as the most likely source. However, there is still some debate on whether the decreasing trend in cloud amount is physical or not. More detailed investigations are necessary. For example, the re-lationship between the OSR anomaly and the anomalies in cloud amount of different cloud types (e.g. low, mid and high-level) should be determined. Ellis et al. (2004)
em-ploying cloud amount data from the ISCCP-D2 and CLAUS (Hodges et al., 2000) dataset (which is, however, based upon ISCCP-B3) provided strong evidence that the cloud amount trend, especially in the tropics, is physical and robust, and that it is significantly correlated with various dynamical pa-rameters.
In this study, we extend the work by Hatzianastassiou et al. (2004a), by focusing on the tropical and subtropical re-gions (30◦S–30◦N). We attempt to analyse in detail trends in OSR flux by using model computations and satellite obser-vations, and to identify and quantify their probable causes, Thus we compute the tropical OSR flux at TOA over the ex-tended 17-year time period from 1984 to 2000 by using a de-terministic radiative transfer model, cloud data from ISCCP-D, and atmospheric and humidity data from NCEP/NCAR and ECMWF reanalysis projects. Anomaly time series of the OSR at TOA, as well as of the key input climatolog-ical data, averaged over tropclimatolog-ical and subtropclimatolog-ical regions (30◦S–30◦N), were constructed to investigate any existing
trend. The model OSR anomalies have been compared with those obtained from the Earth Radiation Budget Experiment (ERBE, Barkstrom et al., 1989) ERBS S-10N (WFOV NF edition 2) non-scanner data. Our model results show that, contrary to climate models, the deterministic radiative trans-fer model can reproduce well the long-term variability in the tropical SW radiation budget at TOA. The sources of this long-term OSR trend were further investigated, and the ef-fect of any long-term changes detected in the time series of the model input data, to changes in the OSR at TOA, was examined.
2 Model and input data
The radiative transfer model used to compute the TOA OSR fluxes, is described in detail by Hatzianastassiou et al. (2004a), Hatzianastassiou and Vardavas (1999, 2001) and Vardavas and Koutoulaki (1995). The model takes into ac-count the presence of ozone (O3), water vapour (H2O),
car-bon dioxide (CO2), aerosol particles, Rayleigh scattering,
surface reflection, and clouds (low, middle, high). Cloud climatological data such as cloud cover and cloud optical thickness are taken from the ISCCP-D2 dataset (Rossow et al., 1996; Rossow and Schiffer, 1999) and they are treated as in Hatzianastassiou et al. (2004a). It should be noted that we have used in this study the ISCCP-D2 individual cloud data derived from the visible/infrared (VIS/IR) analy-sis rather than the low-, mid- and high-level cloud data (as classified according to the ISCCP scheme), also provided by ISCCP-D2 and derived using the IR-only analysis. This is done because the combined VIS/IR analysis is of better quality than the IR-only one during daytime (Rossow et al., 1996), and thus the VIS/IR cloud products are more appro-priate for SW radiation budget studies. Moreover, the VIS/IR (individual) cloud data were found to dramatically improve
A. Fotiadi et al.: Changes of tropical mean outgoing shortwave radiation 1723
27
(a)
(b)
(c)
Figure 1. Geographical distribution of the outgoing shortwave radiation (OSR) at the
top of atmosphere (TOA), (a) as calculated by the model and (b) as derived by ERBE-S4 scanner data. Both give the annual long-term average calculated over the 60-month period covered by the ERBE-S4 dataset (1985-1989). Figure (c) gives the difference in OSR at TOA between the model computations and ERBE-S4 data.
Fig. 1. Geographical distribution of the outgoing shortwave
ra-diation (OSR in Wm−2) at the top of atmosphere (TOA), (a) as
calculated by the model and (b) as derived by ERBE-S4 scanner data. Both give the annual long-term average calculated over the 60-month period covered by the ERBE-S4 dataset (1985–1989). Figure
(c) gives the difference in OSR at TOA between the model
compu-tations and ERBE-S4 data.
the SW model results at both TOA and surface, in terms of comparison with ERBE-S4 scanner satellite data and Base-line Surface Radiation Network (BSRN) and Global Energy Balance Archive (GEBA) site measurements, respectively.
Climatological vertical distributions of temperature and water vapour as well as data of surface pressure, which are used for the model’s topography scheme, are taken either from the NCEP/NCAR or the ECMWF Global Reanalysis Projects. Total O3column abundance data are taken from the
Television Infrared Observational Satellite (TIROS) Opera-tional Vertical Sounder (TOVS) database, whereas aerosol optical properties, i.e. aerosol optical thickness (AOT), sin-gle scattering albedo (ωaer)and asymmetry parameter (gaer),
are taken from the Global Aerosol Data Set (GADS) (Koepke et al., 1997), and they are treated as in Hatzianastassiou et al. (2004b). 28 0 2 4 6 8 10 12 92 94 96 98 100 102 O S R a t T O A ( W m -2 ) Month ERBE Model
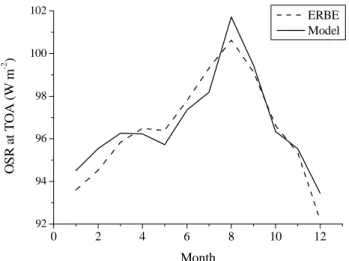
Figure 2. Average seasonal cycle displayed by the model OSR (solid line) and the
ERBE OSR (dashed line), after having subtracted from the model data the value of 1.5 Wm-2 (model bias).
Fig. 2. Average seasonal cycle displayed by the model OSR (solid
line) and the ERBE OSR (dashed line), after having subtracted from
the model data the value of 1.5 Wm−2(model bias).
3 Model validation
The model mean monthly OSR fluxes at TOA were vali-dated against high-quality ERBE-S4 scanner data for each 2.5◦×2.5◦latitude-longitude region for the years 1985–1989 (for which ERBE-S4 data are available). The validation was performed at pixel level for all pixels within the 30◦S–30◦N zone, providing good agreement, with a correlation coeffi-cient R equal to 0.96. The mean difference between model and ERBE fluxes is 1.5 Wm−2with a standard deviation of 8.6 Wm−2. Figure 1 shows the geographical distribution of the 5-year annual average of OSR at TOA as computed with our model and as derived by ERBE-S4 data, as well as the differences between the model results and the ERBE-S4 data. There is very good agreement with differences less than 5% over most pixels in the study region. Also, our model re-produces very well the 5-year average annual cycle of OSR over the tropical and subtropical region, as given by ERBE (Fig. 2). Given that the ERBE-S4 scanner data (1985–1989) do not provide long-term time series, the long-term (1985– 1999) ERBE S-10N (WFOV NF edition 2) non-scanner data were also used to serve for intercomparison with our model results (see next section). Note that in this case, our model results were downscaled to 5◦longitude-latitude resolution, to meet the spatial resolution of the ERBE S-10N data.
4 Results and discussion
4.1 Tropical interannual OSR flux anomalies: model ver-sus ERBE S-10N
Hatzianastassiou et al. (2004a) have reported a decreasing trend in the global mean OSR over the 14-year period 1984– 1997 claiming that this trend is attributed to low latitudes. In
1724 A. Fotiadi et al.: Changes of tropical mean outgoing shortwave radiation 29 Ja n-1984 Ja n-1985 Ja n-1986 Ja n-1987 Ja n-1988 Ja n-1989 Ja n-1990 Ja n-1991 Ja n-1992 Ja n-1993 Ja n-1994 Ja n-1995 Ja n-1996 Ja n-1997 Ja n-1998 Ja n-1999 Ja n-2000 -8 -6 -4 -2 0 2 4 6 8 Model ERBS Total Ac Anomaly Linear Fit Model Linear Fit Ac Anomaly
T O A O S R A n o m a ly ( W m -2 ) -6 -4 -2 0 2 4 6 El Nino El Nino Pinatubo recovery Pinatubo eruption La Nina T o ta l A c A n o m a ly (% ) El Nino
Figure 3. Time series of tropical (30º30ºN) mean model (blue line) and ERBE
S-10N (magenta line) top of atmosphere (TOA) outgoing shortwave radiation (OSR)
anomalies (in Wm-2), and ISCCP-D2 total cloud cover (Ac) anomalies (in %) (green line), over the time period 1984-2000. Linear regression fits to the model OSR flux
anomaly (blue line) and Ac anomaly (green line) are also shown.
Fig. 3. Time series of tropical (30◦S–30◦N) mean model (blue line) and ERBE S-10N (magenta line) top of atmosphere (TOA)
outgoing shortwave radiation (OSR) anomalies (in Wm−2), and
ISCCP-D2 total cloud cover (Ac) anomalies (in %) (green line),
over the time period 1984–2000. Linear regression fits to the model
OSR flux anomaly (blue line) and Acanomaly (green line) are also
shown.
this study, we have extended the study period up to 17 years, i.e. from January 1984 through December 2000, and focus on the zone 30◦S–30◦N where, according to satellite obser-vations, there is a significant trend in OSR. Inter-annual de-seasonalised (i.e. from which the average seasonal cycle has been removed) anomalies of the mean monthly OSR fluxes averaged over the zone 30◦S–30◦N, for the period 1984 to 2000, were calculated with the model and are shown in Fig. 3 (blue line).
The OSR anomaly shows great variation, up to ±6 Wm−2 above or below the 17-year mean. Interesting features can be seen in Fig. 3, which are due to El Ni˜no and La Ni˜na events and to Mount Pinatubo eruption (cf. Wielicki et al., 2002a). The increase in the reflected OSR at TOA within the year following the Pinatubo eruption is in good agree-ment with ERBE S-10N data as shown here (magenta line), as well as with PATMOS data (Jacobowitz et al., 2003). This rapid increase in OSR is followed by a recovery period. The effects of the strong 1997/1998 El Ni˜no event that were ev-ident in the observed and simulated OLR flux anomalies (Wielicki et al., 2002; Allan and Slingo, 2002; Hatzidim-itriou, et al., 2004) are not so evident here, although an asso-ciated peak exists, consisting in an OSR anomaly that passes from large negative values (about −6 Wm−2) to positives ones (∼1.5 Wm−2). However, as will be discussed below, a strong peak related to the 1997/1998 El Ni˜no event ap-pears in the zone 0◦–10◦S (cf. Fig. 6). Overall, the mean tropical OSR flux is found to have decreased over the period 1984–2000. The cloud cover (Ac) variability, in terms of
anomaly time series, over the same period (1984–2000) and the same region (30◦S–30◦N) as for OSR, is also given in
Fig. 3. The Acanomalies were derived from the ISCCP-D2
monthly mean data as differences from the 17-year averages. Note that the strong positive anomalies during the summer of 1991 are mostly attributed to low-level clouds and secon-darily to mid-level ones. This is due to the fact that after the Mt. Pinatubo eruption, the VIS/IR ISCCP Ac data
indi-cate a notable decrease of thin cirrus over oceans, accompa-nied by a comparable increase of altocumulus and cumulus clouds; over land, there are no significant changes (Luo et al., 2002). However, this is a temporary local effect, since the Mt. Pinatubo volcanic aerosol did not have a significant systematic effect on tropical cirrus properties such as cloud amount or optical thickness, as reported by Luo et al. (2002). This is an example of how changes in ISCCP radiances that are not related to clouds may be interpreted incorrectly as cloud effects by ISCCP. Nevertheless, even in such a case of spurious change in ISCCP cloud data, realistic changes in radiative fluxes can result by using these data.
Linear regressions to the OSR and Ac anomalies are also
given in Fig. 3. The time series of OSR anomaly, ex-hibit a significant long-term decreasing trend in the trop-ical and sub-troptrop-ical latitudes, well illustrated by the fit-ted linear regression. More specifically, the model com-puted OSR anomaly yields a linear decadal decrease equal to 1.9±0.3 Wm−2/decade. At the beginning of the study pe-riod, i.e. around the mid 1980s, the OSR anomaly is slightly positive, varying around 2 Wm−2, while there is a drop from the late 1980s, down to values of −2 Wm−2. The positive OSR anomalies at the beginning of the study period are prob-ably due to the influence of the El-Chichon eruption that took place in the spring of 1982.
Our model’s decadal decreasing trend of 1.9±0.3 Wm−2 in tropical and subtropical OSR anomaly is in quite good agreement with the revised value of 2.5 Wm−2for the OSR flux decrease given by Wielicki et al. (2002b), whereas recent corrections to the ERBE S-10N non-scanner data has resulted in a trend equal to 2.1 Wm−2(Wielicki, personal communi-cation). In terms of comparison with our model results, the corresponding tropical (30◦S–30◦N) mean OSR anomaly as derived from the ERBE S-10N (WFOV NF edition 2) non-scanner data is overlaid on Fig. 3. There is good agreement between the two time series. The linear decrease in tropi-cal OSR anomalies derived by ERBE S-10N data is equal to 2.5±0.4 Wm−2/decade, very close to our model computed value of 1.9±0.3 Wm−2/decade. The slightly larger variabil-ity of ERBE anomalies is probably due to the fact that there are missing 2.5◦×2.5◦ latitude-longitude region data in the ERBE S-10N in latitudes between 20◦and 30◦in both hemi-spheres. Consequently, our deterministic radiative transfer model is able to reproduce the decadal-scale trend and the observed patterns of the long-term variability in the OSR at TOA radiative flux anomalies over the tropical regions.
A. Fotiadi et al.: Changes of tropical mean outgoing shortwave radiation 1725
4.2 Correlation analysis of OSR flux and ISCCP cloud anomalies
It has been suggested (Wielicki et al., 2002a; Chen et al., 2002) that the large decadal variability in tropical OSR is caused by changes in tropical cloudiness. Recently, Hatzianastassiou et al. (2004), based on a sensitivity study, have also reported that the long-term decreasing trend in global mean OSR flux is mostly attributed to cloud cover. In this study, we have performed a thorough analysis identifying clouds as the main source of the model computed decreasing trend in OSR anomalies. At first, this is indicated by the patterns in the tropical mean cloud cover anomalies shown in Fig. 3; these patterns match very well those of OSR flux anomalies. Thus, the tropical cloud cover anomalies depict a decreasing trend, starting from the early 1990s. From 1984 through the late 1980s, the cloud cover has positive anoma-lies of about 2–4% above the 17-year mean, while after the early 1990s the total Acanomaly steadily decreases through
the late 1990s, reaching values around 4% below the long-term mean value. The overall computed linear decreasing trend in total cloud cover is equal to 6.6±0.2% per decade11. To further investigate and quantify the apparent correla-tion between the anomalies of OSR flux and total cloudi-ness over the tropical region 30◦S–30◦N, we performed a correlation analysis between the anomalies of model OSR flux and total Ac at 2.5◦×2.5◦ pixel level and on monthly
mean basis, for the 17-year period from January 1984 to December 2000; the relevant scatterplot is shown in Fig. 4. The total 704 658 pixel matched data pairs give a correla-tion coefficient equal to 0.79, indicating that the decrease in tropical cloud cover is mostly responsible for the satellite-observed and model computed decadal trend (decrease) in tropical OSR at TOA. Of course, cloud amount is a major determinant of OSR flux in our model (see Hatzianastas-siou et al., 2004a), though it is not the only one; for exam-ple the cloud optical depth and cloud asymmetry parameter also influence significantly the OSR. In this sense, the cor-relation between the OSR flux anomalies and those of cloud amount may be considered as some type of model sensitivity. To check the representativeness of the correlation results of Fig. 4a, we have also performed another correlation between the ERBE-S4 OSR flux anomalies and those of ISCCP-D2 cloud amount (Fig. 4b). This was done for the period 1985– 1989 based on the availability of ERBE-S4 data. The total number of 207 360 pixel matched data pairs give a correla-tion coefficient equal to 0.69, close to the coefficient of 0.79 from the correlation between model OSR flux and ISCCP-D2 Acanomalies for the 17-year period 1984–2000. In
par-ticular, to get the comparison between the two correlations more consistent, we have repeated the correlation between the model OSR flux and ISCCP-D2 Ac anomalies, but for
1Estimated percent decadal trend=100*(parameter decadal
change)/(17-year average)
(a)
(b) Fig. 4. Scatterplot comparison between (a) the pixel-level monthly
mean model computed top of atmosphere (TOA) outgoing
short-wave flux anomalies (in Wm−2)and the ISCCP-D2 total cloud
cover anomalies (%) for the region 30◦S–30◦N, over the period
1984–2000, and (b) the monthly mean ERBE-S4 TOA outgoing
shortwave flux anomalies (in Wm−2)and the ISCCP-D2 total cloud
cover anomalies (%) for the region 30◦S–30◦N, over the period
1985–1989. A total number of 704658 and 207360 box matched data pairs are plotted, respectively, and the fitted linear regressions and correlation coefficients (R) are also given.
the 5-year (1985–1989) period. The correlation coefficient was found to be equal to 0.76, i.e. very close to 0.69. Conse-quently, the correlation results between model OSR flux and ISCCP-D2 Acanomalies for the 17-year period (1984–2000)
are consistent and realistic and support our conclusion that the computed decadal decreasing trend in tropical OSR flux is due to decreasing tropical cloud cover. However, it should be pointed out that, in contrast to the ISCCP-D2 Acdata, no
1726 A. Fotiadi et al.: Changes of tropical mean outgoing shortwave radiation
Table 1. Correlation coefficient (R) values of the scatter plot
com-parison between the pixel-level monthly mean top of atmosphere (TOA) outgoing shortwave radiation (OSR) anomalies and total
cloud cover (Ac) anomalies for each 10◦ latitude zone between
30◦S–30◦N, over the time period 1984–2000.
Zones (◦) R (OSR – total Ac)
20◦–30◦N 0.76 10◦–20◦N 0.77 0◦–10◦N 0.81 10◦–0◦S 0.81 20◦–10◦S 0.78 30◦–20◦S 0.79
trend is found in the adjusted AVHRR PATMOS time series of cloud amount. Besides, no systematic trends are noticed in the PATMOS tropical OSR and OLR fluxes (Jacobowitz et al., 2003), compared to ERBE S-10N. Note also that there is a decreasing trend in the cloud amount time series from the CLAUS dataset (Hodges et al., 2000), which is consistent with that of ISCCP-D2 Ac data (Ellis et al., 2004).
More-over, the trend in ISCCP cloud data may still be uncertain to some extent, for example due to the view angle dependence (Campbell, 2004). Thus, overall, it is very interesting that in this study using cloud data derived from the ISCCP-D2 along with surface and atmospheric data from reanalysis projects, we compute a decreasing trend in OSR at TOA, which is in good agreement with the trend found in ERBE S-10N cor-rected records.
In order to investigate the covariability of the anomalies of OSR at TOA and cloudiness at global scale, the 17-year (1984–2000) time series of monthly mean 10◦ zonally av-eraged model-based OSR flux and ISCCP-D2 Ac anomalies
were constructed and are plotted in Figs. 5 and 6. For each 10◦latitude zone, linear regression fits are also plotted for both OSR and Acanomalies. There is an apparent correlation
between the long-term model-based OSR and Acanomalies,
especially in low and middle latitudes. Besides, there are significant decreasing trends in both OSR and Ac
anoma-lies in the latitudes between 50◦S and 60◦N, especially be-tween 30◦S–30◦N. We have computed the correlation coef-ficients of the scatterplot comparison between the pixel-level monthly mean model-based TOA OSR flux anomalies and total Acanomalies for each 10◦latitude zone, over the period
1984–2000. Table 1 summarises the correlation coefficients for each 10◦ zone between 30◦S–30◦N, although compu-tations have been also performed for the rest of the globe. Nevertheless, values are not given for latitudes poleward of 30◦N and S since, according to our analysis, the OSR and to-tal Acanomalies are mostly correlated in the zones between
30◦S and 30◦N, with correlation coefficients ranging from 0.76 to 0.81. The strongest correlation is found in the
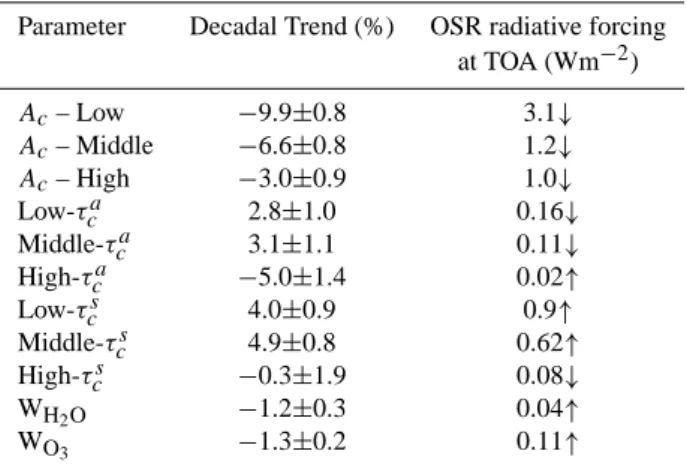
trop-Table 2. Decadal linear trend in low-, mid- and high-level cloud
cover (Ac), cloud absorption optical depth (τca), cloud scattering
optical depth (τcs), total precipitable water (WH2O), and total ozone
column abundance (WO3)for the 30
◦S–30◦N region, and the
cor-responding induced changes (radiative forcing in Wm−2)in the
out-going shortwave radiation (OSR) at the top of atmosphere (TOA).
Parameter Decadal Trend (%) OSR radiative forcing
at TOA (Wm−2) Ac– Low −9.9±0.8 3.1↓ Ac– Middle −6.6±0.8 1.2↓ Ac– High −3.0±0.9 1.0↓ Low-τca 2.8±1.0 0.16↓ Middle-τca 3.1±1.1 0.11↓ High-τca −5.0±1.4 0.02↑ Low-τcs 4.0±0.9 0.9↑ Middle-τcs 4.9±0.8 0.62↑ High-τcs −0.3±1.9 0.08↓ WH2O −1.2±0.3 0.04↑ WO3 −1.3±0.2 0.11↑
ical latitudes 0◦–10◦N and S. Indeed, Figs. 5 and 6 confirm that anomalies of model-based OSR flux and total Ac have
very similar inter-annual variability patterns between 10◦S– 10◦N, but also between 30◦S and 30◦N. The correlation coefficient values gradually drop down to 0.41 towards the middle latitudes, and to no significant values in polar areas. Note that, as it has been already mentioned, the El Ni˜no event of 1997/1998 is clearly indicated in the zone 0◦–10◦S, in both OSR and Acanomalies. Actually, the zonal mean OSR
anomalies reach values up to about 10 Wm−2from January through March of 1998 in zone 0◦–10◦S. These large anoma-lies, are related to the westward extension of the convection across the tropical Pacific and over the South Pacific con-vergence zone, i.e. over areas characterised by positive OSR anomalies as large as 100 Wm−2. According to our analysis using ISCCP data, the decreasing trend in total cloudiness in areas between 30◦S–30◦N is primarily attributed to low-level clouds and much less to mid- and high-low-level clouds, except for a few cases, such as 20◦S–30◦S and 30◦S–40◦S,
where the high-level clouds show a stronger decreasing trend than low- or mid-level ones.
We have attempted to determine which of the main clima-tological parameters (described in Sect. 2) that determine the OSR at TOA, contribute significantly to the observed mean tropical OSR trend (as computed by our model) for the period 1984–2000. The methodology is the following: the anomaly time series of each input parameter were constructed for the period 1984–2000 and for the region 30◦S–30◦N, in exactly the same way as for the OSR and total cloud cover anomaly time series. Then, the existence of any long-term trend was quantified by applying a simple linear regression analysis, and whenever a statistically significant long-term trend was
A. Fotiadi et al.: Changes of tropical mean outgoing shortwave radiation 1727 19 8 4 1985 1986 198 7 19 8 8 1989 1990 199 1 199 2 1993 1994 199 5 199 6 19 9 7 1998 1999 200 0 -12 -8 -4 0 4 8 12 -24 -18 -12 -6 0 6 12 18 24T ota l Cl ou d C ov e r A nom aly (% ) 80o N-90o N 198 4 19 85 1986 1987 198 8 19 89 19 90 19 91 19 92 19 93 19 94 19 95 19 96 199 7 19 98 1999 2000 -12 -8 -4 0 4 8 12 -30 -24 -18 -12 -6 0 6 12 70oN-80oN 198 4 19 85 1986 1987 198 8 19 89 19 90 19 91 19 92 19 93 19 94 19 95 19 96 199 7 19 98 1999 2000 -12 -8 -4 0 4 8 12 -12 -8 -4 0 4 8 12 T O A S W F lux A nom al y (Wm -2) 60 o N 70o N 1984 1985 198 6 19 87 1988 1989 1990 1991 1992 1993 1994 1995 1996 1997 1998 199 9 20 00 -8 -4 0 4 8 -8 -4 0 4 T o ta l C lou d C ov er A nom aly (% ) 50o N -60o N 198 4 19 85 19 8 6 19 8 7 198 8 19 89 19 90 19 9 1 19 9 2 19 93 19 94 19 9 5 19 9 6 199 7 19 98 19 9 9 20 0 0 -8 -4 0 4 8 -4 0 4 40oN -50oN 1984 1985 198 6 19 87 1988 1989 1990 1991 1992 1993 1994 1995 1996 1997 1998 199 9 20 00 -12 -8 -4 0 4 8 12 -8 -4 0 4 8 T O A SW F lu x An om a ly ( W m -2) 30oN -40oN 1984 1985 198 6 19 87 1988 1989 1990 1991 1992 1993 1994 1995 1996 1997 1998 199 9 20 00 -10 -5 0 5 10 -8 -4 0 4 8 T ot al Cl oud C ov er A nom aly (% ) 20o N - 30o N 19 8 4 1985 198 6 19 87 19 8 8 1989 1990 1991 1992 1993 1994 1995 1996 199 7 1998 199 9 20 00 -12 -8 -4 0 4 8 12 -8 -4 0 4 8 10oN - 20oN 1984 1985 198 6 19 87 1988 1989 1990 1991 1992 1993 1994 1995 1996 1997 1998 199 9 20 00 -12 -8 -4 0 4 8 12 -8 -4 0 4 T O A S W F lux A nom a ly ( W m -2 ) 0o N - 10o N
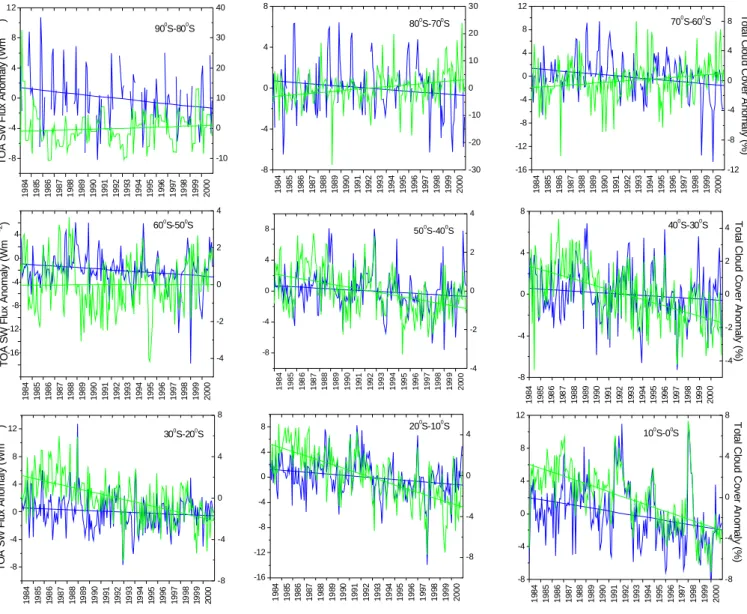
Fig. 5. Time series of 10◦latitude zonal averages of the anomalies of top of atmosphere (TOA) outgoing shortwave radiation (OSR) flux (in
Wm−2, blue lines) and total cloud cover (%, green lines) for the North Hemisphere, over the period 1984–2000. Linear regression fits to the
OSR and Acanomalies are also displayed.
found for a parameter, this was introduced for the particular parameter in the model. To assess the statistical significance of long-term terms, the Mann-Kendall test was applied to the anomaly time-series. The OSR at TOA for each year of the study period (1984–2000), and the induced overall change in OSR (in Wm−2) was computed. Table 2 summarises the results of this analysis. All cloud types show a linearly decreasing trend over the study period, with the low-level clouds having the largest trend, equal to −3.9±0.3% in ab-solute values or −9.9±0.8% per decade in relative terms. Of course, there are still some uncertainties, since the changes in low-level clouds derived from the ISCCP-D2 data, are not necessarily consistent with changes derived from the sec-ond Stratospheric Aerosols and Gas Experiment (SAGE II, Wang et al., 2002) and synoptic observations (Norris, 1999). Nevertheless, note that SAGE II tropical clouds refer to
up-permost opaque clouds (with vertical optical depth greater than 0.025 at 1.02 µm), while the aforementioned synoptic cloud observations are taken over oceans only. The mid-level clouds decreased by 1.4±0.2% in absolute values or by 6.6±0.8% per decade in relative terms, while the high-level ones also decreased by 1.2±0.4% or 3±0.9% per decade in relative terms, i.e. less than low and middle clouds. Thus, the VIS/IR mean tropical (30◦S–30◦N) low-level clouds are found to have undergone the greatest decrease during the pe-riod 1984–2000, in agreement with the findings of Chen et al. (2002) and Lin et al. (2004). As for the other parame-ters, the cloud absorption optical depth for low and middle clouds has increased by 2.8±1% and 3.1±1.1% per decade, respectively, whereas that of high-level clouds decreased by 5±1.4% per decade. The corresponding values for the cloud scattering optical depth are equal to 4±0.9%, 4.9±0.8% and
1728 A. Fotiadi et al.: Changes of tropical mean outgoing shortwave radiation
32
1 9 8 4 1 9 8 5 1 9 8 6 1 9 8 7 1 9 8 8 1 9 8 9 1 9 9 0 1 9 9 1 1 9 9 2 1 9 9 3 1 9 9 4 1 9 9 5 1 9 9 6 1 9 9 7 1 9 9 8 1 9 9 9 2 0 0 0 -8 -4 0 4 8 -4 -2 0 2 4 500 S-400 S 1 9 8 4 1 9 8 5 1 9 8 6 1 9 8 7 1 9 8 8 1 9 8 9 1 9 9 0 1 9 9 1 1 9 9 2 1 9 9 3 1 9 9 4 1 9 9 5 1 9 9 6 1 9 9 7 1 9 9 8 1 9 9 9 2 0 0 0 -8 -4 0 4 8 12 -8 -4 0 4 8 T O A S W F lu x A n o m a ly ( W m -2) 300 S-200 S 1 9 8 4 1 9 8 5 1 9 8 6 1 9 8 7 1 9 8 8 1 9 8 9 1 9 9 0 1 9 9 1 1 9 9 2 1 9 9 3 1 9 9 4 1 9 9 5 1 9 9 6 1 9 9 7 1 9 9 8 1 9 9 9 2 0 0 0 -16 -12 -8 -4 0 4 8 -8 -4 0 4 200S-100S 1 9 8 4 1 9 8 5 1 9 8 6 1 9 8 7 1 9 8 8 1 9 8 9 1 9 9 0 1 9 9 1 1 9 9 2 1 9 9 3 1 9 9 4 1 9 9 5 1 9 9 6 1 9 9 7 1 9 9 8 1 9 9 9 2 0 0 0 -8 -4 0 4 8 12 -8 -4 0 4 8T o ta l C lo u d C o v e r A n o m a ly (% ) 100 S-00 S 1 9 8 4 1 9 8 5 1 9 8 6 1 9 8 7 1 9 8 8 1 9 8 9 1 9 9 0 1 9 9 1 1 9 9 2 1 9 9 3 1 9 9 4 1 9 9 5 1 9 9 6 1 9 9 7 1 9 9 8 1 9 9 9 2 0 0 0 -8 -4 0 4 8 -4 -2 0 2 4 T o ta l C lo u d C o v e r A n o m a ly ( % ) 400S-300S 1 9 8 4 1 9 8 5 1 9 8 6 1 9 8 7 1 9 8 8 1 9 8 9 1 9 9 0 1 9 9 1 1 9 9 2 1 9 9 3 1 9 9 4 1 9 9 5 1 9 9 6 1 9 9 7 1 9 9 8 1 9 9 9 2 0 0 0 -16 -12 -8 -4 0 4 -4 -2 0 2 4 T O A S W F lu x A n o m a ly ( W m -2) 60 0 S-500S 1 9 8 4 1 9 8 5 1 9 8 6 1 9 8 7 1 9 8 8 1 9 8 9 1 9 9 0 1 9 9 1 1 9 9 2 1 9 9 3 1 9 9 4 1 9 9 5 1 9 9 6 1 9 9 7 1 9 9 8 1 9 9 9 2 0 0 0 -16 -12 -8 -4 0 4 8 12 -12 -8 -4 0 4 8 700S-600S T o ta l C lo u d C o v e r A n o m a ly (% ) 1 9 8 4 1 9 8 5 1 9 8 6 1 9 8 7 1 9 8 8 1 9 8 9 1 9 9 0 1 9 9 1 1 9 9 2 1 9 9 3 1 9 9 4 1 9 9 5 1 9 9 6 1 9 9 7 1 9 9 8 1 9 9 9 2 0 0 0 -8 -4 0 4 8 -30 -20 -10 0 10 20 30 800 S-700 S 1 9 8 4 1 9 8 5 1 9 8 6 1 9 8 7 1 9 8 8 1 9 8 9 1 9 9 0 1 9 9 1 1 9 9 2 1 9 9 3 1 9 9 4 1 9 9 5 1 9 9 6 1 9 9 7 1 9 9 8 1 9 9 9 2 0 0 0 -8 -4 0 4 8 12 -10 0 10 20 30 40 T O A S W F lu x A n o m a ly ( W m -2) 900 S-800SFigure 6. As in Figure 5, but for the South Hemisphere.
Fig. 6. As in Fig. 5, but for the South Hemisphere.
−0.3±1.9% per decade for the low-, mid- and high-level clouds, respectively (the high-level clouds have no signifi-cant trend because of large error). Finally, total precipitable water and total ozone column abundance show small decreas-ing decadal trends although reduced precipitable water in NCEP was shown to be spurious compared with Special Sen-sor Microwave/Imager (SSM/I) data (e.g. Allan et al., 2004). According to Table 2, the decrease in low-level cloud amount results in a significant decrease in OSR at TOA of 3.1 Wm−2, whereas the decreases in mid- and high-level cloud cover have induced smaller decreases in OSR, equal to 1.2 and 1.0 Wm−2, respectively. This is normal since (i) the decrease in low-level Ac is larger than that for
mid-and high-level Ac (as shown in Table 2), and (ii) the OSR
is more sensitive to low clouds rather than to mid- or high-level clouds, as shown by a sensitivity study performed by
Hatzianastassiou et al. (2004a); the latter is due to the op-tically thicker low-level than higher clouds, especially over southern subtropical oceans. Although the computed de-crease in mid-level clouds is greater than that of high-level clouds, the corresponding decrease in OSR induced by the middle clouds is almost equal to the OSR decrease intro-duced by high-level clouds. This can be explained by the fact that OSR is more sensitive to high-level than to mid-dle clouds (Hatzianastassiou et al., 2004a). Among the other parameters, only the cloud scattering optical depth of low-and mid-level clouds introduces significant increases in the OSR at TOA, equal to 0.9 and 0.62 Wm−2, respectively. The contribution of the rest of the parameters to the overall OSR trend is minor. Therefore, the observed trend in the tropi-cal mean OSR at TOA (as computed by our model) over the period 1984–2000, is mostly explained by changes in cloud
A. Fotiadi et al.: Changes of tropical mean outgoing shortwave radiation 1729
amount, and especially those of low-level clouds, rather than any change in other cloud properties or other physical input parameter. More specifically, the OSR radiative forcing due to low-level clouds represents about 78% of the total OSR forcing induced by all parameters. Nevertheless, it should be pointed out that there are still issues as to the reliability of ISCCP cloud trends. For example, although the most serious calibration changes, which represented an important problem (Klein and Hartman, 1993; Rossow and Cairns, 1995), have been adjusted for in the last ISCCP-D series data, there are still uncertainties related with the dependence of trends in ISCCP cloudiness on view angle (e.g. Campbell, 2004).
5 Conclusions
To summarise, a model analysis was performed, using a SW radiative transfer model along with mean monthly cli-matological data for key physical parameters taken from the ISCCP-D2 data set and the NCEP/NCAR and ECMWF global reanalysis projects. Our results indicate that there has been a decrease in the mean tropical and subtropical (30◦S–30◦N) OSR at TOA, between January 1984 and De-cember 2000, of 1.9±0.3 Wm−2/decade. This decrease is in good agreement with the results of Wielicki et al. (2002a,b), and close to the computed value of 2.5±0.4 Wm−2derived from the long-term ERBE S-10N (WFOV NF edition 2) non-scanner OSR time series. The 17-year (1984–2000) time series of anomalies in both OSR flux at TOA and various physical parameters were constructed as departures from the corresponding 17-year mean values. The performed corre-lation analysis between mean monthly pixel-level anoma-lies of model OSR flux at TOA and VIS/IR ISCCP-D2 total cloud cover over the tropical and subtropical regions (30◦S– 30◦N), has shown a significant correlation, with a coefficient equal to 0.79. Our analysis of the inter-annual and long-term variability of the various parameters delong-termining the OSR at TOA, has shown that the most important contribu-tion to the observed OSR trend comes from a decrease in VIS/IR low-level cloud amount over the period 1984–2000, followed by smaller decreasing trends in mid- and high-level cloudiness. Opposite but small trends are introduced by an increase in cloud scattering optical depth of low clouds, and a smaller increase for middle-level clouds. It should be pointed out, however, that there are still uncertainties re-lated to the trends in ISCCP-D2 clouds, and especially the low-level ones. Overall, our model is able to reproduce the observed decadal-scale decreasing trend and the patterns of the long-term variability of OSR at TOA over tropical re-gions. This trend is due to corresponding decreasing trend in ISCCP-D2 cloudiness, especially the low-level one. Al-though this can be expected, given the sensitivity of radia-tive transfer calculations to the input variables, in particular clouds, and despite possible uncertainties and problems with ISCCP cloud data, it is very interesting that we obtain good
agreement between the model computed trend in OSR and that derived from ESRB data. Finally we note that the OSR trend of 1.9±0.3 Wm−2/decade as computed by our model, is balanced by the OLR trend of 1.9±0.2 Wm−2/decade com-puted by Hatzidimitriou et al. (2004) using a corresponding deterministic LW radiative transfer model, resulting thus in an absence of any decadal trend in the net (all-wave) radia-tion budget at TOA during the study period.
Acknowledgements. This research was funded by the
Euro-pean Commission (contract: EVK2-CT-2000-00055) under the Thematic Program: Preserving the Ecosystem; Key Action 2: Global Change, Climate and Biodiversity. The ISCCP-D2 data were obtained from the NASA Langley Research Center (LaRC) Atmospheric Sciences Data Center (ASDC). The NCEP/NCAR Global Reanalysis Project data were taken from the National Oceanic and Atmospheric Administration (NOAA) Cooperative Institute for Research in Environmental Sciences (CIRES) Climate Diagnostics Center, Boulder, Colorado, USA. The ECMWF data were obtained from the Data Ordering Service of ECMWF. The GADS aerosol data were obtained from the Meteorological Institute of the University of Munich, Germany (http://www.meteo. physik.uni-muenchen.de/strahlung/aerosol/aerosol.htm).
Edited by: A. Nenes
References
Allan, R. P., Ringer, M. A., Pamment, J. A., and Slingo, A.: Simu-lation of the Earth’s radiation budget by the European Centre for Medium-Range Weather Forecasts 40-year reanalysis (ERA40), J. Geophys. Res., 109, D18107, doi:10.1029/2004JD004816, 2004.
Allan, R. P. and Slingo, A.: Can current climate forcings explain the spatial and temporal signatures of decadal OLR variations?, Geophys. Res. Lett., 29(7), 1141, doi:10.1029/2001GL014620, 2002.
Barkstrom, B., Harrison, E., Smith, G., Green, R., Kibler, J., Cess, R., and ERBE Science team: Earth Radiation Budget Experi-ment (ERBE) archival and April 1985 results, Bull. Am. Meteo-rol. Soc., 70, 1254–1262, 1989.
Campbell, G. G.: View angle dependence of cloudiness and the trend in ISCCP cloudiness, 13th AMS conference on Satellite Meteorology and Oceanography, 20–24 September 2004, Nor-folk, VA, Abstr. No. P6.7, 2004.
Chen, J., Carlson, B. E., and Del Genio, A. D.: Evidence for strengthening of the tropical general circulation in the 1990s, Sci-ence, 295, 838–841, 2002.
Ellis, T. D., Stephens, G. L., and Thompson, D. W.: Evalua-tion of cloud amount trend and connecEvalua-tions large scale dynam-ics, 15th Symposium on Global Change and Climate Variations, The 84th AMS Annual Meeting, 11–15 January 2004, Seattle, WA, USA, Abstr. No. 5.7, http://reef.atmos.colostate.edu/ellis/ AMStalk.html, 2004.
Hatzianastassiou, N. and Vardavas, I.: Shortwave radiation budget of the Northern Hemisphere using International Satellite Cloud Climatology Project and NCEP/NCAR climatological data, J. Geophys. Res., 104, 24 401–24 421, 1999.
1730 A. Fotiadi et al.: Changes of tropical mean outgoing shortwave radiation
Hatzianastassiou, N. and Vardavas, I.: Shortwave radiation budget of the Southern Hemisphere using ISCCP C2 and NCEP/NCAR climatological data, J. Climate, 14, 4319–4329, 2001.
Hatzianastassiou, N., Fotiadi, A., Matsoukas, C., Drakakis, E., Pavlakis, K. G., Hatzidimitriou, D., and I. Vardavas: Long-term Global Distribution of Shortwave Radiation Budget at the Top of Atmosphere, Atmos. Chem. Phys., 4, 1217–1235, 2004a,
SRef-ID: 1680-7324/acp/2004-4-1217.
Hatzianastassiou, N., Katsoulis, B., and Vardavas, I.: Global dis-tribution of aerosol direct radiative forcing in the ultraviolet and visible arising under clear skies, Tellus, 56B, 51–71, 2004b. Hatzidimitriou, D., Vardavas, I., Pavlakis, K. G., Hatzianastassiou,
N., Matsoukas, C., and Drakakis, E.: On the decadal increase in the tropical mean outgoing longwave radiation for the period 1984-2000, Atmos. Chem. Phys., 4, 1419–1425, 2004,
SRef-ID: 1680-7324/acp/2004-4-1419.
Hodges, K. I., Chappell, D. W., Robinson, G. J., and Yang, G.: An improved algorithm for generating global window brightness temperatures from multiple satellite infrared imagery, J. Atmos, Ocean Tech., 17, 1296–1312, 2000.
Intergovernmental Panel on Climate Change (IPCC): Climate Chance 2001: The Scientific Basis, edited by: Houghton, J., Ding, Y., Griggs, D. J., Noguer, M., Van der Linden, P. J., Dai, X., Maskell, K., and Johnson, C. A., 881 pp., Cambridge Univer-sity Press, Cambridge, 2001.
Jacobowitz, H., Stowe, L. L., Ohring, G., Heidinger, A., Knapp, K., and Nalli, N. R.: The Advanced Very High Resolution Ra-diometer Pathfinder Atmosphere (PATMOS) Climate Dataset: A resource for Climate Research, Bull. Am. Meteor. Soc., 84, 785– 793, 2003.
Klein, S. A. and Hartmann, D. L.: Spurious changes in the ISCCP data set, Geophys. Res. Lett., 20, 455–458, 1993.
Koepke, P., Hess, M., Schult, I., and Shettle, E. P.: Global aerosol data set, Rep. No. 243, Max-Plank Institute fur Meteorologie, 44 pp., Hamburg Germany, 1997.
Lin, B., Wong, T., Wielicki, B. A., and Hu, Y.: Examination of the Decadal Tropical Mean ERBS Nonscanner Radiation Data for the Iris Hypothesis, J. Climate, 17, 1239–1246, 2004.
Luo, Z., Rossow, W. B., Inoue, T., and Stubenrauch, C. J.: Did the eruption of the Mt. Pinatubo volcano affect cirrus properties?, J. Climate, 15, 2806–2820, 2002.
Rossow, W. B. and Cairns, B.: Monitoring changes of clouds, Cli-mate Change, 31, 305–347, 1995.
Rossow, W. B. and Schiffer, R. A.: Advances in understanding clouds from ISCCP, Bull. Am. Meteorol. Soc., 80, 2261–2287, 1999.
Rossow, W. B., Walker, A. W., Beuschel, D. E., and Roiter, M. D.: International Satellite Cloud Climatology Project (ISCCP). Documentation of new cloud datasets, 115 pp., World Meteorol. Org., Geneva, 1996.
Vardavas, I. M. and Koutoulaki, K.: A model for the solar radia-tion budget of the Norther Hemisphere: Comparison with Earth Radiation Budget Experiment data, J. Geophys. Res., 100, 7303– 7314, 1995.
Wang, P.-H., Minnis, P., Wielicki, B. A., Wong, T., and Van, L. B.: Satellite observations of long-term changes in tropical cloud and outgoing longwave radiation from 1985 to 1998, Geophys. Res. Lett., 29, 10, 1397, doi:10.1029/2001GL014264, 2002. Wielicki, B. A., Wong, T. M., Allan, R. P., Slingo, A., Kiehl, J. T.,
Soden, B. J., Gordon, C. T., Miller, A. J., Yang, S.-K., Randall, D. A., Robertson, F., Susskind, J., and Jacobowitz, H.: Evidence for large decadal variability in the tropical mean radiative energy budget, Science, 295, 841–844, 2002a.
Wielicki, B. A., Del Genio, A. D., Wong, T., Chen, J., Carlson, B. A., Allan, R. P., Robertson, F., Jacobowitz, H., Slingo, A., Randall, D. A., Kiehl, J. T., Soden, B. J., Gordon, C. T., Miller, A. J., Yang, S., and Susskind, J.: Changes in Tropical Clouds and Radiation, Response, Science, 296, p. 2095, 2002b.
Zhang, Y., Rossow, W. B., Lacis, A. A., Oinas, V., and Mishchenko, M. I.: Calculation of radiative fluxes from the surface to top of atmosphere based on ISCCP and other global data sets: Refine-ments of the radiative transfer model and the input data, J. Geo-phys. Res., 109, D19105, doi:10.1029/2003JD004457, 2004.