HAL Id: hal-00295491
https://hal.archives-ouvertes.fr/hal-00295491
Submitted on 27 Aug 2004
HAL is a multi-disciplinary open access
archive for the deposit and dissemination of
sci-entific research documents, whether they are
pub-lished or not. The documents may come from
teaching and research institutions in France or
abroad, or from public or private research centers.
L’archive ouverte pluridisciplinaire HAL, est
destinée au dépôt et à la diffusion de documents
scientifiques de niveau recherche, publiés ou non,
émanant des établissements d’enseignement et de
recherche français ou étrangers, des laboratoires
publics ou privés.
On the decadal increase in the tropical mean outgoing
longwave radiation for the period 1984-2000
D. Hatzidimitriou, I. Vardavas, K. G. Pavlakis, N. Hatzianastassiou, C.
Matsoukas, E. Drakakis
To cite this version:
D. Hatzidimitriou, I. Vardavas, K. G. Pavlakis, N. Hatzianastassiou, C. Matsoukas, et al.. On the
decadal increase in the tropical mean outgoing longwave radiation for the period 1984-2000.
At-mospheric Chemistry and Physics, European Geosciences Union, 2004, 4 (5), pp.1419-1425.
�hal-00295491�
www.atmos-chem-phys.org/acp/4/1419/
SRef-ID: 1680-7324/acp/2004-4-1419
Chemistry
and Physics
On the decadal increase in the tropical mean outgoing longwave
radiation for the period 1984–2000
D. Hatzidimitriou1, 2, I. Vardavas1, 2, K. G. Pavlakis2, N. Hatzianastassiou2,3, C. Matsoukas2, and E. Drakakis2,4
1Department of Physics, University of Crete, Heraklion, Crete, Greece 2Foundation for Research and Technology-Hellas, Heraklion, Crete, Greece 3Department of Physics, University of Ioannina, Greece
4Department of Electrical Engineering, Technological Educational Institute of Crete, Greece
Received: 10 February 2004 – Published in Atmos. Chem. Phys. Discuss.: 17 May 2004 Revised: 23 July 2004 – Accepted: 18 August 2004 – Published: 27 August 2004
Abstract. In the present paper, we have calculated the
outgo-ing longwave radiation at the top of the atmosphere (OLR at TOA) using a deterministic radiation transfer model, cloud data from ISCCP-D, and atmospheric temperature and hu-midity data from NCEP/NCAR reanalysis, for the seventeen-year period 1984–2000. We constructed anomaly time-series of the OLR at TOA, as well as of all of the key input cli-matological data, averaged in the tropical region between 20◦N and 20◦S. We compared the anomaly time-series of the model calculated OLR at TOA with that obtained from the ERBE S-10N (WFOV NF edition 2) non-scanner mea-surements. The model results display very similar seasonal and inter-annual variability as the ERBS data, and indicate a decadal increase of OLR at TOA of 1.9±0.2 Wm−2/decade, which is lower than that displayed by the ERBS time-series (3.5±0.3 Wm−2). Analysis of the inter-annual and long-term variability of the various parameters determining the OLR at TOA, showed that the most important contribution to the ob-served trend comes from a decrease in high-level cloud cover over the period 1984–2000, followed by an apparent drying of the upper troposphere and a decrease in low-level cloudi-ness. Opposite but small trends are introduced by a decrease in low-level cloud top pressure, an apparent cooling of the lower stratosphere (at the 50 mbar level) and a small decadal increase in mid-level cloud cover.
1 Introduction
Recent analysis of satellite broadband observations (ERBS WFOV, ERBE/ERBS scanner, ScaRaB, CERES) of the out-going longwave (thermal infrared) radiation (OLR) at the top of the atmosphere (TOA) over the period 1979–2001
indi-Correspondence to: I. Vardavas
cates that in the tropical region there has been a significant increase in the OLR at TOA by about 2.8 Wm−2/decade1 (Chen et al., 2002; Wielicki et al., 2002a, b). Most of this occurred from the late 1980s to the mid to late 1990s and ap-pears to be related to a decrease in total cloudiness (as given by ISCCP) for the same period over the tropics. Wang et al. (2002) used a simple parameterisation for the cloud long-wave radiative forcing, along with cloud vertical distribu-tions derived from SAGE II solar occultation measurements, to conclude that about 40% of the observed OLR trend for the years 1985–1998 can be accounted for by changes in the cloud vertical distribution, while they suggested that a change in cloud effective emissivity (i.e. the product of cloud fraction and emissivity) could account for the remainder of the OLR changes. Chen et al. (2002) found that the ob-served flux changes are associated with a decadal-time-scale strengthening of the tropical Hadley and Walker circulations. Trenberth (2002), however, challenged the reality of the OLR trend, because of the great difficulty of deriving reliable flux time-series from space, when there is no overlap between satellite records. Observations from narrowband scanning ra-diometers (AVHRR and HIRS) have been used (Wielicki et al., 2002a, data supplement http://www.sciencemag.org/cgi/ content/full/295/5556/841/DC1) to derive broadband long-wave radiative fluxes: AVHRR OLR fluxes showed a de-crease of 2 Wm−2/decade in the tropical region, for the pe-riod 1985–2000, while HIRS OLR data showed an increase of about 1 Wm−2/decade for the same period. In the re-cent reprocessing of AVHRR data, which resulted in the PATMOS climate dataset, Jacobowitz et al. (2003) examined the time-series of the OLR at TOA, in the tropics (20◦N– 20◦S), for the period from September 1981 through to De-cember 1999. They found that the OLR decreased by a little less than 2 Wm−2 for the period from 1985 to 2000.
1420 D. Hatzidimitriou et al.: Decadal increase in the tropical mean outgoing longwave radiation (1984–2000)
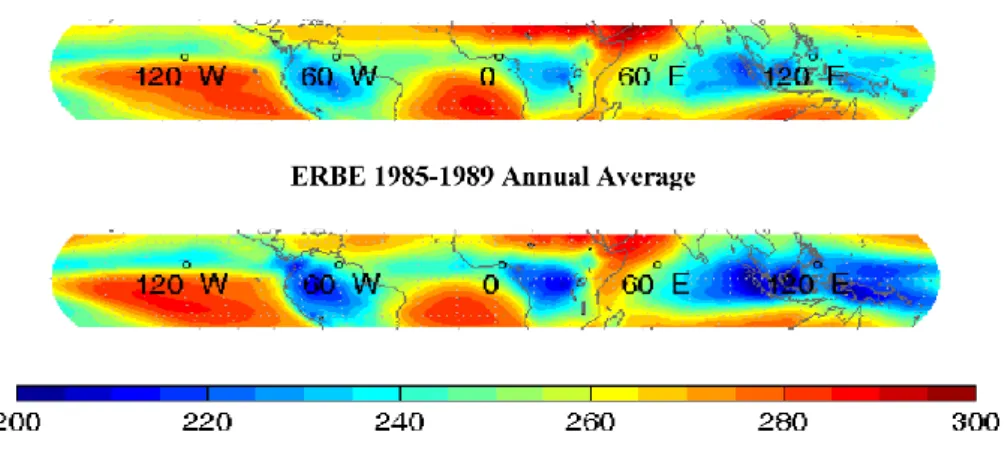
Fig. 1. The upper panel shows the geographical distribution of the outgoing longwave radiation at the top of the atmosphere as calculated
by the model, while the lower panel as given by ERBE. Both maps give the annual long-term average calculated over the 52-month period covered by the ERBE dataset (1985–1989).
However, this decrease was caused mainly by larger values of the OLR from 1985 to 1988, compared to the rest of the values from 1988 to 2000. They conclude that, on the whole, there was no consistent trend throughout the 18-year period. Finally, it is also noteworthy that General Circula-tion Models, studied by Wielicki et al. (2002a) and Allan and Slingo (2002), failed to show any long-term trend of the OLR at TOA.
In the present paper, we have calculated the OLR at TOA using a deterministic radiation transfer model, cloud data from ISCCP-D, and atmospheric temperature and humid-ity data from NCEP/NCAR reanalysis, for the period 1984– 2000. We then constructed anomaly time-series of the OLR at TOA, as well as of all of the key input climatological data, averaged in the tropical region between 20◦N and 20◦S. We compared the anomaly time-series of the OLR at TOA with that obtained from the ERBS S-10N (edition 2) mea-surements. We then examined the effect of any long-term changes detected in the time-series of the input data, to changes of the OLR at TOA.
2 Model description and input data
The LW fluxes at TOA and at the Earth’s surface were com-puted using the FORTH longwave radiative transfer model, which is based on a detailed radiative-convective model (Var-davas and Carver, 1984). The model has been successfully tested (cf. Hatzianastassiou et al., 1999; Hatzianastassiou and Vardavas, 2001) according to the Inter-comparison of Radi-ation Codes in Climate Models (ICRCCM) program. The same model was also used to calculate the downwelling long-wave fluxes at the surface in Pavlakis et al. (2004).
Monthly fluxes were derived on a 2.5◦resolution, for the tropical region, between 20◦N and 20◦S. We used simple expressions for the total absorption of infrared radiation by the atmospheric molecules, independently in each 2.5◦×2.5◦ pixel, dividing vertically the atmosphere (from the surface up to 50 mb) in about 5 mb layers to ensure that they are opti-cally thin with respect to the Planck mean longwave opac-ity, and using simple transmission coefficients which depend on the amount of absorbing molecules in each layer. The molecules considered are; H2O, CO2, CH4, O3, and N2O.
The sky is divided into clear and cloudy fractions. The cloudy fraction includes three non-overlapping layers of low, mid and high-level clouds2. Expressions for the fluxes for clear and cloudy sky can be found in Hatzianastassiou et al. (1999). All of the cloud climatological data are taken from the ISCCP-D2 data set (Rossow and Schiffer, 1999), which supplies monthly means for 72 climatological variables in 2.5◦equal-angle pixels for the period 1984–2000. For the total amount of ozone, carbon dioxide, methane, and nitrous oxide, we used the same values as in Hatzianastassiou and Vardavas (2001).
The vertical distributions of the temperature and water va-por are taken from the NCEP/NCAR reanalysis (Kistler et al., 2001), corrected for topography as in Hatzianastassiou et al. (2001).
2Quantification of the cloud overlap effect on the OLF is a
diffi-cult problem. However, for example, based on the maximum over-lap scheme without conservation of the optical depth, described in Chen et al (2000), we estimate that the observed trend in the OLF, would be increased by up to 0.2 Wm−2/decade. On the other hand, assuming conservation of the optical depth with maximum overlap, there is an equivalent decrease in the OLF trend.
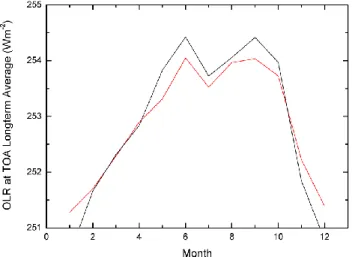
Fig. 2. Average seasonal cycle displayed by the model OLR (black
line) and the ERBE OLR (red line), after having subtracted from the model data the value of 4.6 Wm−2(model bias).
Above the 300 mb level, NCEP/NCAR does not provide water vapor data, thus we have used a typical specific humid-ity at 50 mb based on HALOE measurements at that level. HALOE data do not cover the entire period studied here. We have, thus, adopted the same average value for all years; this point is further discussed later.
3 Model validation
The model calculated outgoing fluxes at the top of the at-mosphere were validated against ERBE (Earth Radiation Budget Experiment) scanner fluxes, for the years 1985– 1989 (for which ERBE data are available), for all 2.5◦ grid-boxes within the 20◦N–20◦S zone. The correlation coeffi-cient between model calculated and ERBE fluxes is R=0.96. The average difference between model and ERBE fluxes is 4.6±0.1 Wm−2, with a standard deviation of 6.3 Wm−2, with the model fluxes being higher on average than the ERBE fluxes. Figure 1 shows the geographical distribution of the long-term annual average of the longwave outgoing flux at the top of the atmosphere as calculated by the model (upper panel) and as given by ERBE (lower panel). The agreement is generally very good, with differences less than 5% on a pixel level over most of the area studied. The average sea-sonal cycle displayed by the model fluxes for the tropical zone is also in excellent agreement with the seasonal vari-ability displayed by the ERBE data, as can be seen in Fig. 2. A full analysis of the model results both regionally and glob-ally, using different reanalysis input data for the temperature and humidity profiles (along the lines of the study of Pavlakis et al., 2004, for the downwelling longwave flux) are beyond the scope of the present paper and will be the subject of a future paper.
Fig. 3. Time-series of the tropical (20◦N–20◦S) mean outgoing longwave radiation anomaly at the top of the atmosphere for the pe-riod 1984–2000, as derived by the model (black line), using ISCCP-D2 cloud data and NCEP/NCAR Reanalysis data. For comparison, the red line shows the ERBE S-10N (WFOV NF edition 2) non-scanner measurements for the same zone and for the period 1985– 1999.
4 OLR anomaly time-series
Figure 3 (black line) shows the time-series of the anomaly of the mean monthly longwave outgoing flux at the top of the atmosphere with respect to the 1985–19893average monthly fluxes (from which the average seasonal cycle has been re-moved), for the tropical region (between 20◦N and 20◦S) and for the period 1984–2000 for which ISCCP-D2 data are available. For comparison we have overlaid on the same di-agram the tropical mean anomaly shown by the ERBE S-10N (WFOV NF edition 2) non-scanner data (red line). The agreement between the two time-series is remarkable. Lin-ear regression between the model and satellite data yielded a correlation coefficient of R=0.84. Both time-series dis-play very similar inter-annual variability. They both show a broad maximum in 1987, concurrent with the 1986/1987 El Ni˜no event, followed by a minimum in 1990, correspond-ing to the 1989/1990 La Ni˜na. A strong peak appears in 1998, corresponding to the El Ni˜no of 1997/1998. The long-term behavior of the two time-series is also quite similar. They both show a decadal increase, but of different magni-tude. The model calculated OLR time-series yields a for-mal decadal increase of 1.9±0.2 Wm−2for the period 1984– 2000, while the ERBS time-series gives a formal decadal in-crease of 3.5±0.3 Wm−2, which is in broad agreement with the Wielicki et al. (2002a) result4. Therefore, although the
3In agreement with the choice of Wielicki et al. (2002) for the
reference period used for the construction of the anomaly time se-ries.
4The decadal increase found here for the ERBS dataset is in
1422 D. Hatzidimitriou et al.: Decadal increase in the tropical mean outgoing longwave radiation (1984–2000)
(a)
(b)
(c)
Fig. 4. (a) Time-series of the tropical mean high-level cloudiness
anomaly (absolute percent) for the period 1984–2000. (b) Time-series of the anomaly of the high-level cloud top pressure (mbar) for the period 1984–2000. A significant peak is observed following the Pinatubo eruption (June 1991). (c) Time-series of the anomaly of the high-level cloud emissivity for the period 1984–2000. A signif-icant peak is observed following the Pinatubo eruption (June 1991).
et al. (2002b) revised their estimate to 2.8 Wm−2by introducing a correction to the ERBS data. This new estimate is still significantly
model calculated fluxes show excellent agreement with the ERBS data as far as short-term inter-annual variability is con-cerned, the long term positive trend of the model OLR is lower than the ERBS (or the Wielicki et al., 2002a) value.
5 Climatological data anomaly time-series
We have explored the long-term variability behaviour of all of the main climatological parameters used as input to our model (described in Sect. 2) and attempted to determine which of these parameters contribute significantly to the ob-served OLR trend (as calculated by our model), for the pe-riod 1984–2000. The methodology used is simple: we con-structed the anomaly time-series for each input parameter, in exactly the same way as the OLR anomaly time-series was constructed. Whenever a statistically significant decadal de-crease or inde-crease was observed, we introduced this change for the particular parameter in the model, recalculated the OLR at TOA, and derived the induced change (in Wm−2). Table 1 summarizes the results of this analysis. Column 1 gives the list of input parameters, column 2 gives the actual decadal increase, or decrease, found, along with the statis-tical error, and column 3 the induced change in the OLR at TOA. In the following paragraphs we discuss the results separately for (i) the cloud parameters, (ii) the atmospheric temperature profile and (iii) precipitable water in different atmospheric layers. It should be emphasized here that the individual radiative forcings of the different changes that ap-pear in the following paragraphs and in Table 1 should not be added in a simple fashion, as the climate system is highly non-linear. They only provide a means of ranking the various factors causing the observed variability of the OLR at TOA. 5.1 Cloud properties
High-level clouds: A uniform long-term decrease of high-level cloudiness seems to have occurred over the tropics (from 20◦S to 20◦N) during the period 1984–2000, at least according to the ISCCP-D record, which is used in the present study. According to the anomaly time-series shown in Fig. 4a, the high-level cloud amount decreased signifi-cantly, at a rate of about −10.1±0.5%5 (relative, not ab-solute, decrease) per decade, resulting in an increase of the OLR at TOA of about 1.5 Wm−2(Table 1).
Anomaly time-series for the high-level cloud top pressure and emissivity have also been constructed (Figs. 4b and c). The high-level cloud top pressure shows no overall signifi-cant decrease, or increase in the period studied. However, it did increase significantly, by about 50 mbar, in mid-1991 (after the Pinatubo eruption) and returned to the pre-Pinatubo
higher than the model calculated increase, found here.
5Percent difference is with respect to the 17-year
aver-age, i.e. (calculated percent difference)=100*(cloud cover decadal change)/(mean cloud cover over 17 year period).
Table 1.
Parameter Decadal trend Outgoing longwave radiative forcing at TOA (Wm−2) Low-level cloud amount −6.5±0.4%∗ 0.23↑
Mid-level cloud amount 1.6±0.4%∗ 0.1↓ High-level cloud amount −10.1±0.5%∗ 1.5±0.1↑ Low-level cloud top pressure −1.8±0.2%∗ 0.34↓ Atmospheric temperature at 50 hP (K) −0.9±0.2 K 0.2↓ Precipitable water 500–300 hP (g cm−2) −3.1±0.6%∗ 0.53↑
∗Relative change
values by the end of 1992 (Fig. 4b). At the same time, the high-level cloud emissivity increased by about 30% (relative increase), returning to the pre-Pinatubo average by the end of 1992 (Fig. 4c). No significant overall trend was observed. The peak in high-level cloud top pressure and the peak in cloud emissivity introduce OLR changes of opposite sign, which almost cancel out. This explains why the OLR shows no similarly strong peak around 1992 (Fig. 3).
Mid-level clouds: Contrary to the high and low-level cloudiness which appear to have decreased over the past cou-ple of decades, according to the ISCCP record, mid-level cloud amount shows a small decadal increase of 1.6±0.4% (relative increase). This increase by itself would cause a small decrease of the OLF at TOA (of about 0.1 Wm−2). Mid-level cloud top pressure and emissivity show no signifi-cant long-term change.
Low-level clouds: Low-level cloud amount decreased dur-ing the period 1984–2000, at a rate of about −6.5±0.4%5 (relative decrease) per decade, which would result (by it-self) in an increase of the OLR at TOA of about 0.2 Wm−2 per decade (Table 1). At the same time there has been a decadal decrease of the low-level cloud top pressure by about −1.8±0.2% (relative decrease), which would intro-duce a small decadal decrease of the OLF at TOA, of about
−0.3 Wm−2/decade , which almost cancels out the effect of the decrease in level cloudiness. So, on the whole, low-level clouds seem to have almost a zero contribution in the observed OLF trend.
The overall trend in OLR introduced directly by changes in all cloud properties together is about 70% of the overall trend in the model calculated OLR and it is mainly due to the high-level cloud cover decrease. Wang et al. (2002) suggested that part of the observed trend in the OLR could be attributed to reduced mean cloud opacity. However, we have found no significant trend in cloud emissivity that could contribute to the overall trend in OLR, at least according to the ISCCP record.
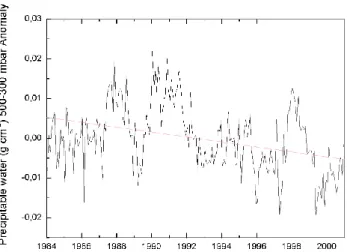
Fig. 5. Time-series of the upper tropospheric water vapour (500–
300 mbar) anomaly for the period 1984–2000.
5.2 Precipitable water
NCEP/NCAR water profiles are only available up to 300 mbar. Time-series of precipitable water in three lay-ers (surface to 700 mbar, 700–500 mbar and above 500 mbar) were constructed. A non-monotonic decrease of precipitable water in the upper troposphere (above 500 mbar), amounting to −3.1±0.6% per decade, is exhibited by the NCEP/NCAR data (Fig. 5). This trend introduces (by itself) an increase of the OLR at TOA of 0.53 Wm−2/decade. However, it must be noted here that this drying of the upper troposphere, which is also found in TOVS statistical retrievals (Schroeder and McGuirk, 1998), is not supported by either microwave or TOVS-physical retrievals (Soden and Schroeder, 2000). Bates and Jackson (2001), based on 20-year HIRS data, ac-tually find a positive trend for the upper tropospheric water vapor in the deep tropics, definitely not shown by the NCEP data used here. It is clear, therefore, that estimated trends in upper tropospheric humidity remain ambiguous.
Another important issue is atmospheric humidity above 300 mbar. In our model calculation, we assumed a fixed value of the specific humidity at 50 mbar, as explained in
1424 D. Hatzidimitriou et al.: Decadal increase in the tropical mean outgoing longwave radiation (1984–2000)
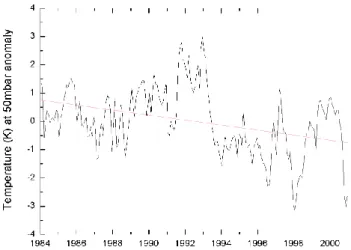
Fig. 6. Time-series of the atmospheric temperature anomaly at
50 mbar for the period 1984–2000.
Sect. 2. It is possible that the fact that we find a much lower decadal increase of the OLR at TOA than shown by the ERBS data, could be due to this assumption. If there was a decrease, for example, of 10% per decade, for the specific humidity at 50 mbar (see e.g. IPCC, 2001; Kley et al., 2000), this would – by itself – cause an increase of the OLR at TOA of about 0.25 Wm−2per decade.
5.3 Atmospheric temperature profiles
Time-series of the atmospheric temperature (from NCEP/NCAR reanalysis) at various atmospheric levels were constructed. No significant decadal trends were found for the air temperature at any atmospheric level (see also Kistler et al., 2001), other than in the lower stratosphere where there appears to be a decadal decrease of 0.9±0.2 K/decade (Fig. 6). This decrease is non-monotonic, caused by a drop of about 1.3 K around 1993. Note that IPCC 2001 gives a decrease for the period 1979–2000 ranging from 0.3–0.7 K/decade. The effect on the OLR at TOA of this (0.9 K/decade) trend is of the order of
−0.23 Wm−2. The skin temperature shows a small increase of 0.10±0.03 K/decade. This however has a very minor effect on the OLF trend (of less than 0.1 Wm−2).
6 Conclusions
To summarize, our model calculations, which are based on ISCCP-D2 cloud climatologies, and temperature and hu-midity profile information from NCEP/NCAR reanalysis show that there has been an increase of OLR at TOA of 1.9±0.2 Wm−2/decade between 1984–2000. This decrease is lower than the decrease displayed by the ERBE S-10N (WFOV NF edition 2) non-scanner OLR time-series, or by the results of Wielicki et al. (2002a, b). Analysis of the inter-annual and long-term variability of the various parameters
determining the OLR at TOA, showed that the most impor-tant contribution to the observed trend comes from a decrease in high-level cloud cover over the period 1984–2000, fol-lowed by an apparent drying of the upper troposphere and a decrease of low-level cloudiness. Opposite but small trends are introduced by a decrease in low-level cloud top pressure, an apparent cooling of the lower stratosphere (at the 50 mbar level) and a small decadal increase in mid-level cloud cover.
Acknowledgements. This research was funded by the European
Commission (contract: EVK2-CT-2000-00055) under the The-matic Programme: Preserving the Ecosystem; Key Action 2: Global Change, Climate and Biodiversity. The ISCCP-D2 data were obtained from the NASA Langley Research Center (LaRC) Atmospheric Sciences Data Center (ASDC). The NCEP/NCAR Global Reanalysis Project data were obtained from the National Oceanic and Atmospheric Administration (NOAA) Cooperative Institute for Research in Environmental Sciences (CIRES) Climate Diagnostics Center, Boulder, Colorado, USA.
Edited by: Q. Fu
References
Allan, R. P. and Slingo, A.: Can current climate model forcings explain the spatial and temporal signatures of decadal OLR vari-ations?, Geophys. Res. Lett., 29, 45-1–45-4, 2002.
Bates, J. J. and Jackson, D. L.: Trends in upper tropospheric humid-ity, Geophys. Res. Lett, 28, 1695–1698, 2001.
Chen, J., Carlson, B. E., Del Genio, A. D.: Evidence for Strength-ening of the Tropical General Circulation in the 1990s, Science, 295, 838–841, 2002.
Chen, T., Zhang, Y., Rossow, W. B.: Sensitivity of atmospheric radiative heating profiles to variations of cloud layer overlap, J. Clim., 13, pp. 2941–2959, 2000.
Hatzianastassiou, N. and Vardavas, I.: Longwave radiation bud-get of the Southern Hemisphere using ISCCP C2 climatological data, J. Geophys. Res., 106, 17 785–17 798, 2001.
Hatzianastassiou, N., Croke, B., Kortsalioudakis, N., Vardavas, I., and Koutoulaki, K.: A model for the longwave radiation budget of the NH: Comparison with Earth Radiation Budget Experiment data, J. Geophys. Res., 104, 9489–9500, 1999.
IPCC, 2001: Climate Change: The scientific Basis, Contribution of Working Group I to the Third Assessment Report of the In-tergovernmental Panel on Climate Change, edited by Houghton, J. T., Ding, Y., Griggs, D. J., Noguer, M., van der Linden, P. J., Dai, X., Maskell, K., and Johnson, C. A., Cambridge University Press, Cambridge, United Kingdom and New York, NY, USA, 2001.
Jacobowitz, H., Stowe, L. L., Ohring, G., Heidinger, A., Knapp, K., and Nalli, N. R.: The Advanced Very High Resolution Ra-diometer Pathfinder Atmosphere (PATMOS) Climate Dataset: A resource for Climate Research, Bull. Am. Meteor. Soc., 84, 785– 793, 2003.
Kistler, R., Kalnay, E., Collins, W., Saha, S., White, G., Woollen, J., Chelliah, M., Ebisuzaki, W., Kanamitsu, M., Kousky, V., van den Dool, H., Jenne, R., and Fiorino, M.: The NCEP-NCAR 50-Year Reanalysis: Monthly Means CD-ROM and Documentation, Bull. Am. Meteor. Soc., 82, 247–268, 2001.
Kley, D., Russell, J. M., and Phillips, C. (Eds.): SPARC Assessment of the upper tropospheric and stratospheric water vapour, WCRP-No. 113, WMO/TD-WCRP-No. 1043, SPARC Report WCRP-No. 2., 2000. Pavlakis, K., Hatzidimitriou, D., Matsoukas, C., Drakakis, E.,
Hatzianastassiou, N., and Vardavas, I.: Ten-year global distri-bution of downwelling longwave radiation, Atmos. Chem. Phys., 4, 127–142, 2004, SRef-ID: 1680-7324/acp/2004-4-127. Rossow, W. B. and Schiffer, R. A.: Advances in understanding
clouds from ISCCP, Bull. Am. Meteor. Soc., 80, 2261–2288, 1999.
Schroeder, S. R. and McGuirk, J. P.: Widespread tropical atmo-spheric drying from 1979 to 1995, Geophys. Res. Lett, 25, 1301– 1304, 1998.
Soden, B. J. and Schroeder, S. R.: Decadal variations in tropical wa-ter vapor, a comparison of observations and a model simulation, J. Climate, 13, 3337–3341, 2000.
Trenberth, K. E.: Changes in Tropical Clouds and Radiation, Sci-ence, 296, 2095, 2002.
Vardavas, I. and Carver, J. H.: Solar and terrestrial parameteri-zations for radiative convective models, Planet. Space Sci., 32, 1307–1325, 1984.
Wang, P. H., Minnis, P., Wielicki, B. A., Wong, T., and Vann, L. B.: Satellite observations of long-term changes in tropical cloud and outgoing longwave radiation from 1985 to 1998, Geophys. Res. Lett., 29, 37-1–37-4, 2002.
Wielicki, B. A., Wong, T., Allan, R. P., Slingo, A., Kiehl, J. T., Soden, B. J., Gordon, C. T., Miller, A. J., Yang, S., Randall, D. A., Robertson, F., Susskind, J., and Jacobowitz, H.: Evidence for large decadal variability in the tropical mean radiative energy budget, Science, 295, 841–844, 2002a.
Wielicki, B. A., Del Genio, A. D., Wong, T., Chen, J., Carlson, B. A., Allan, R. P., Robertson, F., Jacobowitz, H., Slingo, A., Randall, D. A., Kiehl, J. T., Soden, B. J., Gordon, C. T., Miller, A. J., Yang, S., and Susskind, J.: Changes in Tropical Clouds and Radiation, Response, Science, 296, 2095a, 2002b.