HAL Id: hal-02429312
https://hal.archives-ouvertes.fr/hal-02429312
Submitted on 21 Aug 2020
HAL is a multi-disciplinary open access
archive for the deposit and dissemination of
sci-entific research documents, whether they are
pub-lished or not. The documents may come from
teaching and research institutions in France or
abroad, or from public or private research centers.
L’archive ouverte pluridisciplinaire HAL, est
destinée au dépôt et à la diffusion de documents
scientifiques de niveau recherche, publiés ou non,
émanant des établissements d’enseignement et de
recherche français ou étrangers, des laboratoires
publics ou privés.
Distributed under a Creative Commons Attribution - NoDerivatives| 4.0 International
License
weathering – Constraints by temperature and soil water
content
G. Romero-Mujalli, J. Hartmann, J. Börker, J. Gaillardet, D. Calmels
To cite this version:
G. Romero-Mujalli, J. Hartmann, J. Börker, J. Gaillardet, D. Calmels. Ecosystem controlled
soil-rock pCO2 and carbonate weathering – Constraints by temperature and soil water content. Chemical
Geology, Elsevier, 2019, 527, pp.118634. �10.1016/j.chemgeo.2018.01.030�. �hal-02429312�
Institute for Geology, Department of Earth Science, Center for Earth System Research and Sustainability (CEN), Universität Hamburg, Bundesstraße 55, 20146 Hamburg, Germany
bInstitut de Physique du Globe de Paris, Sorbonne Paris Cité, CNRS and Institut Universitaire de France, Paris, France cUniversité Paris-Sud, Laboratoire GEOPS, UMR 8148 – CNRS, Orsay F-91405, France
A R T I C L E I N F O
Keywords:Hydrogeochemistry Soil carbon dioxide Carbonate weathering Inverse calculation
A B S T R A C T
Carbonate dissolution in soil-groundwater systems depends dominantly on pH, temperature and the saturation state of the solution with respect to abundant minerals. The pH of the solution is, in general, controlled by partial pressure of CO2(pCO2) produced by ecosystem respiration, which is controlled by temperature and water
availability. In order to better understand the control of land temperature on carbonate weathering, a database of published spring water hydrogeochemistry was built and analysed. Assuming that spring water is in equili-brium with the soil-water-rock-atmosphere, the soil pCO2can be back-calculated. Based on a database of spring
water chemistry, the average soil-rock CO2was calculated by an inverse model framework and a strong
re-lationship with temperature was observed. The identified rere-lationship suggests a temperature control on car-bonate weathering as a result of variations in soil-rock pCO2, which is itself controlled by ecosystem respiration
processes. The findings are relevant for global scale analysis of carbonate weathering and carbon fluxes to the ocean, because concentration of weathering products from the soil-rock-system into the river system in humid, high temperature regions, are suggested to be larger than in low temperature regions. Furthermore, results suggest that, in specific spring samples, the hydrochemical evolution of rain water percolating through the soil-rock complex can best be described by an open system with pCO2controlled by the ecosystem. Abundance of
evaporites and pyrite sources influence significantly the chemistry of spring water and corrections must be taken into account in order to implement the inverse model framework presented in this study. Annual surface tem-perature and soil water content were identified as suitable variables to develop the parameterization of soil-rock
pCO2, mechanistically consistent with soil respiration rate findings.
1. Introduction
The production of carbon dioxide (CO2) in soils depends mostly on microbial activity and root respiration which in turn are dependent on temperature and soil water content, parameters representing climate variability (Amundson and Davidson, 1990; Kuzyakov, 2006; Lellei-Kovács et al., 2016;Mielnick and Dugas, 2000). Soil respiration is a major component in the carbon cycle and is considered to be one of the largest biological CO2fluxes from land to the atmosphere (Raich and
Potter, 1995). Nevertheless, soil CO2 when dissolved in water, re-presents the major hydronium ion supply in the weathering system, and it is consumed through weathering reactions (Berner et al., 1983;
Calmels et al., 2014;Walker et al., 1981).
Quantifying the weathering fluxes from land to the coastal zone is of interest to understand the atmospheric/soil CO2consumption potential
through chemical weathering. Several authors have tried to constrain these fluxes studying the chemistry of large rivers (Gaillardet et al., 1999), using phenomenological models to determine global weathering fluxes for different types of lithological classes (Bluth and Kump, 1994;
Goll et al., 2014;Hartmann, 2009;Hartmann et al., 2009;Hartmann et al., 2014;Suchet and Probst, 1993), or applying mechanistic models based on kinetic equations and hydrology to quantify the weathering fluxes from soil-rock system to the rivers (Beaulieu et al., 2012;
Goddéris et al., 2013; Goddéris et al., 2006; Roelandt et al., 2010). Nevertheless, the mechanistic models require as an important input the soil partial pressure of CO2(pCO2), which controls the saturation state with respect to minerals and therefore the amount of minerals that can be dissolved.
The weathering of carbonate rocks is a dynamic process and var-iations on timescales of hours are documented, as well as fast
https://doi.org/10.1016/j.chemgeo.2018.01.030
Received 5 January 2017; Received in revised form 27 October 2017; Accepted 26 January 2018
⁎Corresponding author.
E-mail address:[email protected](G. Romero-Mujalli).
Available online 31 January 2018
0009-2541/ © 2018 The Authors. Published by Elsevier B.V. This is an open access article under the CC BY-NC-ND license (http://creativecommons.org/licenses/by-nc-nd/4.0/).
precipitation, mainly dependent on the concentration of CO2 in the aqueous system (Calmels et al., 2014; Pu et al., 2013;Roland et al., 2013; Serrano-Ortiz et al., 2010). The fast calcite dissolution implies that equilibrium is easily reached with respect to a given pCO2 (Dreybrodt et al., 1996; Reddy et al., 1981) without expecting fast calcite precipitation due CO2degassing in the spring water (Szramek
and Walter, 2004). As a consequence, the alkalinity in spring water presents the spatio-temporal variation of CO2of its catchment source system (Calmels et al., 2014;Yoshimura et al., 2001). In that way, the concentration of chemical species resulting from carbonate weathering might be a good parameter to forecast the soil pCO2in a soil-carbonate rock-system.
There are, at least theoretically, two extreme models to describe carbonate dissolution. The “open system” corresponds to an infinite CO2 reservoir that equilibrates with the dissolving solution (or sus-tained supply of CO2). The “closed system” corresponds to the case where a given initial amount of CO2equilibrates with the solution and no further supply is provided. In both cases, CO2is consumed through the weathering reaction according to the chemical equations of the carbonate system until saturation with respect to calcite is reached. Although both cases should exist in reality, the soil-carbonate rock weathering system more likely operates as an open system because (i) an ongoing flux of CO2, due to the ecosystem respiration and microbial activity, might be expected and (ii) the dissolution of calcium carbonate rocks is a relatively fast process.
The aim of this study is to back-calculate the soil-rock pCO2based on equilibrium equations and considering open and closed conditions for carbonate dominated lithologies, using spring water chemistry. In addition, a framework to retrieve a generalized soil-rock pCO2function for carbonate rock dominated areas based on land properties sensitive to climate variability is presented.
2. Methodology
2.1. Spring water chemistry and data filtering
A spring database for carbonate lithologies was constructed based on publications where carbonates rocks are considered an important lithological class in the catchment and information of the chemistry of the water was available (Fig. 1). The database is composed of 671 data points from 26 different publications and sampling locations are located approximately between latitudes 20° and 60° N. For each sample point an estimate of the coordinates was determined. δ13C data, when re-ported, was included in the database (Supplement information) because it can be used to determine the source of CO2, degassing processes and
to identify the influence of redox processes.
Some studies reported water chemistry data from hot or cold springs where CO2 from deep sources and hydrothermal processes is likely (Chiodini et al., 1999;Herman and Lorah, 1987;Kohfahl et al., 2008;
Yoshimura et al., 2004;Yoshimura et al., 2001). In this case, the pCO2 in the soil-rock system is not representative of the soil CO2produced by the ecosystems. Therefore, filtering of data is needed in order to select samples with ideal conditions characteristic of the interactions between the Ca-carbonate rock, water and the ecosystem. In addition, sulfide oxidation and gypsum dissolution may change the alkalinity of the solution interacting with carbonate. If silicates are present in the catchment, they may add excess alkalinity. In order to minimize the influence of evaporites, sulfide oxidation processes or hydrothermal processes the following filtering criteria were applied:
(i) ([Ca2+] + [Mg2+])/alkalinity molar ratio < 0.9, in order to dis-card the extreme values shown inFig. 2a, where these cations may be related to a source other than carbonate minerals by soil CO2. (ii) [Ca2+]/[SO
42−] molar ratio should be >10 (Fig. 2b), to discard samples affected by sulfide oxidation and sulfate mineral dissolu-tion.
(iii) [Ca2+]/[Na+] molar ratios should be >12, in order to minimize the effect silicate weathering (Fig. 2c), based onGaillardet et al. (1999)relations and data analysis reported therein.
(iv) [Ca2+]/[Mg2+] molar ratio should be larger than 1, to minimize contribution of other carbonate minerals than calcite and silicate minerals (Fig. 2d), and to be able to apply equilibrium equations for calcite dissolution system.
(v) The charge balance error (CBE) should be <10%, to exclude points with high uncertainty associated to the reported water chemistry data. CBE was calculated by the following equation:
= + = = = = CBE Ce Ce Ce Ce 100 p n p mj j p n p mj j 1 1 1 1 (1)
where Cepand Cejrepresent the concentration in equivalent of cation p and anion j, respectively. A more rigorous condition for CBE was not necessary to apply because the deviation due seasonality is larger.
Correction for rain water was not possible due to lack of information on the chemistry of rainwater at each sample site but given the low pH of rainwater, the input of alkalinity by rain water is negligible. Seasonality was not considered due to limitation on the dataset and because the applied data for land temperature and soil water content implemented was based on year average. The chemistry of the selected spring samples (164 in total) is dominated by [Ca2+] and alkalinity, an important condition to apply simple equilibrium calculations of the
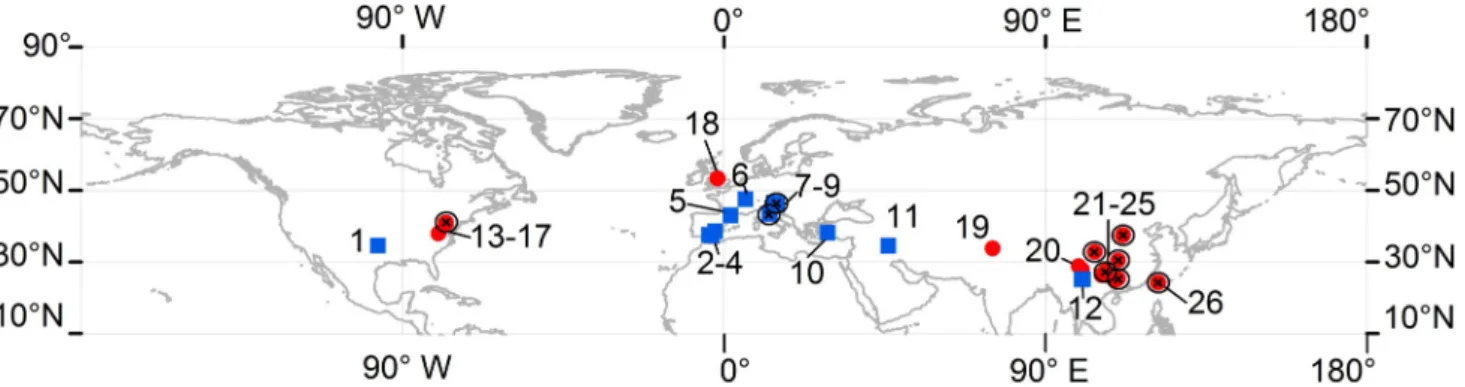
Fig. 1. Global distribution of the spring samples considered in the present study. Blue squares represent publications which fulfil the conditions proposed in the methodology, red circles correspond to publications with no measurements satisfying the conditions, and the black X marks stand for publications where δ13C measurements in water were reported. 1 =Abongwa
and Atekwana (2015). 2 =Lopez-Chicano et al. (2001). 3 =Kohfahl et al. (2008). 4 =Moral et al. (2008). 5 =Dandurand et al. (1982). 6 =Calmels et al. (2014). 7 =Chiodini et al. (1999). 8 =Kanduč et al. (2012). 9 =Szramek et al. (2011). 10 =Özkul et al. (2010). 11 =Karimi et al. (2005). 12 =Huang et al. (2015). 13 =Herman and Lorah (1987). 14 =Jacobson and Langmuir (1970). 15 =Langmuir (1971). 16 =Deines et al. (1974). 17 =Jacobson and Langmuir (1974). 18 =Smith and Wood (2002). 19 =Jeelani et al. (2011). 20 =Pu et al. (2013). 21 =Zhao et al. (2015). 22 =Zaihua et al. (1997). 23 =Yoshimura et al. (2004). 24 =Long et al. (2015). 25 =Qibo et al. (2016). 26 =Yoshimura et al. (2001). (For interpretation of the references to colour in this figure legend, the reader is referred to the web version of this article.)
system CaCO3-H2O-CO2.
2.2. Model description
A numerical code was constructed to calculate the pCO2at equili-brium with spring samples considering the open system calcite-CO2 -water, composed of the following chemical reactions:
+ + H O H O OH 2 2 ( )l 3 ( )aq ( )aq (2) CO2( )g CO2( )aq (3) + + + CO2( )aq 2H O2 ( )l HCO3( )aq H O3 ( )aq (4) + + + HCO3( )aq H O2 ( )l CO3( )2aq H O3 ( )aq (5) + + CaCO3( )s Ca( )2aq CO3( )2aq (6) where CO2(aq)⁎is the sum of species CO2(aq)and H2CO3(aq). The stan-dard equilibrium constants (K) at 25 °C of each chemical equation are reported in Table 1. The temperature dependency of the equilibrium constants and the Henry's constant was calculated using the van't Hoff equation (Eq.(7)), given by:
= ° K K H R T T ln k 1 1 l k l (7)
where T represents the absolute temperature in Kelvin, ΔH° the stan-dard enthalpy of reaction and R the gas constant. Subscripts k and l indicate the different temperatures for each equilibrium constants.
The activity coefficient of each chemical species i (γi) was calculated using Davies Equation (Eq.(8)):
Fig. 2. Molar ratios and relations between chemical species: Graph (a) represents the box-plot of ([Ca2+] + [Mg2+])/alkalinity molar ratio; and graphs (b), (c) and (d) are logarithm
scale-scatterplots for [Ca2+] against [SO
42−], [Na+] and [Mg2+], respectively. F(x) stands for the selection criteria for each corresponding molar ratio and blue squares represent the
samples which fulfil the conditions proposed in the methodology. (For interpretation of the references to colour in this figure legend, the reader is referred to the web version of this article.)
Table 1
Solubility product constants at 25 °C (K) and standard enthalpy (ΔH°) for the reactions considered in this work.
Reaction number Constant (K) ΔHr° (kJ mol−1)
Eq.(2) 10−14 55.9066
Eq.(3) 10−1.468a −19.983
Eq.(4) 10−6.352 9.109
Eq.(5) 10−10.329 14.90
Eq.(6) 10−8.48 −9.61
Thermodynamic data was taken from phreeqc.dat (Parkhurst and Appelo, 1999).
aHenry's constant for dissolution of gas CO 2in water.
= + Az I I I log 1 0.3 i i2 (8) where A is a temperature related constant, ziis the charge of the che-mical species and I is the ionic strength of the solution calculated using major compounds reported for each sample.
This model calculates the pCO2required to produce the alkalinity values reported in each sample at the determined temperature as-suming equilibrium with calcite. Alkalinity is considered to be [HCO3−] + 2[CO32−] + [OH−] − [H+], because no other chemical species with significant contribution to alkalinity were reported in the applied dataset. The construction of this model is based on three as-sumptions: (i) alkalinity values in spring waters dominated by weath-ering of carbonate lithologies depend, mainly, on the soil-rock pCO2; (ii) the system is at equilibrium with calcite (saturation index = 0); and (iii) ionic balance between chemical species [H+], [Ca2+], [OH−], [HCO3−] and [CO32] was considered for all samples.
Furthermore, a closed-system calculation was carried out to de-termine the pCO2required to produce the alkalinity values reported in the spring samples. In this case, the initial dissolved CO2concentration, here as [CO2(aq)]initial, was calculated as the sum of the CO2at equili-brium in the closed system calcite-water-CO2, [CO2(aq)], plus the amount of CO2which reacted with the calcite, which is equivalent to the calcium concentration, [Ca2+
(aq)].
= + +
CO Ca CO
[ 2( )aq initial] [ ( )2aq] [ 2( )aq] (9)
The pCO2at equilibrium with the water (water pCO2) was calcu-lated using PHREEQC software and “phreeqc.dat” database (Parkhurst and Appelo, 1999) and compared with the pCO2estimated applying the inverse method presented in this study.
2.3. Global datasets
The calculated pCO2 was estimated by identifying suitable func-tional relationships using land surface temperature and soil volumetric water content, parameters often used for modelling the soil respiration (Cartwright and Hui, 2014;Epron et al., 1999;Gaumont-Guay et al., 2006;Mielnick and Dugas, 2000). Soil volumetric water content values were taken from the European Space Agency Climate Change Initiative data portal (ESA, http://www.esa-soilmoisture-cci.org/). This data, with a spatial resolution of 0.25°, represents the daily surficial water content of soils (depth < 5 cm) in volumetric units (m3m−3) calculated from the degree of saturation and soil porosity, and was developed by remote sensing methods which correlate the dataset with in-situ mea-surement stations (Dorigo et al., 2015;Liu et al., 2012;Wagner et al., 2012). Mean annual land surface temperature values with a spatial resolution of 1 km2 were extracted from Hijmans et al. (2005). The calculated pCO2was estimated using the annual mean soil volumetric water content (θ) and the global surface temperature by non-linear methods applying the Levenberg-Marquardt algorithm (functional re-lationships are discussed below).
3. Results
The compiled dataset is composed of 671 sample points re-presenting different regions of the world where carbonate rocks dom-inate the catchment. Surface temperature and soil volumetric water content for the 164 selected spring samples range from 0.4 °C to 22.0 °C and from 0.17 m3m−3to 0.37 m3m−3, respectively. Subsequently, 164 sample points were selected based on the filtering method described in
Section 2.1, centered on ideal carbonate dissolution signatures. The selected samples have calcite saturation indices (SI) between −0.4 to 1, with a mean value of 0.2. These samples present a moderate positive linear correlation between alkalinity and surface temperature (r2= 0.45,Fig. 3). This relationship is lost if the data selection is not applied, highlighting the difficulty of predicting and understanding
complex systems, where water chemistry is influenced by anthro-pogenic input and evaporite, sulfide or silicate mineral dissolution.
3.1. Stable carbon isotopes
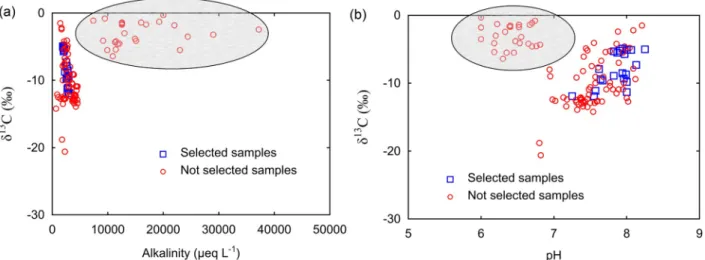
Understanding the behaviour of stable carbon isotopes in spring water samples is useful to obtain information regarding the source of CO2and possible processes occurring in the spring water system. From 671 total spring samples only 118 samples reported δ13C values, ran-ging from −20.6‰ to −0.3‰. Consequently, this variable was not used as imperative criteria for filtering the data. Nevertheless, the re-lationship between δ13C and alkalinity and pH allowed to distinguish at least two different groups (Fig. 4): a first group with relatively low values of δ13C (less than −4‰) and low alkalinity (<8000 μeq L−1) and a second group with elevated values of δ13C (higher than −5‰) and alkalinity values larger than 8000 μeq L−1.
Spring samples with high δ13C and alkalinity may be the result of the dissolution of calcite under the influence of CO2from deep sources, or reaction of calcite with strong acids (Li et al., 2008;Yoshimura et al., 2004; Yoshimura et al., 2001), as implied by a generally lower pH values inFig. 4b. Therefore, the δ13C was used as a minor condition to exclude samples possibly influenced by deep CO2 or hydrothermal processes. The resulting selected spring water samples present a good relationship between δ13C and alkalinity (Fig. 4a), where high values of δ13C are related to the lowest values of alkalinity reported in these spring samples. This may imply that the isotopic composition of soil CO2was controlled by biological respiration and microbial oxidation of organic matter (δ13C approximately −25‰ for C3 plants), and atmo-spheric CO2 (δ13C between −9 and −8‰), as suggested byCerling
et al. (1991)where low respiration rate leads to higher δ13C for soil CO2. Moreover, the high values of δ13C in spring samples also may imply a significant degassing of CO2from the springs before sampling (Deines et al., 1974).
The δ13C of selected spring samples behaves as predicted by models of calcite dissolution under open and closed system conditions if de-gassing is considered (Deines et al., 1974). However, in order to dif-ferentiate between closed and open system conditions the isotopic composition of the initial CO2(soil CO2) has to be known because it represents the initial condition in the calculations.
3.2. Calculated pCO2
The soil-rock pCO2 obtained by applying the inverse method
Fig. 3. Alkalinity against mean annual surface temperature for selected data points based on the conditions explained inSection 2.1. f(x) is the linear function of the correlation represented by the red line. (For interpretation of the references to colour in this figure legend, the reader is referred to the web version of this article.)
(Section 2.2) is different from the spring water pCO2(Fig. 5), calculated with PHREEQC using ‘Phreeqc.dat’ database and the equilibrium method (Parkhurst and Appelo, 1999). Spring water pCO2represents the pCO2at equilibrium with the pH and alkalinity of the spring water at the time the water sample was taken. The soil-rock pCO2considering an open system condition is similar to the spring water pCO2 values (Fig. 5a). Oversaturated samples show higher soil-rock pCO2 values than spring water pCO2, and undersaturated solutions plot on the 1:1 line (Fig. 5a) because the saturation index with respect calcite (SI) is near 0. When a closed system condition is considered, the soil-rock
pCO2values are much higher than the spring water pCO2(Fig. 5b), but again oversaturated samples show on average elevated pCO2values. These differences, based on the calcite saturation index (SI), are the result of considering equilibrium with calcite (SI of 0) in the soil-rock system with the inverse method (see method in Section 2.2). The available δ13C data may imply that degassing of CO
2in spring water is relevant in some cases (see discussion inSection 3.1). If degassing takes place, the calculated equilibrium pCO2for the spring water decreases while increasing the saturation with respect to calcite. However, pre-cipitation of calcite may not occur always immediately because the degassing rate of CO2is significantly higher than the precipitation rate of calcite (Dreybrodt et al., 1996). Hence, the soil-rock pCO2should be calculated applying the inverse method presented in this study
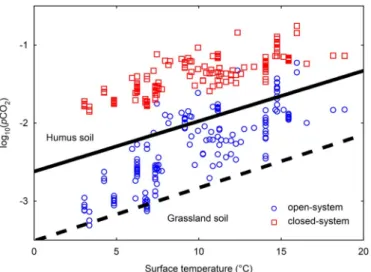
(considering SI = 0) using the chemical composition of spring samples rather than calculating the pCO2at equilibrium with the spring water. The soil-rock pCO2under closed conditions ranges from 0.014 atm to 0.18 atm, and is thus clearly higher than open system conditions which range from 0.00049 atm to 0.059 atm (Fig. 6). The soil-rock pCO2 considering an open system fits in the range proposed byYoshimura et al. (2001)for soil pCO2for average Japanese soils (Fig. 6), unlike the closed system pCO2, which shows even higher values than would be expected for humus soil conditions (Yoshimura et al., 2001). The closed condition presents high values of pCO2at low temperature (near 3 °C); where less soil respiration is expected due to a decrease in biological activity. This implies that the underground production of CO2related to CaCO3-H2O-CO2 system should lead to a partial pressure of approxi-mately 0.01 atm, if a closed system is considered. However, the minimum value of pCO2 calculated considering an open system (0.00049 atm) is close to atmospheric pCO2, which is comparable to results from respiration models (Cerling et al., 1991;Frisia et al., 2011;
Lellei-Kovács et al., 2016;Suseela et al., 2012).
To further investigate the role of controlling variables on the cal-culated soil-rock pCO2, a function (Eq.(10)) depending on temperature and soil volumetric water content (θ), variables commonly used in soil respiration models to explain soil respiration rates (Banerjee et al., 2016; Mielnick and Dugas, 2000), is fitted with the objective to
Fig. 4. Scatterplots for δ13C (‰) against (a) alkalinity (μeq L−1) and (b) pH. Selected spring samples based onSection 2.1are represented by blue squares, red circles stand for the
excluded sample points. The gray region shows samples with significant deep source of CO2. (For interpretation of the references to colour in this figure legend, the reader is referred to
the web version of this article.)
Fig. 5. Relation between calculated pCO2applying the inverse method (Section 2.2) and water pCO2calculated by PHREEQC software (PHREEQC log10pCO2) using ‘Phreeqc.dat’ database
(Parkhurst and Appelo, 1999), for (a) open system condition and, (b) closed system condition. Red line represents the 1:1 relation. (For interpretation of the references to colour in this figure legend, the reader is referred to the web version of this article.)
introduce another dimension on the controls of soil-rock pCO2for open system conditions. The dependency of soil respiration on soil volu-metric water content is commonly represented as a polynomial func-tion, presenting low respiration fluxes for both low and high values of soil volumetric water content. Soil respiration, generally, has maximum rates for soil volumetric water contents between 0.2 and 0.4 m3m−3 (Banerjee et al., 2016;Ilstedt et al., 2000). In addition, temperature controls biological activity and thus influences soil pCO2. Soil respira-tion is often described as being directly proporrespira-tional to temperature (Lellei-Kovács et al., 2016; Lloyd and Taylor, 1994). Therefore, the
function developed to calculate the logarithm of the partial pressure of CO2in the soil (log10pCO2) is represented by the following equation and based on findings fromFig. 7:
= + + +
( )
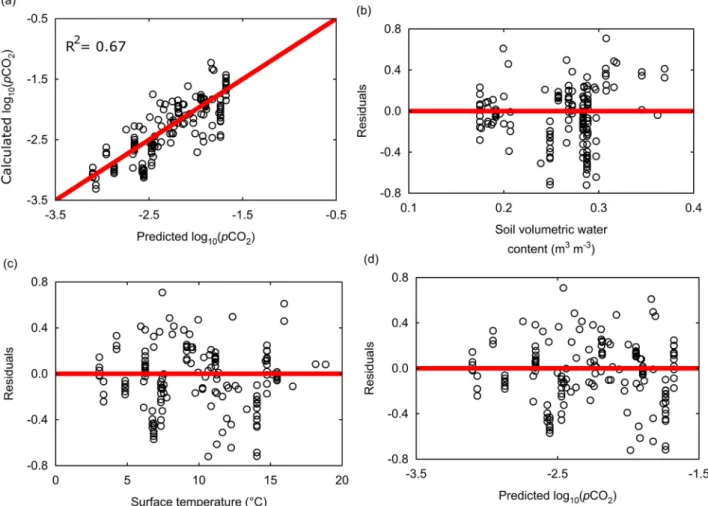
pCO e b e pCO log ( ) log b b T atm 10 2 ( ) 3 10 2 b 1 2 4 (10)where θ represents the mean annual volumetric water content (v/v); T is the mean annual surface temperature in degrees Celsius, log10pCO2atmis the logarithm of partial pressure of CO2in the atmo-sphere (a value of −3.4 was considered in this work); b1, b2, b3and b4 are fitted constants with average values of −3.0 ± 0.7, −0.25 ± 0.04, 0.09 ± 0.03 and −0.34 ± 0.05, respectively. A random distribution of residuals is observed, indicating that the regression is not biased by the distribution of applied variables (Fig. 8). The standard deviation of the function calculated by residuals is ±0.3 (log10pCO2), resulting in an interval of ±0.6 (log10pCO2) for the 90% confidence level of the fitted function. The R2 between calculated soil-rock pCO
2 by the inverse method and the estimated pCO2by the fitted function is 0.67, and thus significantly higher than the linear correlation between alkalinity and surface temperature with r2= 0.45, which does not consider soil vo-lumetric water content.
The lower limit in Eq. (10) is considered to be the pCO2 con-centration in the atmosphere, where soil respiration is low and atmo-spheric CO2 diffuses from the atmosphere into the soil (Dörr and
Münnich, 1980). Furthermore, a maximum threshold for soil pCO2is established based on the spring water chemistry, which may represent the limit of biological activity. However, it is not possible to predict
pCO2at higher land temperatures (>20 °C) due to the absence of data. Therefore, global applications might be limited by the range of tem-perature (3 to 19 °C) and soil volumetric water content (from 0.17 to 0.37 m3m−3) in the applied dataset for the development of the func-tion. The function may also be only applicable for catchments domi-nated by carbonate rocks, until further studies confirm the identified pattern.
Fig. 6. Calculated partial pressure of CO2against temperature with the introduced
in-verse method for open- (blue circles) and closed-system (red squares) conditions at equilibrium with calcite. Solid and dashed black lines are limits for soil pCO2for average
Japanese humus and grassland soils, respectively, taken fromYoshimura et al. (2001). The results for the closed system conditions are located above what would be expected for humus soil conditions. (For interpretation of the references to colour in this figure legend, the reader is referred to the web version of this article.)
Fig. 7. Fitted function representing the soil pCO2(Eq.(10)) depending on mean annual surface temperature (°C) and mean annual volumetric water content (m3m−3). Black points
4. Discussion
This work shows that spring water samples can be used to estimate an average soil-rock pCO2, considering open system conditions. The proposed model-framework can be used to estimate alkalinity fluxes out of the soil-rock system using climate relevant parameters like tem-perature and soil water content, which are forcing factors on soil re-spiration rates and thus CO2production. With this it is possible to link alkalinity exported from a soil-rock system into a river system with climate forcing. This framework can be improved if more data from climate regions are included, for which now a gap exist.
Data selection was an imperative step in order to apply the pre-sented inverse soil-rock pCO2calculation method. For instance, relevant dissolution of evaporite, sulfide and silicate minerals would result into different values as estimated based on an ideal calcium carbonate system with respect to alkalinity concentrations and CO2-consumption. In a system at equilibrium with gypsum, calcite, water and CO2the alkalinity concentrations are approximately 40% lower than in a pure calcite-water-CO2system (Fig. 9), because of the common ion effect, where Ca2+concentration depends on dissolution of both minerals. The presented analysis framework can, however, be enhanced by further relevant processes or above named mineral groups, which influence the alkalinity production, if sufficient constraints can be implemented. But this demands that the sources of sulfate (gypsum versus sulfide) need to be known to account for the different effects of both mineral groups (sulfur isotopes are one measure to achieve this). In addition, δ13C isotope data can be employed to constrain processes like degassing,
contribution of deep CO2sources, or the role of ecosystem composition and its contribution to the CO2-budget.
The spring water chemistry in karst regions may be developed under different system conditions (open, closed and semi-open conditions) and with influence of different CO2sources (Fig. 4). However, results
Fig. 8. Predicted pCO2against calculated pCO2values and residuals plots for the new parameterization of pCO2(Eq.(10)). (a) Calculated pCO2against predicted pCO2values, (b)
residuals against soil volumetric water content, (c) residuals against surface temperature, and (d) residuals against predicted pCO2values. The red line represents the condition in which
residuals are equal to zero. The partial pressures of CO2are expressed as decimal logarithm of atmosphere. Residuals were calculated as: Observed values − Predicted values. (For
interpretation of the references to colour in this figure legend, the reader is referred to the web version of this article.)
Fig. 9. Alkalinity against temperature for calcite-H2O-CO2(blue dash line) and
gypsum-calcite-H2O-CO2(green line) systems at constant log10pCO2value of −2. Results were
obtained using the software PHREEQC with ‘Phreeqc.dat’ database (Parkhurst and Appelo, 1999). (For interpretation of the references to colour in this figure legend, the reader is referred to the web version of this article.)
based on the filtered data suggest a dominance of open system condi-tions (Fig. 6). However, previous studies have found spring water samples from karstic areas which might have developed under semi-open system conditions (Calmels et al., 2014;Geldern et al., 2015).
4.1. Parameterization for estimating soil-rock pCO2
The dissolution of soil-rock CO2into water was considered to be the only hydronium ion contributor for carbonate weathering reactions in the presented analysis framework, without taking into account the contribution of organic acids to the acidification of soils, relevant in organic-rich soils (Thorley et al., 2015). However, soil biological ac-tivity promotes CO2respiration and hence chemical weathering caused by carbonic acid. In addition, in the soil system, without considering organic acids, the rate-determining process of carbonate weathering is the dissolution of CO2in water, which is regulated by the action of the carbonic anhydrase (CA) enzyme in soils (Liu et al., 2005). Further-more, carbonate weathering can be enhanced by reacting with sulfuric acid. This acid may be produced naturally by the oxidation of sulfide minerals, or related to anthropogenic sources (Beaulieu et al., 2011;Li et al., 2008;Torres et al., 2014;Wang et al., 2015).
Temperature and soil volumetric water content are parameters characteristic of climate conditions, because they play an important role in the budgets of land energy and water balance (Seneviratne et al., 2010). Additionally, the increase in the volumetric water content di-rectly affects microbial activity in the soil, while reducing gaseous and liquid diffusion rates and limiting the supply of oxygen and other gases (Banerjee et al., 2016; Blagodatsky and Smith, 2012). On the other hand, lower values of soil volumetric water content limit the growth rate of plants and the biological activity in the soil (Ilstedt et al., 2000). These conditions explain the shape of the estimated soil-rock pCO2by using land surface temperature and soil water content as predictors for open system conditions (Fig. 7), exhibiting a maximum pCO2value in soils with volumetric water content between 0.2 and 0.4 m3m−3. The relatively good correlation of soil-rock pCO2 solely with temperature (Fig. 6) demonstrates that soil-rock pCO2is highly sensitive to climate variability. Thus, it is possible to estimate the soil-rock pCO2only by temperature, when water availability is not a limiting variable, as found bySchwendenmann and Veldkamp (2006)in tropical forests, where the CO2was highly correlated with temperature. The compilation used in this work misses values for low and high water contents and high an-nual land temperatures (higher than 20 °C), and it remains therefore unclear if with new data the pCO2function based on water content and temperature would result in different pCO2values than calculated here. The soil-rock pCO2 calculated in this work is representative of depths where weathering reactions occur in carbonate lithologies, be-cause it was calculated after applying a data filtering in order to exclude
spring samples under the influence of CO2from deep sources and hy-drothermal processes. Therefore, the soil-rock pCO2functions presented in this work represent the pCO2of interest for weathering reactions comparable to other functions such as the one reported byBrook et al. (1983), in which the soil CO2at different depths was correlated with actual annual evapotranspiration (AET) and atmospheric pCO2 (pCO2atm) by the following equation:
= +
pCO pCO atm e
log ( ) log ( ) 2.09(1 AET)
10 2 10 2 0.00172 (11)
As there exist not many approaches to estimate global patterns of soil pCO2, the values derived from this work based on Eq. (10) are compared for a plausibility test with results obtained using the equation presented byBrook et al. (1983). Global data for AET and annual water content was taken from the Global Land Evaporation Amsterdam Model (GLEAMv3.0). This model consists of a set of algorithms that calculate the different components of terrestrial hydrological water cycle based on satellite observations (Martens et al., 2016;Miralles et al., 2011). Results obtained applying Eq.(10)based on this work shows the im-print of temperature and soil water content. For cold regions, low soil
pCO2are predicted while some humid areas close to the equator show highest soil pCO2values (Fig. 10a). Soil pCO2in arid areas are lower than in humid tropical areas due to low water content values. The soil
pCO2map obtained using Eq.(11)afterBrook et al. (1983)with AET as predictor (Fig. 10b) shows a similar spatial pattern as results from Eq.
(10). However, differences are observed in low temperature regions and deserts. TheBrook et al. (1983)function was created comparing mean annual values of actual annual evapotranspiration with soil CO2 mea-sured during the growing seasons. This implies that in low temperature regions Eq.(11)may overestimate the real mean annual values.Frisia et al. (2011)found that soil pCO2from the Grotta di Ernesto region, classified as mesothermic-humid climate, can decrease significantly during the winter season (<5 °C) reaching values close to atmospheric
pCO2. This behaviour is not represented by Eq.(11). Despite the general good agreement in the patterns and ranges of pCO2at the global scale, the formulation of Eq. (10) may be a better approach for para-meterization of the mean annual soil CO2in cold regions, and it can be applied not only to represent mean annual values but to represent seasonal changes, because it will follow temperature changes and water content changes. The simple formulation for a soil pCO2function allows constraining the pCO2 by climate variables without the need of a complex ecosystem model, which has advantages for the study of changes at the global scale over longer time scales for which such a function is representative.
4.2. Global applications
The difference in carbonate rock-soil pCO2is mainly influenced by
Fig. 10. Comparison of global soil pCO2maps using two different equations: (a) this study, using Eq.(10)based on temperature and soil water content for open system conditions, and (b)
Eq.(11)based on actual annual evapotranspiration (Brook et al., 1983). Colour bar shows log10pCO2values. Value ranges of applied data for deriving functions for predicted soil-rock pCO2should limit the application area.Appendix Ashows the areas which have value ranges for land surface temperature and soil volumetric water content within the ranges of the
sistent with complex ecosystem functioning. An implementation into global weathering models would allow to represent ecosystem func-tioning, but would not demand the computational power of in-corporating explicit results from complex ecosystem models.
In this way, it might be possible to improve current phenomen-ological global weathering models in order to consider the soil-rock partial pressure of CO2as an important constraint, because it represents a major source of acidity to the water-soil-rock system and its con-centration depends on climate conditions. In parallel to the im-plementation of the new parameterization for soil-rock pCO2into global weathering models, results should be compared with measurements of CO2in the soil-rock system under a wide range of temperature and soil water content conditions.
5. Conclusions
The chemistry of spring waters in areas dominated by carbonate
Supplementary data to this article can be found online athttps:// doi.org/10.1016/j.chemgeo.2018.01.030.
Acknowledgments
Funding for this work has been provided by German Research Foundation (DFG) through the Cluster of Excellence CLISAP2 (DFG Exec177, Universität Hamburg), and BMBF-project PALMOD (Ref 01LP1506C) through the German Federal Ministry of Education and Research (BMBF) as Research for Sustainability initiative (FONA). The authors thank the two anonymous reviewers and the editor constructive comments. We further thank M.Sc. Felix Amoako Boampong for his help provided during data acquisition.
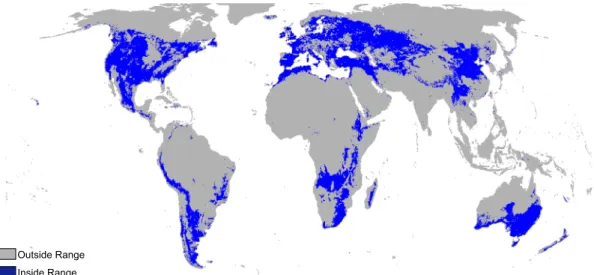
Appendix A. Temperature and soil water content ranges
Fig. A.1. Distribution of areas within the range of land temperature (0.4 to 22.0 °C) and soil water content (0.17 to 0.37 m−3m−3) of the 164 selected spring samples. Blue indicates the
regions with the same range and in gray are the regions with different land temperature or soil water content.
References
Abongwa, P.T., Atekwana, E.A., 2015. Controls on the chemical and isotopic composition of carbonate springs during evolution to saturation with respect to calcite. Chem. Geol. 404, 136–149.
Amundson, R.G., Davidson, E.A., 1990. Carbon dioxide and nitrogenous gases in the soil atmosphere. J. Geochem. Explor. 38 (1), 13–41.
Banerjee, S., Helgason, B., Wang, L., Winsley, T., Ferrari, B.C., Siciliano, S.D., 2016.
Legacy effects of soil moisture on microbial community structure and N2O emissions. Soil Biol. Biochem. 95, 40–50.
Beaulieu, E., Goddéris, Y., Labat, D., Roelandt, C., Calmels, D., Gaillardet, J., 2011. Modeling of water-rock interaction in the Mackenzie basin: competition between sulfuric and carbonic acids. Chem. Geol. 289 (1), 114–123.
Beaulieu, E., Goddéris, Y., Donnadieu, Y., Labat, D., Roelandt, C., 2012. High sensitivity of the continental-weathering carbon dioxide sink to future climate change. Nat. Clim. Chang. 2 (5), 346–349.
and its effect on atmospheric carbon dioxide over the past 100 million years. Am. J. Sci. 283, 641–683.
Blagodatsky, S., Smith, P., 2012. Soil physics meets soil biology: towards better me-chanistic prediction of greenhouse gas emissions from soil. Soil Biol. Biochem. 47, 78–92.
Bluth, G.J., Kump, L.R., 1994. Lithologic and climatologic controls of river chemistry. Geochim. Cosmochim. Acta 58 (10), 2341–2359.
Brook, G.A., Folkoff, M.E., Box, E.O., 1983. A world model of soil carbon dioxide. Earth Surf. Process. Landf. 8 (1), 79–88.
Calmels, D., Gaillardet, J., François, L., 2014. Sensitivity of carbonate weathering to soil CO2 production by biological activity along a temperate climate transect. Chem. Geol. 390, 74–86.
Cartwright, J., Hui, D., 2014. Soil respiration patterns and controls in limestone cedar glades. Plant Soil 389 (1–2), 157–169.
Cerling, T.E., Solomon, D.K., Quade, J., Bowman, J.R., 1991. On the isotopic composition of carbon in soil carbon dioxide. Geochim. Cosmochim. Acta 55 (11), 3403–3405.
Chiodini, G., Frondini, F., Kerrick, D., Rogie, J., Parello, F., Peruzzi, L., Zanzari, A., 1999. Quantification of deep CO 2 fluxes from Central Italy. Examples of carbon balance for regional aquifers and of soil diffuse degassing. Chem. Geol. 159 (1), 205–222.
Dandurand, J., Gout, R., Hoefs, J., Menschel, G., Schott, J., Usdowski, E., 1982. Kinetically controlled variations of major components and carbon and oxygen iso-topes in a calcite-precipitating spring. Chem. Geol. 36 (3–4), 299–315.
Deines, P., Langmuir, D., Harmon, R.S., 1974. Stable carbon isotope ratios and the ex-istence of a gas phase in the evolution of carbonate ground waters. Geochim. Cosmochim. Acta 38 (7), 1147–1164.
Dorigo, W.A., Gruber, A., De Jeu, R.A.M., Wagner, W., Stacke, T., Loew, A., Albergel, C., Brocca, L., Chung, D., Parinussa, R.M., Kidd, R., 2015. Evaluation of the ESA CCI soil moisture product using ground-based observations. Remote Sens. Environ. 162, 380–395.
Dörr, H., Münnich, K.O., 1980. Carbon-14 and carbon-13 in soil CO 2. Radiocarbon 22 (03), 909–918.
Dreybrodt, W., Lauckner, J., Zaihua, L., Svensson, U., Buhmann, D., 1996. The kinetics of the reaction CO2 + H2O → H+ + HCO3− as one of the rate limiting steps for the dissolution of calcite in the system H2O–CO2–CaCO3. Geochim. Cosmochim. Acta 60 (18), 3375–3381.
Epron, D., Farque, L., Lucot, É., Badot, P.-M., 1999. Soil CO2 efflux in a beech forest: dependence on soil temperature and soil water content. Ann. For. Sci. 56 (3), 221–226.
Frisia, S., Fairchild, I.J., Fohlmeister, J., Miorandi, R., Spötl, C., Borsato, A., 2011. Carbon mass-balance modelling and carbon isotope exchange processes in dynamic caves. Geochim. Cosmochim. Acta 75 (2), 380–400.
Gaillardet, J., Dupré, B., Louvat, P., Allegre, C., 1999. Global silicate weathering and CO 2 consumption rates deduced from the chemistry of large rivers. Chem. Geol. 159 (1), 3–30.
Gaumont-Guay, D., Black, T.A., Griffis, T.J., Barr, A.G., Jassal, R.S., Nesic, Z., 2006. Interpreting the dependence of soil respiration on soil temperature and water content in a boreal aspen stand. Agric. For. Meteorol. 140 (1), 220–235.
Geldern, R., Schulte, P., Mader, M., Baier, A., Barth, J.A., 2015. Spatial and temporal variations of pCO2, dissolved inorganic carbon and stable isotopes along a temperate karstic watercourse. Hydrol. Process. 29 (15), 3423–3440.
Goddéris, Y., François, L.M., Probst, A., Schott, J., Moncoulon, D., Labat, D., Viville, D., 2006. Modelling weathering processes at the catchment scale: the WITCH numerical model. Geochim. Cosmochim. Acta 70 (5), 1128–1147.
Goddéris, Y., Brantley, S.L., François, L.M., Schott, J., Pollard, D., Déqué, M., Dury, M., 2013. Rates of consumption of atmospheric CO2through the weathering of loess
during the next 100 yr of climate change. Biogeosciences 10 (1), 135–148.
Goll, D.S., Moosdorf, N., Hartmann, J., Brovkin, V., 2014. Climate-driven changes in chemical weathering and associated phosphorus release since 1850: implications for the land carbon balance. Geophys. Res. Lett. 41 (10), 3553–3558.
Hartmann, J., 2009. Bicarbonate-fluxes and CO2-consumption by chemical weathering on the Japanese Archipelago - application of a multi-lithological model framework. Chem. Geol. 265 (3–4), 237–271.
Hartmann, J., Jansen, N., Durr, H.H., Kempe, S., Kohler, P., 2009. Global CO2-con-sumption by chemical weathering: what is the contribution of highly active weath-ering regions? Glob. Planet. Chang. 69 (4), 185–194.
Hartmann, J., Moosdorf, N., Lauerwald, R., Hinderer, M., West, A.J., 2014. Global che-mical weathering and associated P-release — the role of lithology, temperature and soil properties. Chem. Geol. 363, 145–163.
Herman, J.S., Lorah, M.M., 1987. CO2 outgassing and calcite precipitation in Falling Spring Creek, Virginia, USA. Chem. Geol. 62 (3–4), 251–262.
Hijmans, R.J., Cameron, S.E., Parra, J.L., Jones, P.G., Jarvis, A., 2005. Very high re-solution interpolated climate surfaces for global land areas. Int. J. Climatol. 25 (15), 1965–1978.
Huang, F., Zhang, C., Xie, Y., Li, L., Cao, J., 2015. Inorganic carbon flux and its source in the karst catchment of Maocun, Guilin, China. Environ. Earth Sci. 74 (2), 1079–1089.
Ilstedt, U., Nordgren, A., Malmer, A., 2000. Optimum soil water for soil respiration before and after amendment with glucose in humid tropical acrisols and a boreal mor layer. Soil Biol. Biochem. 32 (11), 1591–1599.
Jacobson, R.L., Langmuir, D., 1970. The chemical history of some spring waters in car-bonate rocks. Ground Water 8 (3), 5–9.
Jacobson, R.L., Langmuir, D., 1974. Controls on the quality variations of some carbonate spring waters. J. Hydrol. 23 (3–4), 247–265.
Jeelani, G., Bhat, N.A., Shivanna, K., Bhat, M., 2011. Geochemical characterization of surface water and spring water in SE Kashmir Valley, western Himalaya: implications to water–rock interaction. J. Earth Syst. Sci. 120 (5), 921–932.
Kanduč, T., Mori, N., Kocman, D., Stibilj, V., Grassa, F., 2012. Hydrogeochemistry of
Alpine springs from North Slovenia: insights from stable isotopes. Chem. Geol. 300-301, 40–54.
Karimi, H., Raeisi, E., Bakalowicz, M., 2005. Characterising the main karst aquifers of the Alvand basin, northwest of Zagros, Iran, by a hydrogeochemical approach. Hydrogeol. J. 13 (5–6), 787–799.
Kohfahl, C., Sprenger, C., Herrera, J.B., Meyer, H., Chacon, F.F., Pekdeger, A., 2008. Recharge sources and hydrogeochemical evolution of groundwater in semiarid and karstic environments: a field study in the Granada Basin (Southern Spain). Appl. Geochem. 23 (4), 846–862.
Kuzyakov, Y., 2006. Sources of CO2 efflux from soil and review of partitioning methods. Soil Biol. Biochem. 38 (3), 425–448.
Langmuir, D., 1971. The geochemistry of some carbonate ground waters in central Pennsylvania. Geochim. Cosmochim. Acta 35 (10), 1023–1045.
Lellei-Kovács, E., Botta-Dukát, Z., de Dato, G., Estiarte, M., Guidolotti, G., Kopittke, G.R., Kovács-Láng, E., Kröel-Dulay, G., Larsen, K.S., Peñuelas, J., Smith, A.R., Sowerby, A., Tietema, A., Schmidt, I.K., 2016. Temperature dependence of soil respiration modulated by thresholds in soil water availability across European shrubland eco-systems. Ecosystems 19 (8), 1460–1477.
Li, S.-L., Calmels, D., Han, G., Gaillardet, J., Liu, C.-Q., 2008. Sulfuric acid as an agent of carbonate weathering constrained by δ13CDIC: examples from Southwest China. Earth Planet. Sci. Lett. 270 (3–4), 189–199.
Liu, Z., Yuan, D., Dreybrodt, W., 2005. Comparative study of dissolution rate-determining mechanisms of limestone and dolomite. Environ. Geol. 49 (2), 274–279.
Liu, Y., Dorigo, W.A., Parinussa, R., de Jeu, R.A., Wagner, W., McCabe, M.F., Evans, J., Van Dijk, A., 2012. Trend-preserving blending of passive and active microwave soil moisture retrievals. Remote Sens. Environ. 123, 280–297.
Lloyd, J., Taylor, J., 1994. On the temperature dependence of soil respiration. Funct. Ecol. 315–323.
Long, X., Sun, Z., Zhou, A., Liu, D., 2015. Hydrogeochemical and isotopic evidence for flow paths of karst waters collected in the Heshang Cave, Central China. J. Earth Sci. 26 (1), 149–156.
Lopez-Chicano, M., Bouamama, M., Vallejos, A., Pulido-Bosch, A., 2001. Factors which determine the hydrogeochemical behaviour of karstic springs. A case study from the Betic Cordilleras, Spain. Appl. Geochem. 16 (9), 1179–1192.
Martens, B., Miralles, D.G., Lievens, H., van der Schalie, R., de Jeu, R.A., Fernández-Prieto, D., Beck, H.E., Dorigo, W.A., Verhoest, N.E., 2016. GLEAM v3: satellite-based land evaporation and root-zone soil moisture. Geosci. Model Dev. Discuss. 1–36.
Mielnick, P., Dugas, W.A., 2000. Soil CO 2 flux in a tallgrass prairie. Soil Biol. Biochem. 32 (2), 221–228.
Miralles, D., Holmes, T., De Jeu, R., Gash, J., Meesters, A., Dolman, A., 2011. Global land-surface evaporation estimated from satellite-based observations. Hydrol. Earth Syst. Sci. 15 (2), 453.
Moral, F., Cruz-Sanjulián, J.J., Olías, M., 2008. Geochemical evolution of groundwater in the carbonate aquifers of Sierra de Segura (Betic Cordillera, southern Spain). J. Hydrol. 360 (1–4), 281–296.
Özkul, M., Gökgöz, A., HorvatinčIć, N., 2010. Depositional properties and geochemistry of Holocene perched springline tufa deposits and associated spring waters: a case study from the Denizli Province, Western Turkey. Geol. Soc. Lond., Spec. Publ. 336 (1), 245–262.
Parkhurst, D.L., Appelo, C., 1999. User's Guide to PHREEQC (Version 2): A Computer Program for Speciation, Batch-reaction, One-dimensional Transport, and Inverse Geochemical Calculations.
Pu, T., He, Y., Zhang, T., Wu, J., Zhu, G., Chang, L., 2013. Isotopic and geochemical evolution of ground and river waters in a karst dominated geological setting: a case study from Lijiang basin, South-Asia monsoon region. Appl. Geochem. 33, 199–212.
Qibo, H., Xiaoqun, Q., Qiyong, Y., Pengyu, L., Jinsong, Z., 2016. Identification of dis-solved sulfate sources and the role of sulfuric acid in carbonate weathering using δ13CDIC and δ34S in karst area, northern China. Environ. Earth Sci. 75 (1).
Raich, J.W., Potter, C.S., 1995. Global patterns of carbon dioxide emissions from soils. Glob. Biogeochem. Cycles 9 (1), 23–36.
Reddy, M.M., Plummer, L.N., Busenberg, E., 1981. Crystal growth of calcite from calcium bicarbonate solutions at constant P CO2 and 25 °C: a test of a calcite dissolution model. Geochim. Cosmochim. Acta 45 (8), 1281–1289.
Roelandt, C., Goddéris, Y., Bonnet, M.P., Sondag, F., 2010. Coupled modeling of bio-spheric and chemical weathering processes at the continental scale. Glob. Biogeochem. Cycles 24 (2) (n/a-n/a).
Roland, M., Serrano-Ortiz, P., Kowalski, A.S., Goddéris, Y., Sánchez-Cañete, E.P., Ciais, P., Domingo, F., Cuezva, S., Sanchez-Moral, S., Longdoz, B., Yakir, D., Van Grieken, R., Schott, J., Cardell, C., Janssens, I.A., 2013. Atmospheric turbulence triggers pro-nounced diel pattern in karst carbonate geochemistry. Biogeosciences 10 (7), 5009–5017.
Schwendenmann, L., Veldkamp, E., 2006. Long-term CO2production from deeply weathered soils of a tropical rain forest: evidence for a potential positive feedback to climate warming. Glob. Chang. Biol. 12 (10), 1878–1893.
Seneviratne, S.I., Corti, T., Davin, E.L., Hirschi, M., Jaeger, E.B., Lehner, I., Orlowsky, B., Teuling, A.J., 2010. Investigating soil moisture–climate interactions in a changing climate: a review. Earth Sci. Rev. 99 (3–4), 125–161.
Serrano-Ortiz, P., Roland, M., Sanchez-Moral, S., Janssens, I.A., Domingo, F., Goddéris, Y., Kowalski, A.S., 2010. Hidden, abiotic CO2 flows and gaseous reservoirs in the terrestrial carbon cycle: review and perspectives. Agric. For. Meteorol. 150 (3), 321–329.
Smith, H., Wood, P., 2002. Flow permanence and macroinvertebrate community varia-bility in limestone spring systems. Hydrobiologia 487 (1), 45–58.
Suchet, P.A., Probst, J.-L., 1993. Modelling of atmospheric CO 2 consumption by chemical weathering of rocks: application to the Garonne, Congo and Amazon basins. Chem. Geol. 107 (3), 205–210.
![Fig. 2. Molar ratios and relations between chemical species: Graph (a) represents the box-plot of ([Ca 2+ ] + [Mg 2+ ])/alkalinity molar ratio; and graphs (b), (c) and (d) are logarithm scale-scatterplots for [Ca 2+ ] against [SO 4 2− ], [Na + ] and [Mg 2+](https://thumb-eu.123doks.com/thumbv2/123doknet/14792225.601931/4.892.66.834.86.677/molar-relations-chemical-species-represents-alkalinity-logarithm-scatterplots.webp)