HAL Id: hal-00298822
https://hal.archives-ouvertes.fr/hal-00298822
Submitted on 23 Mar 2007HAL is a multi-disciplinary open access
archive for the deposit and dissemination of sci-entific research documents, whether they are pub-lished or not. The documents may come from teaching and research institutions in France or abroad, or from public or private research centers.
L’archive ouverte pluridisciplinaire HAL, est destinée au dépôt et à la diffusion de documents scientifiques de niveau recherche, publiés ou non, émanant des établissements d’enseignement et de recherche français ou étrangers, des laboratoires publics ou privés.
A spatially distributed analysis of erosion susceptibility
and sediment yield in a river basin by means of
geomorphic parameters and regression relationships
S. Grauso, G. Fattoruso, C. Crocetti, A. Montanari
To cite this version:
S. Grauso, G. Fattoruso, C. Crocetti, A. Montanari. A spatially distributed analysis of erosion sus-ceptibility and sediment yield in a river basin by means of geomorphic parameters and regression relationships. Hydrology and Earth System Sciences Discussions, European Geosciences Union, 2007, 4 (2), pp.627-654. �hal-00298822�
HESSD
4, 627–654, 2007 A spatially distributed analysis of river sediment yield S. Grauso et al. Title Page Abstract Introduction Conclusions References Tables Figures ◭ ◮ ◭ ◮ Back CloseFull Screen / Esc
Printer-friendly Version Interactive Discussion
Hydrol. Earth Syst. Sci. Discuss., 4, 627–654, 2007 www.hydrol-earth-syst-sci-discuss.net/4/627/2007/ © Author(s) 2007. This work is licensed
under a Creative Commons License.
Hydrology and Earth System Sciences Discussions
Papers published in Hydrology and Earth System Sciences Discussions are under open-access review for the journal Hydrology and Earth System Sciences
A spatially distributed analysis of erosion
susceptibility and sediment yield in a
river basin by means of geomorphic
parameters and regression relationships
S. Grauso1, G. Fattoruso2, C. Crocetti3, and A. Montanari3
1
Dipartimento Ambiente, Cambiamenti Globali e Sviluppo Sostenibile, ENEA Centro Ricerche Casaccia , Roma, Italy
2
Dipartimento Ambiente, Cambiamenti Globali e Sviluppo Sostenibile, ENEA Centro Ricerche Portici (Napoli), Italy
3
Faculty of Engineering, University of Bologna, Italy
Received: 16 March 2007 – Accepted: 16 March 2007 – Published: 23 March 2007 Correspondence to: S. Grauso ([email protected])
HESSD
4, 627–654, 2007 A spatially distributed analysis of river sediment yield S. Grauso et al. Title Page Abstract Introduction Conclusions References Tables Figures ◭ ◮ ◭ ◮ Back CloseFull Screen / Esc
Printer-friendly Version Interactive Discussion
Abstract
In the present work, an application of statistical regression relationships utilising ge-omorphic parameters is attempted in a spatially distributed mode, in order to predict the amount of river sediment supply at varying sections of the drainage network. Sim-ple and multiSim-ple regression relationships utilising drainage density Dd and hierarchical
5
anomaly index ∆a as independent variables were applied to the Calvano watershed (Central Italy) at different degree of subdivision in tributary drainage basins, so as to assess their contribution to the whole watershed sediment yield balance. In the same way, the role of small hill-reservoirs as sediment-trap and that of areas affected by bad-lands and of tributary basins exposure were also investigated. Results were tested
10
on the basis of sedimentation estimates from selected reservoirs. The relationships provided a yearly specific sediment yield (SSY) value for the Calvano stream which is according to the average observed SSY in river basins of central Italy flowing to the Adriatic Sea.
The use of simple statistical relationships, such as those here adopted, can allow
15
to recognise the sections along the main stream which are more critical in terms of sediment accumulation, which, on turn, can cause sudden water discharge increments and dangerous floods. This approach can provide a tool enabling to locate the hydraulic risk and to point out the areas where soil conservation practices or hydraulic works, such as periodic maintenance of riverbeds, are needed in order to reduce soil erosion
20
and sediment accumulation.
1 Introduction
Understanding geodynamical processes like sediment production by water erosion and river sediment transport plays an important role in the fluvial-system management. This is due to the side-effects these processes can produce, such as reduction of soil
pro-25
duction capacity, reservoirs siltation, variations and instability of channel beds and river 628
HESSD
4, 627–654, 2007 A spatially distributed analysis of river sediment yield S. Grauso et al. Title Page Abstract Introduction Conclusions References Tables Figures ◭ ◮ ◭ ◮ Back CloseFull Screen / Esc
Printer-friendly Version Interactive Discussion
banks and so forth. Moreover, sediment moving from slopes to drainage network can be deposited along the streams: this accumulation can cause dangerous overflooding when exceptional water discharge after heavy rainstorms reaches the silted river. To be able to forecast these processes is therefore a binding requirement in land man-agement, which must be satisfied by adopting suitable tools allowing to evaluate the
5
related risk.
When data records are lacking, estimation models have to be utilised. With the aim to predict sediment production and transport, since many years to date, researchers have tried to give an answer by means of different approaches, from empirical to physically based hydraulic models, taking into account different physical laws and parameters.
10
To this aim, Kirkby and Cox (1995) pointed out that hydrologic processes responsible for rill formation seem to be prominent at the detailed scale; while topographic, pedo-logic and vegetation factors begin to prevail at the basin scale, which represents a local planning level; last, factors linked to climate and lithology take relevance at the regional and global scales, which constitute the national and over-national planning
15
level. In addition, another aspect must be taken into account, namely, model suitability in terms of economic costs (balance cost/benefit) and data efficiency. Physical models often reveal to be expensive and very time-consuming when applied on a land planning and management scale. Also empirical models like the Universal Soil Loss Equation (USLE), successfully applied in many parts of the world, can become unpractical, in
20
some circumstances, mainly because of the need to support field surveys aimed to gather soil data (K-factor) over an extended area and the frequent unavailability of com-plete rainfall records allowing to calculate the rain erosivity R-factor.For these reasons, the geomorphic approach, based on simple cartographic data, assumes relevance as useful management tool, since it can meet both the requirements of reliability and ease
25
of employment needed for planning and assessment purposes (Lupia Palmieri, 1983). Since the 1950’s–1960’s up to recent years, several authors have shown the ef-fectiveness of regression relationships which correlate river sediment transport with easily available geomorphological, hydrological and climatic parameters (Anderson,
HESSD
4, 627–654, 2007 A spatially distributed analysis of river sediment yield S. Grauso et al. Title Page Abstract Introduction Conclusions References Tables Figures ◭ ◮ ◭ ◮ Back CloseFull Screen / Esc
Printer-friendly Version Interactive Discussion
1957; Langbein and Schumm, 1958; Fournier, 1960, 1969; Douglas, 1968; Cooke and Doornkamp, 1974; Capozza, 1963; Gazzolo and Bassi, 1961, 1964; Cavazza, 1972; Ciccacci et al., 1977, 1980; Cannarozzo and Ferro, 1985, 1986; Ichim and Radoane, 1987). Another interesting correlation was suggested by Copertino et al. (1977), who hypothesised a link between geomorphic parameters and fluvial hydraulic regime, in
5
order to predict flood events. According to these studies, a causal link would exist be-tween flood self-regulation capacity and network organisation. This capacity will lower with basin area, due to the reduction of the total length and of the frequency of main order streams, which implies the reduction of the average section of riverbeds. Mainly in small catchments, the hydro-meteorological factors alone (runoff coefficient, rainfall,
10
permeability etc.) cannot be enough to represent all the factors involved in the flood formation. Therefore, the Authors also considered other factors, such as those related to basin and drainage network characteristics, which can play a role in determining the flood probability.
In the present work, regression relationships utilising geomorphic parameters are
15
applied within a watershed in a spatially distributed mode, that is, at different degree of subdivision in tributary drainage basins, in order to predict the amount of river sediment supply at varying sections of the drainage network, which can be critical in terms of sediment accumulation along the streams and of related hydraulic risk.
2 Study area
20
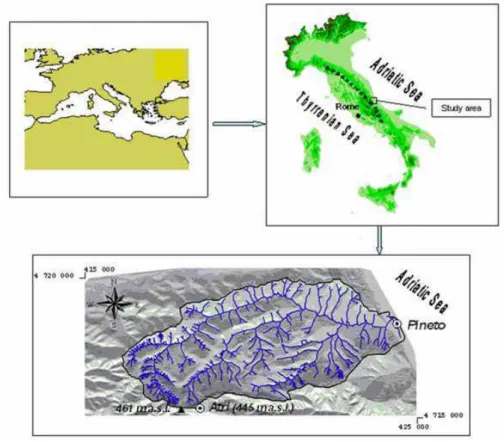
The study refers to the Calvano stream watershed, located in the Abruzzo Region (central-eastern Italy). This area is representative of the typical geomorphological and geohydrologic conditions of the piedmont belt comprised between the turbidite-limestone Appennines ridge and the Adriatic Sea (Fig. 1).
The Calvano stream watershed is cut on pelagic sediments and continental eroded
25
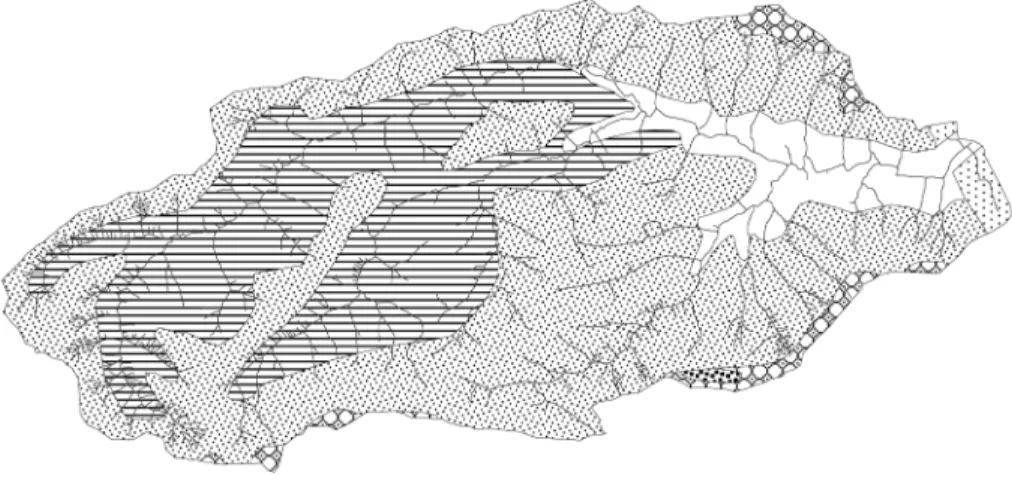
materials of middle Pliocene-lower Pleistocene age (the Mutignano Formation). Clays are prevalent (“Blue Clays”) with intercalated conglomerates and sands (Fig. 2). The
HESSD
4, 627–654, 2007 A spatially distributed analysis of river sediment yield S. Grauso et al. Title Page Abstract Introduction Conclusions References Tables Figures ◭ ◮ ◭ ◮ Back CloseFull Screen / Esc
Printer-friendly Version Interactive Discussion
hilltop deposits form tabular bodies, gently dipping towards ENE, constituted by sands and conglomerates from marine-transitional to continental environment, deposited dur-ing the regional uplift which brought to the total emersion of the area between lower-and middle-Pleistocene. The stratigraphic setting is almost homogeneous in the whole area, which can be described as a wide monocline, 5◦–8◦ dipping and directed about
5
N 180◦. The characteristics of the Calvano stream watershed are common to most of
the river basins in the whole peri-Adriatic belt of Central Italy. The typical morphology is given by hilly ridges and fluvial valleys, almost oriented SW-NE, modelled on sandy-clay terrains and subject to severe erosive processes. In the examined river basin, one main ridge and two secondary sub-parallel ridges are distinguished, dividing the
catch-10
ment area into three belts. Starting from the sea-mouth, the elevations progressively grow from north to south and from east to west up to 461 m a.s.l., at the south-western edge of the basin. The overall morphology and the superficial hydrography are influ-enced by recent tectonics which produced a series of differential uplifted blocks. Three main fault-systems can be recognised (Nisio et al., 1997; Parea and Valloni, 1983):
15
the first, almost directed W-E, strongly controls the main stream course and cuts the secondary fault-systems; the second is directed SW-NE and drives the secondary hy-drographic network, while the third is parallel to the coast-line, directed SE-NW, and influences the minor drainage network.
According to Strahler’s classification, the Calvano stream basin is ranked as 5th
or-20
der. Its fluvial network shows a sub-dendritic pattern, with main tributary watercourses embedded in narrow valleys. The main alluvial plain is very limited in dimensions as it extends few kilometres from the confluence between the two main tributaries (Fosso Reilla and Fosso di Casoli) to the sea-mouth. There are no water discharge nor sedi-ment yield gauging stations along the watercourse. Slopes sharply decrease in
corre-25
spondence of the main stream. The hydrographic network is mostly developed in the hilly most-elevated part of the watershed, where well developed, somewhere spectac-ular, badlands systems (calanchi) occur, prevailingly on south-facing slopes. In this situation, a significant percentage of sediments supplied by the mountain streams is
HESSD
4, 627–654, 2007 A spatially distributed analysis of river sediment yield S. Grauso et al. Title Page Abstract Introduction Conclusions References Tables Figures ◭ ◮ ◭ ◮ Back CloseFull Screen / Esc
Printer-friendly Version Interactive Discussion
expected to be deposited in the main course.
The general hydro-geomorphological setting determines a hydraulic risk for the hu-man settlements down-valley, around the city of Pineto, located on the river mouth. In fact, the area is subject both to floods and slope-instability. The last severe flood occurred in July 1999 when the coastal plain was submerged by waters, with heavy
5
damages to structures, roads, buildings and a high number of evacuees (CNR, 1993). The triggering factor was recognised in the river-bed overflooding due to the huge de-trital supply along the main stream from the secondary channels network, which is determined by the low bedrock permeability, the short catchment length, the high trib-utary slopes steepness and the fine textural dimensions of transported sediments.
10
The climate is Mediterranean-type, with long dry summers and rainfalls concentrated in winter periods (average yearly rainfall: 750 mm). This regime induces prolonged soil aridity and superficial soil cracks, mainly on clay south-facing slopes, which heav-ily affect slope-stability and soil erosion vulnerability. In the same time, the low soil-permeability favours superficial runoff which can produce dangerous floods after heavy
15
rainstorms.
Land-use is characterised by intense urbanisation along the coast and by scattered farms in the inner hilly zone. The hilly area is cultivated, mainly with arables, while olives and vineyards are more limited. The frequent practice of inappropriate cultivation techniques, such as up and down tillage along the slopes, triggers rill/gully erosion and
20
mudflow processes. These processes, on turns, can develop towards more severe erosion forms such as large mass movements and badlands on sandy-clay slopes (Vittorini, 1977; Ballerini et al., 1992). Nowadays, many cultivated fields are going under abandonment and the natural vegetation is beginning to re-colonize the area.
Another characteristic treat of the local landscape is represented by numerous small
25
hill-reservoirs which are spread throughout the area, associated to agricultural activities for irrigation purposes. Their occurrence witnesses the impermeable nature of soils and bedrock and the poor water availability.
HESSD
4, 627–654, 2007 A spatially distributed analysis of river sediment yield S. Grauso et al. Title Page Abstract Introduction Conclusions References Tables Figures ◭ ◮ ◭ ◮ Back CloseFull Screen / Esc
Printer-friendly Version Interactive Discussion
3 Framework of the analysis
3.1 Regression relationships
Ciccacci et al. (1987) investigated the correlation between the yearly specific sediment yield per unit area (SSY) and some geomorphological, hydrological and climatic param-eters from 20 watersheds distributed along the Italian peninsula. On that basis, they
5
developed some multiple regression relationships where the main independent variable was the drainage density Dd, used alone or associated with, respectively, the hierar-chical anomaly index ∆a, the mean annual river discharge Q (m
3
/s), the Fournier’s Climatic Index and a climatic parameter introduced by Ciccacci et al. (1977), given by the total amount of yearly rainfall, P, multiplied by the standard deviation of monthly
10
rainfalls.
Let us denote with Gathe number of 1st order streams necessary to make a drainage network perfectly ordered in a binary tree-shaped structure with streams of order u flowing into streams of order u+1, with N1 the number of 1st order channels actually
occurring in the drainage network and with p the rainfall in the wettest month. Then, the
15
hierarchical anomaly index ∆ais given by the ratio Ga/N1, while the Fournier’s Climatic
Index is given by p2/P.
The regression relationships studied by Ciccacci et al. (1987) showed a high coeffi-cient of determination (the best r2value was 0.96, with drainage density and hierarchi-cal anomaly index as independent variables) and an average percentage error between
20
observed and predicted data of 13–14%. Ciccacci et al. (1987) deemed drainage den-sity Dd as the most significant parameter when estimating SSY, as it can resume in itself the overall climatic, vegetation and geological conditions whose combination re-sults in watershed erodibility potential. Moreover, considering that river transport pro-cesses are influenced by the physical characteristics of watershed as well as by the
25
drainage network topology, a parameter such as hierarchical anomaly index ∆a can account for the drainage network organisation.
HESSD
4, 627–654, 2007 A spatially distributed analysis of river sediment yield S. Grauso et al. Title Page Abstract Introduction Conclusions References Tables Figures ◭ ◮ ◭ ◮ Back CloseFull Screen / Esc
Printer-friendly Version Interactive Discussion
Subsequent statistical analyses have revealed that the correlation between the drainage density and SSY is not always as significant (Cannarozzo and Ferro, 1988; Grauso et al., 20071). However, in any case the role played by the drainage density on the soil erosion susceptibility has relevant implications from a technical point of view. In fact, geomorphic parameters can be estimated from maps or remote sensing
obser-5
vations while river discharge and rainfall data are generally not available for ungauged basins (Sivapalan et al., 2003). Furthermore, relationships with geomorphic parame-ters are recommended to be used when predicting the potential sediment supply from small scale tributary basins. In fact, in these particular cases, river discharge records are generally lacking, and a climatic index, which is currently obtained from a
rain-10
gauge stations network, cannot be defined at a spatial scale fine enough in order to detail the local conditions for small scale river streams. Conversely, the geomorphic parameters can be effectively downscaled on the basis of a detailed representation of the basin elevation.
In the present study, the following logarithmic relations, developed by Ciccacci et
15
al. (1987), which have already been employed in several other studies in Italy (Ciccacci et al., 1988; Battista et al., 1988; Lupia Palmieri et al., 1995; Agnesi et al., 1996; Massaro et al., 1996; Ceci et al., 1998), are utilised:
log SSY = 0.3262Dd + 0.1025∆a + 1.4478 (1a)
r2= 0.96
20
log SSY = 2.7969 log Dd + 0.1399∆a + 1.0595 (1b)
r2= 0.96
log SSY = 0.3371Dd + 1.5239 (2a)
25
r2= 0.96
1
Grauso S., Pagano A., Fattoruso G., De Bonis P., Onori F., Regina P., and Tebano C.: Re-lations between climatic-geomorphological parameters and sediment yield in a Mediterranean semi-arid area (Sicily, southern Italy), Environ. Geol., Sprinter-Verlag ed., under revision, 2007.
HESSD
4, 627–654, 2007 A spatially distributed analysis of river sediment yield S. Grauso et al. Title Page Abstract Introduction Conclusions References Tables Figures ◭ ◮ ◭ ◮ Back CloseFull Screen / Esc
Printer-friendly Version Interactive Discussion
log SSY = 2.9394 log Dd + 1.1343 (2b)
r2= 0.95
The multiple regression (1a) is here applied in most of the 4th and 3rd order tributary basins, while the simple regression (2a) using the Dd alone is utilised when ∆ais equal to zero, mostly in catchments only consisting in 1st order and 2nd order streams. In
5
these conditions, hierarchic anomaly parameters have no significance, considering that anomalies arise when 1st order streams flow into 3rd order and higher or 2nd orders into 4th etc..
In a previous work, Ciccacci et al. (1980) observed that, beyond a certain drainage density value, which they established in 6, SSY does not grow exponentially with the
10
Dd. Therefore, in the cases with drainage density major than 6, the bi-logaritmic rela-tionships are here utilised (1b or 2b), in order to avoid too high estimated SSY values. 3.2 Quantitative geomorphic analysis and river network acquisition
Geomorphic parameters Dd and ∆a were obtained by means of the Quantitative Ge-omorphic Analysis of river network. This methodology allows an objective watershed
15
characterisation and a quantitative comparison among different river basins (Horton, 1945; Strahler, 1957; Avena et al., 1967; Avena and Lupia Palmieri, 1969). The geo-morphic parameters calculation was performed by means of the GIS tool Geomorf 2k5, which is the up-to-date version of Geomorf 2k1 (De Bonis et al., 2002). Geomorf 2k5 is an extension of ESRI ArcView®GIS 3.2a which adds to the user interface a set of tools
20
for computing Strahler’s stream order and other geomorphic parameters via spatial algorithms. It also contains functions for removing several geometric and topological inconsistencies in the river network layer by editing errors (Fattoruso, 2005).
The Geomorf 2k5 input data were the vector drainage network layer, drawn from of-ficial maps, and the vector watershed layers, extracted from a digital elevation model
25
(DEM). The permanent streams (blue-lines) of the drainage network were mapped ac-cording to the 1:25 000 topographic maps of the Italian Military Geographic Institute
HESSD
4, 627–654, 2007 A spatially distributed analysis of river sediment yield S. Grauso et al. Title Page Abstract Introduction Conclusions References Tables Figures ◭ ◮ ◭ ◮ Back CloseFull Screen / Esc
Printer-friendly Version Interactive Discussion
(IGMI). Then they were integrated by additional information derived from other car-tographic sources (Regione Abruzzo, 1982; 1990) at the same detail scale or more (1:25 000–1:10 000), aerial photographs and field observations. Mapping hydrographi-cal data from cartography introduced some geometric and topologihydrographi-cal inconsistencies. They were removed automatically by means of the Geomorf 2k5 editing functionalities.
5
Watersheds limits were extracted from a high resolution (20m) DEM using several GIS algorithms.
3.3 Basin subdivision
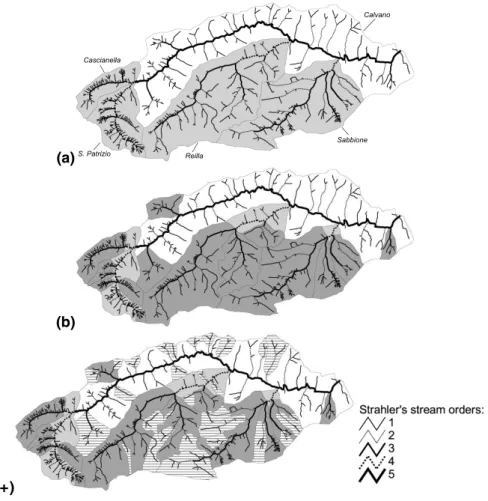
In order to evaluate the spatial distribution of soil erosion and sediment yield poten-tial at different basin sections and morphologies, different subdivisions in minor order
10
tributary basins were adopted (Fig. 3). The first subdivision groups the 4th order “par-tial” catchments (Table 1), to evaluate the gross sediment supply to the Calvano main stream: here, four partial catchments are distinguished (Cascianella, S. Patrizio, Reilla and Sabbione) flowing into the main stream. The remaining main stream valley (5th order) is also treated as partial catchment to investigate its sediment supply potential
15
to the whole basin.
The second subdivision is extended to the 3rd order “sub-catchments”: seventeen sub-catchments can be recognised, within the main stream and the four partial basins (Table 2).
Another subdivision was performed by taking into account the “secondary”
catch-20
ments down to the 1st- and 2nd order, which are drained by small hill-reservoirs (Ta-ble 3), in order to evaluate their role in sediment sequestration to the whole sediment yield balance.
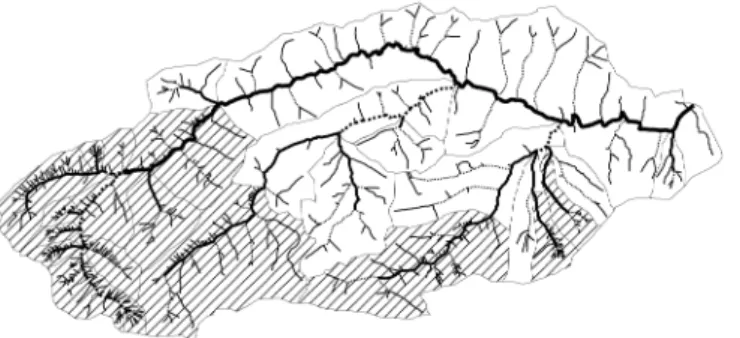
A further distinction was made with regard to secondary catchments affected by badlands (Fig. 4 and Table 4), with the aim to assess the relative significance of such
25
severe erosion forms on the whole basin sediment balance.
HESSD
4, 627–654, 2007 A spatially distributed analysis of river sediment yield S. Grauso et al. Title Page Abstract Introduction Conclusions References Tables Figures ◭ ◮ ◭ ◮ Back CloseFull Screen / Esc
Printer-friendly Version Interactive Discussion
3.4 Test catchments
Four test catchments were selected, with the aim to test the model equations reliabil-ity on the basis of reservoir sedimentation estimates, available from surveys carried out by the local public administration or from personal communications by reservoirs owners and designers. It is well known that to validate the results provided by soil
5
erosion models is not an easy task. Therefore, the availability of several test reservoirs located in a small scale basin makes the Calvano watershed an ideal case study for the methodology herein proposed.
Actually, these estimates of reservoir siltation were derived from soft information about the initial and current storage volume of the reservoirs. Therefore these data
10
are affected by some uncertainty, as a direct measurement was not performed. Never-theless they allow to carry out a meaningful and spatially distributed evaluation of the model performances, as for a catchment which is subjected to a significant soil erosion. Two test reservoirs are located within the Calvano stream watershed. The first, named 20-Pineto, was built in 1959 and is located in the higher part of the Sabbione
15
sub-catchment. Its drainage area is 0.77 km2. The reservoir storage was computed by the local administration in 1974, which estimated a residual storage capacity of 30 000 m3 instead of the initial 35 000 m3. Then, considering the time-interval of 15 years from the construction, an average yearly sedimentation rate of about 333 m3can be inferred, corresponding to a specific sediment supply of 4.33 m3ha−1
year−1
.
20
The second test-reservoir, named 119-Atri, is located at the outlet of a 3rd order main stream tributary with a drainage area of 0.98 km2. It was built in 1970 with an initial storage capacity of 70 000 m3. After 35 years, a sediment volume of about 12 500 m3 was estimated (personal communication by owners), corresponding to a sedimentation rate of 357.14 m3year−1.
25
The other two test-reservoirs, 147-Atri and 141-Atri, are located within two neigh-bouring stream basins (Piomba and Cerrano streams) showing the same geomor-phological characteristics of the Calvano stream watershed. Both reservoirs have a
HESSD
4, 627–654, 2007 A spatially distributed analysis of river sediment yield S. Grauso et al. Title Page Abstract Introduction Conclusions References Tables Figures ◭ ◮ ◭ ◮ Back CloseFull Screen / Esc
Printer-friendly Version Interactive Discussion
drainage area of 0.15 km2. Sedimentation data have outcome from dredging projects aimed to restore the reservoir water capacity. In the first case, a sediment volume of 15 000 m3 was removed after 25 years, corresponding to a sedimentation rate of 600 m3year−1, while, in the second, a volume of 1600 m3was dredged after 22 years,
corresponding to a sedimentation rate of 69.57 m3year−1.
5
4 Results and discussion
Tables from 1 to 4 show the results of sediment yield estimates by means of the equa-tions 1a–1b and 2a–2b. For each catchment, the estimated yearly area-specific sedi-ment yield SSY (Mg km−2 year−1) and yearly total sediment yield SY (Mg year−1) are
reported.
10
The specific sediment yield of the Calvano stream was evaluated in 792.50 Mg km−2
year−1, which is very close to the average observed SSY in river basins of central Italy
flowing to the Adriatic Sea. More likely, this value would appear underestimated, if one considers the dominant high-erodible sandy-clay composition of bedrock in the Calvano stream watershed. In fact, in the same Adriatic sector, SSY values up to 1600 Mg km−2
15
year−1and more can be observed in long-period records of river basins where clay
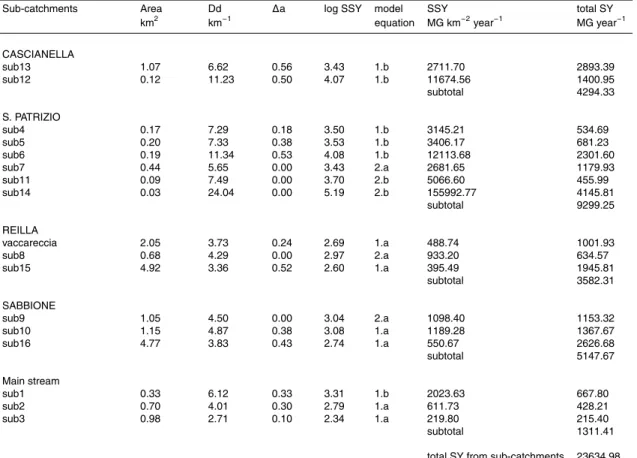
formations are prevalent (Lupia Palmieri, 1983). If the Calvano 3rd order sub-basins are analysed, the magnitude of predicted SSY confirms the consistency with lithology (Table 2). In fact, a mean value of about 12 000 Mg km−2 year−1 is showed.
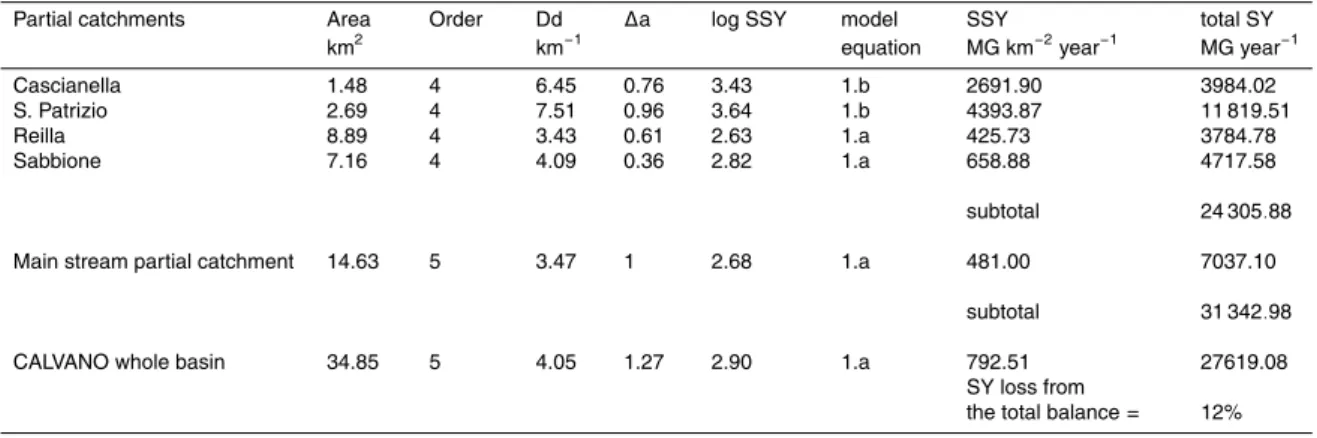
The first level of basin subdivision (4th order) shows that the S. Patrizio stream can
20
provide the highest sediment supply within the whole basin (about 12 000 Mg year−1),
followed by the Sabbione stream (about 4700 Mg year−1
). Moreover, considering that the S. Patrizio outlet coincides with the confluence with the Cascianella partial basin, providing some less than 4000 Mg year−1, this point of the drainage network can
ap-pear critical in terms of risk of flooding. The same situation can also be observed at the
25
second subdivision level (3rd order sub-basins), where the relative tributary supplies to the main streams can be quantified.
HESSD
4, 627–654, 2007 A spatially distributed analysis of river sediment yield S. Grauso et al. Title Page Abstract Introduction Conclusions References Tables Figures ◭ ◮ ◭ ◮ Back CloseFull Screen / Esc
Printer-friendly Version Interactive Discussion
It can be remarked that the sediment supply referred to the whole basin is lower than the sum of its partial basin sediment yields. This can also be verified in the other basin subdivisions down to 3rd and 2nd orders and it is mainly explained by the different entity of drainage density. For example, when referred to the entire Calvano basin area (Dd= 4.05), drainage density results lower than the average Dd of its partial basins (4.99).
5
This produces a sediment yield loss quantifiable in 12% of the expected balance given by the sum of the four partial basins plus the main valley partial basin sediment supply (Table 1). This is in accordance with the assumption that a percentage of sediments moving from tributary basins is re-deposited along the main stream, and it would prove an inherent property, by the adopted methodology, to take into account this process.
10
Table 3 allows to evaluate the role of small hill-reservoirs in the Calvano sediment balance. In the examined area, 30 small reservoirs occur, located throughout the basin except the Cascianella and S. Patrizio partial basins which are characterised by very steeping slopes and where badlands are widely represented (Fig. 4). The overall area drained by reservoirs (8.32 km2) is corresponding to about 24% of whole Calvano basin
15
area. The outcomes of SSY estimates by the model equations show relatively low val-ues (905.43 Mg km−2year−1, on average), considering the bedrock type and according
with the need to prevent the rapid reservoirs filling. Despite that, reservoirs as a whole would capture about 4500 Mg year−1, meaning that 16% of the Calvano yearly
sedi-ment yield is subtracted to the whole sedisedi-ment balance. This sedisedi-ment-trap function,
20
together with their widespread distribution, marks the potential by hill-reservoirs as ef-fective hydraulic regulator in the examined area.
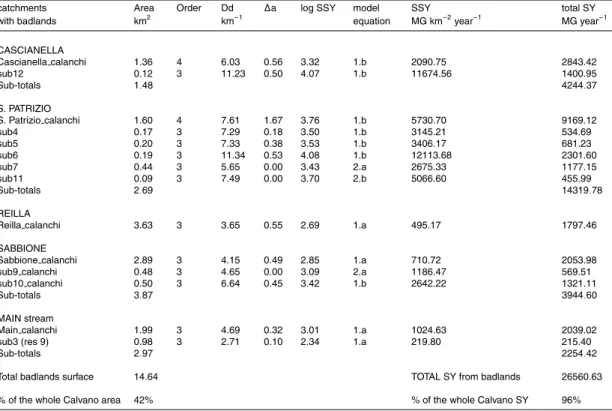
With regard to the influence of badlands on sediment production rate, Table 4 clearly show the meaningful role of these areas. Badlands affect the whole area of Cascianella and S. Patrizio and a large portion of Reilla and Sabbione partial catchments. The total
25
surface affected by badlands amounts to 14.64 km2, corresponding to 42% of the whole Calvano area. The estimated potential sediment supply from these areas constitutes 96% of the total basin SY balance. This means that the gross part of the solid supply to the Calvano main stream is produced in these areas and it is delivered at their outlets.
HESSD
4, 627–654, 2007 A spatially distributed analysis of river sediment yield S. Grauso et al. Title Page Abstract Introduction Conclusions References Tables Figures ◭ ◮ ◭ ◮ Back CloseFull Screen / Esc
Printer-friendly Version Interactive Discussion
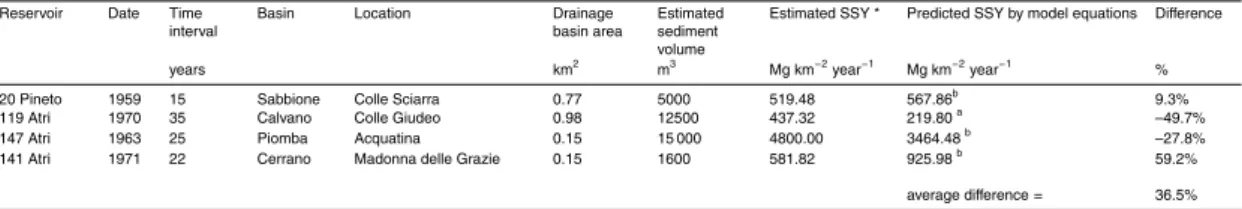
The model equations were also applied to the small catchments draining into the se-lected test reservoirs. The comparison between the sediment volumes estimates, con-verted into sediment yield, and the predicted SSY data allowed to test the model equa-tions reliability (Table 5). In absence of direct geotechnical measurements, the reser-voir sediment volume data were converted into dry weight units and corresponding
5
specific sediment yields by considering a hypothetical dry bulk density of 1.2 Mg m−3
, which is a suitable value for low-compaction sandy-clay materials. As it can be seen, in the four examined cases, predicted SSYs show an average difference of 36.5% if they are compared with reservoir sedimentation data, the best result being showed by 20-Pineto reservoir catchment (9%), while 119-Atri and 141-Atri show major differences.
10
The comparison provides dimensionally consistent and encouraging results, even if they are based on soft data, as direct measurements were not available, and therefore the estimates of sediment volumes settled inside the reservoirs and theoretical bulk density are affected by significant uncertainty. This procedure gives a suggestion for a suitable erosion monitoring system to be adopted, based on periodic sedimentation
15
surveys on the small irrigation hill-reservoirs which are widely diffused in the examined area.
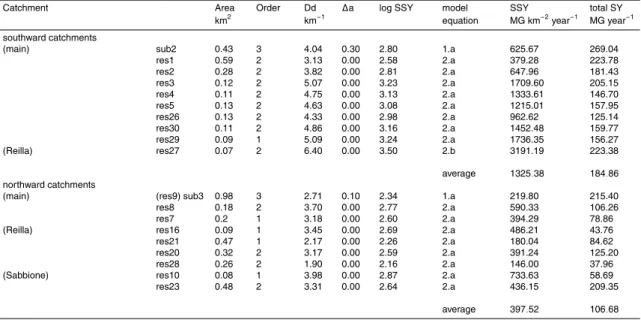
A last consideration concerns the relations between sediment yield and basin expo-sure. A real statistic analysis was not made. However, if one grouped the examined secondary catchments into southward and northward facing catchments (Table 6), the
20
considered catchments would be equally distributed in the two groups. The estimated SSY from southward catchments resulted, on average, about three times higher than that from northward catchments, confirming the influence of slope aspect on sediment supply potential.
5 Conclusions
25
Multiple and simple regression relationships to estimate river sediment yield were ap-plied in a spatially distributed mode, with the aim to assess the river sediment supply at
HESSD
4, 627–654, 2007 A spatially distributed analysis of river sediment yield S. Grauso et al. Title Page Abstract Introduction Conclusions References Tables Figures ◭ ◮ ◭ ◮ Back CloseFull Screen / Esc
Printer-friendly Version Interactive Discussion
different sections of the examined river basin. The obtained estimate of sediment yield have been compared with field data of reservoir siltation, therefore allowing a validation of the proposed method.
The order of magnitude of the obtained results of spatial distribution of erosion rates and sediment delivery can be considered reliable. In fact, the relationships provided a
5
yearly specific sediment yield (SSY) for the Calvano stream which matches the average observed SSY in river basins of central Italy flowing to the Adriatic Sea.
The sediment supply from badlands catchments was also evaluated, confirming the very high contribution of these areas to the whole watershed sediment balance. The sediment yield distribution related to the slopes aspect, confirmed the higher
suscep-10
tibility to erosion and sediment supply of south-facing slopes than differently oriented slopes.
Using simple statistical relationships, such as those here adopted, one is allowed to recognise the river cross sections along the main stream which are more critical in terms of sediment accumulation which, on turn, can cause sudden water discharge
15
increments and dangerous floods. This approach can provide a tool enabling to easily locate the hydraulic risk and to point out the areas where soil conservation practices or hydraulic works, such as periodic maintenance of riverbeds, are needed in order to reduce soil erosion and sediment accumulation.
References 20
Agnesi, V., Del Monte, M., Fredi, P., Macaluso, T., and Messana, V.: Contributo dell’analisi geomorfica quantitativa alla valutazione dell’erosione del suolo nel bacino del fiume Imera settentrionale (Sicilia centro-settentrionale). Proceed. Workshop “Erosione del Suolo, Ges-tione dei Sedimenti e Morfologia delle Coste”, Palermo, Italy, 101–115, 1996.
Anderson, H. W.: Relating Sediment Yield to Watershed Variables. Transactions, American
25
Geophysical Union, 38(6), 921–924, 1957.
Avena, G. C., Giuliano, G., and Lupia Palmieri, E.: Sulla valutazione quantitativa della gerar-chizzazione ed evoluzione dei reticoli fluviali, Boll. Soc. Geol. It., 86, 781–796, 1967.
HESSD
4, 627–654, 2007 A spatially distributed analysis of river sediment yield S. Grauso et al. Title Page Abstract Introduction Conclusions References Tables Figures ◭ ◮ ◭ ◮ Back CloseFull Screen / Esc
Printer-friendly Version Interactive Discussion
Avena, G. C. and Lupia Palmieri, E.: Analisi geomorfica quantitativa, in: Idrogeologia dell’alto bacino del Liri, edited by: Accordi, B., Geologica Romana, VIII, Universit `a degli Studi di Roma, 319–378, 1969.
Ballerini, P., Brunori, M., Moretti, S., and Rodolfi, G.: Soil Erosion on Badlands Areas. Pro-ceedings Int. Symposium “Farmland erosion in temperate plains environments and hills”,
5
Saint-Cloud, Paris, France, 25–29 May 1992, 1992.
Battista, C., Boenzi, F., and Pennetta, L.: Una valutazione dell’erosione nel bacino idrografico del torrente Arcidiaconata in Basilicata, Suppl. Geogr. Fis. Dinam. Quat., 1, 235–246, 1988. Cannarozzo, M. and Ferro, V.: Un semplice modello regionale per la valutazione del trasporto
solido in sospensione nei corsi d’acqua siciliani, Atti Acc. Scienze Lettere e Arti di Palermo
10
serie V, 5, 95–137, 1985.
Cannarozzo, M. and Ferro, V.: Alcune considerazioni sulla scelta di una variabile climatica nella valutazione del trasporto solido in sospensione nei corsi d’acqua siciliani, Atti Acc. Scienze Lettere e Arti di Palermo serie V, 6, 139–157, 1986.
Cannarozzo, M. and Ferro, V.: Confronto tra alcuni modelli per la previsione del volume di
15
interrimento dei serbatoi artificiali siciliani, Atti Acc. Scienze Lettere e Arti di Palermo serie V, 8, 103–119, 1988.
Capozza, F.: Influenza del fattore geomorfologico e litologico sul trasporto solido del Fiume Agri a monte della diga del Pertusillo, Rass. Lav. Pubbl., 12, 1235–1258, 1963.
Cavazza, S.: Contributo al calcolo del potenziale di erosione, Riv. It. Geof., 21, 27–32, 1972.
20
Ceci, D. P., Farroni, A., and Magaldi, D.: Applicazione del codice di calcolo Raizal per la va-lutazione del rischio di erosione nel bacino del fiume Tavo, Geoingegneria Ambientale e Mineraria, Politecnico di Torino, 285–291, 1998.
Ciccacci, S., Fredi, P., and Lupia Palmieri, E.: Rapporti fra trasporto solido e parametri climatici e geomorfici in alcuni bacini idrografici italiani. Workshop “Misura del trasporto solido al fondo
25
nei corsi d’acqua”, Consiglio Nazionale delle Ricerche, Florence, Italy, 1977.
Ciccacci, S., Fredi, P., Lupia Palmieri, E., and Pugliese, F.: Contributo dell’analisi geomorfica quantitativa alla valutazione dell’entit `a dell’erosione nei bacini fluviali, Boll. Soc. Geol. It. 99, 455–516, 1980.
Ciccacci, S., Fredi, P., Lupia Palmieri, E., and Pugliese, F.: Indirect evaluation of erosion entity in
30
drainage basins through geomorphic, climatic and hydrological parameters, in: International Geomorphology 1986 Part II, edited by: Gardiner, V., John Wiley and Sons Ltd, Chichester, 33–48, 1987.
HESSD
4, 627–654, 2007 A spatially distributed analysis of river sediment yield S. Grauso et al. Title Page Abstract Introduction Conclusions References Tables Figures ◭ ◮ ◭ ◮ Back CloseFull Screen / Esc
Printer-friendly Version Interactive Discussion
Ciccacci, S., D’Alessandro, L., Fredi, P., and Lupia Palmieri, E.: Contributo dell’analisi geomor-fica quantitativa allo studio dei processi di denudazione nel bacino idrografico del torrente Paglia, Suppl. Geogr. Fis. Dinam. Quat., 1, 171–188, 1988.
CNR-GNDCI: Progetto AVI – Relazione Regione Abruzzo, U.O. N◦10, Societ `a di Geologia Ap-plicata, 1993.
5
Cooke, R. U. and Doornkamp, J. C.: Geomorphology in Environmental Management. An Intro-duction. Clarendon Press, Oxford, 1974.
Copertino V. A., Marconi G., and Veltri M.: Possibilit `a di applicazione dell’analisi geomorfica quantitativa al regime idraulico di un corso d’acqua (T. Ilice, Calabria), Boll. Soc. Geol. It., n◦99, 455–516, 1977.
10
De Bonis, P., Fattoruso, G., Grauso, S., Peloso, A., and Regina, P.: Computation of geomorphic parameters via GIS-based algorithms: a support tool in river systems management. Proc. Second International Conference “New Trends in Water and Environmental Engineering for Safety and Life: Eco-Compatible Solutions for Acquatic Environments”. Capri, Italy, 136–137, 2002.
15
Douglas, I.: Sediment sources and causes in the humid tropics of northeast Queensland, Aus-tralia. In: Harvey, A. M. (Ed.), Geomorphology in a Tropical Environment, Brit. Geom. Res. Group. Occ. Pap., 5, 27–39, 1968.
Fattoruso, G.: Hydrography and GIS’s – Removing Inconsistencies in Vector River Networks Extracted from Cartography, GeoInformatics, 8, 48–49, 2005.
20
Fournier, F.: Climat et ´erosion: la relation entre l’ ´erosion du sol par l’eau et les pr ´ecipitations atmosph ´eriques, Presses Univ. de France, Paris, 1960.
Fournier, F.: Transport solide effectues par les course d’eau, Intern. Ass. Sci. Hydrol. Bull., XIV(3), 7–50, 1969.
Gazzolo, T. and Bassi, G.: Contributo allo studio del grado di erodibilit `a dei terreni costituenti i
25
bacini montani dei corsi d’acqua italiani, Min. Lav. Pubbl., Giornale del Genio Civile, 1, 9–19, 1961.
Gazzolo T. and Bassi G.: Relazione tra i fattori del processo di ablazione ed il trasporto solido in sospensione nei corsi d’acqua italiani, Min. Lav. Pubbl., Giornale del Genio Civile, 6, 377– 395, 1964.
30
Horton, R. E.: Erosional development of streams and their drainage basins; hydrophysical approach to quantitative morphology, Bull. Geol. Soc. Amer., 56, 275–370, 1945.
Kirkby, M. J. and Cox, N. J.: A climatic index for soil erosion potential (CSEP) including seasonal
HESSD
4, 627–654, 2007 A spatially distributed analysis of river sediment yield S. Grauso et al. Title Page Abstract Introduction Conclusions References Tables Figures ◭ ◮ ◭ ◮ Back CloseFull Screen / Esc
Printer-friendly Version Interactive Discussion
and vegetation factors, Catena, 25, 333–352, 1995.
Ichim, I. and Radoane M.: A multivariate statistical analysis of sediment yield and prediction in Romania. In: Geomorphological Models: Theoretical and Empirical Aspects, edited by: Ahnert, F., Catena Supplement, 10, 137–146, 1987.
Langbein, W. B. and Schumm, S. A.: Yield of sediment in relation to mean annual precipitation.
5
Transactions, American Geophysical Union, 39(6), 1076–1084, 1958.
Lupia Palmieri, E.: Il problema della valutazione dell’entit `a dell’erosione nei bacini fluviali. Proc. XXIII Congr. Geog. It., Catania, Italy, 143–176, 1983.
Lupia Palmieri, E., Ciccacci, S., Civitelli, G., Corda, L., D’Alessandro, L., Del Monte, M., Fredi, P., and Pugliese, F.: Geomorfologia quantitativa e morfodinamica del territorio abruzzese: il
10
bacino idrografico del fiume Sinello. Geogr. Fis. e Dinam. Quatern., 18(1), 31–46, 1995. Massaro, M. E., Russo, M., and Zuppetta, A.: Analisi indiretta dell’entit `a dell’erosione nel bacino
del fiume Tammaro. Geogr. Fis. Dinam. Quatern., 19(2), 381–394, 1996.
Nisio S. , Prestininzi A. , and Scarascia Mugnozza G.: I calanchi del settore settentrionale della fascia periadriatica abruzzese: quadro morfotettonico e loro caratterizzazione, Studi Geol.
15
Camerti, 14, 29-45, 1996.
Parea G. C. and Valloni, R.: Le paleo-spiagge pleistoceniche della zona Atri-Silvi (Abruzzo), Atti Soc. Nat. Mat. di Modena, 114, 51–82, 1983.
Regione Abruzzo: Ortofotocarta 1:10,000 sect. N◦ 340130-351010-339160-350040, 1982. Regione Abruzzo: Carta geomorfologica e del dissesto dei bacini idrografici di rilievo regionale,
20
scala 1:25 000, Fogli 340W-339E-350E-351W, 1990.
Sivapalan, M., Takeuchi, K., Franks, S. W., Gupta, V. K., Karambiri, H., Lakshmi, V., Liang, X., McDonnell, J. J., Mendiondo, E. M., O’Connell, P. E., Oki, T., Pomeroy, J. W., Schertzer, D.; Uhlenbrook, S., and Zehe, E.: IAHS Decade on Predictions in Ungauged Basins (PUB), 2003–2012: Shaping an exciting future for the hydrological sciences, Hydrol. Sci. J., 48(6),
25
857–880, 2003.
Strahler, A. N.: Quantitative Analysis of Watershed Geomorphology. Transactions, American Geophysical Union 38 (6), 913–920, 1957.
Vittorini, S.: Osservazioni sull’origine e sul ruolo di due forme di erosione nelle argille: calanchi e biancane, Boll. Soc. Geogr. It., vol. VL, 25–51, 1977.
30
HESSD
4, 627–654, 2007 A spatially distributed analysis of river sediment yield S. Grauso et al. Title Page Abstract Introduction Conclusions References Tables Figures ◭ ◮ ◭ ◮ Back CloseFull Screen / Esc
Printer-friendly Version Interactive Discussion Table 1. Sediment yield estimates in 4th order partial catchments and the whole Calvano
stream basin.
Partial catchments Area Order Dd ∆a log SSY model SSY total SY km2 km−1 equation MG km−2year−1 MG year−1
Cascianella 1.48 4 6.45 0.76 3.43 1.b 2691.90 3984.02 S. Patrizio 2.69 4 7.51 0.96 3.64 1.b 4393.87 11 819.51 Reilla 8.89 4 3.43 0.61 2.63 1.a 425.73 3784.78 Sabbione 7.16 4 4.09 0.36 2.82 1.a 658.88 4717.58 subtotal 24 305.88 Main stream partial catchment 14.63 5 3.47 1 2.68 1.a 481.00 7037.10
subtotal 31 342.98 CALVANO whole basin 34.85 5 4.05 1.27 2.90 1.a 792.51 27619.08
SY loss from
the total balance = 12%
HESSD
4, 627–654, 2007 A spatially distributed analysis of river sediment yield S. Grauso et al. Title Page Abstract Introduction Conclusions References Tables Figures ◭ ◮ ◭ ◮ Back CloseFull Screen / Esc
Printer-friendly Version Interactive Discussion Table 2. Sediment yield estimates in 3rd order sub-catchments.
Sub-catchments Area Dd ∆a log SSY model SSY total SY km2 km−1 equation MG km−2year−1 MG year−1
CASCIANELLA sub13 1.07 6.62 0.56 3.43 1.b 2711.70 2893.39 sub12 0.12 11.23 0.50 4.07 1.b 11674.56 1400.95 subtotal 4294.33 S. PATRIZIO sub4 0.17 7.29 0.18 3.50 1.b 3145.21 534.69 sub5 0.20 7.33 0.38 3.53 1.b 3406.17 681.23 sub6 0.19 11.34 0.53 4.08 1.b 12113.68 2301.60 sub7 0.44 5.65 0.00 3.43 2.a 2681.65 1179.93 sub11 0.09 7.49 0.00 3.70 2.b 5066.60 455.99 sub14 0.03 24.04 0.00 5.19 2.b 155992.77 4145.81 subtotal 9299.25 REILLA vaccareccia 2.05 3.73 0.24 2.69 1.a 488.74 1001.93 sub8 0.68 4.29 0.00 2.97 2.a 933.20 634.57 sub15 4.92 3.36 0.52 2.60 1.a 395.49 1945.81 subtotal 3582.31 SABBIONE sub9 1.05 4.50 0.00 3.04 2.a 1098.40 1153.32 sub10 1.15 4.87 0.38 3.08 1.a 1189.28 1367.67 sub16 4.77 3.83 0.43 2.74 1.a 550.67 2626.68 subtotal 5147.67 Main stream sub1 0.33 6.12 0.33 3.31 1.b 2023.63 667.80 sub2 0.70 4.01 0.30 2.79 1.a 611.73 428.21 sub3 0.98 2.71 0.10 2.34 1.a 219.80 215.40 subtotal 1311.41 total SY from sub-catchments 23634.98
HESSD
4, 627–654, 2007 A spatially distributed analysis of river sediment yield S. Grauso et al. Title Page Abstract Introduction Conclusions References Tables Figures ◭ ◮ ◭ ◮ Back CloseFull Screen / Esc
Printer-friendly Version Interactive Discussion Table 3. Sediment yield estimates in secondary (mainly 1st and 2nd order) catchments draining
into reservoirs.
Secondary Area Order Dd ∆a log SSY model SSY total SY
catchments km2 km−1 equation MG km−2year−1 MG year−1
REILLA res16 0.09 1 3.45 0.00 2.69 2.a 486.21 43.76 res17 0.12 1 3.19 0.00 2.60 2.a 397.36 47.68 res18 0.05 1 6.63 0.00 3.55 2.b 3540.17 177.01 res19 0.17 2 5.00 0.00 3.21 2.a 1619.20 275.26 res20 0.32 2 3.17 0.00 2.59 2.a 391.24 125.20 res21 0.47 1 2.17 0.00 2.26 2.a 180.04 84.62 res25 0.12 1 3.03 0.00 2.55 2.a 350.96 42.11 res27 0.07 2 6.40 0.00 3.50 2.b 3191.19 223.38 res28 0.26 2 1.90 0.00 2.16 2.a 146.00 37.96 sub-total 1056.99 SABBIONE res10 0.08 1 3.98 0.00 2.87 2.a 733.63 55.05 res11 0.29 2 4.05 0.00 2.89 2.a 774.59 211.24 res12 0.36 2 3.61 0.00 2.74 2.a 550.50 183.36 res13 0.59 2 3.36 0.00 2.66 2.a 453.41 245.24 res15 1.31 3 2.97 0.40 2.46 1.a 286.80 375.70 res22 0.21 2 4.11 0.00 2.91 2.a 811.52 160.62 res23 0.48 2 3.31 0.00 2.64 2.a 436.15 191.57 res24 0.15 2 3.62 0.00 2.74 2.a 554.79 77.03 sub-total 1499.81 MAIN STREAM
res9 (sub3) 0.98 3 2.71 0.10 2.34 1.a 219.80 215.40
res1 0.59 2 3.13 0.00 2.58 2.a 379.28 223.78 res2 0.28 2 3.82 0.00 2.81 2.a 647.96 181.43 res3 0.12 2 5.07 0.00 3.23 2.a 1709.60 205.15 res4 0.11 2 4.75 0.00 3.13 2.a 1333.61 146.70 res5 0.13 2 4.63 0.00 3.08 2.a 1215.01 157.95 res6 0.09 1 4.06 0.00 2.89 2.a 780.63 70.26 res8 0.18 2 3.70 0.00 2.77 2.a 590.33 106.26 res14 0.17 2 4.15 0.00 2.92 2.a 837.11 142.31 res26 0.13 2 4.33 0.00 2.98 2.a 962.62 125.14 res30 0.11 2 4.86 0.00 3.16 2.a 1452.48 159.77 res7 0.20 1 3.18 0.00 2.60 2.a 394.29 78.86 res 29 0.09 1 5.09 0.00 3.24 2.a 1736.35 156.27 sub-total 1969.27
total area drained
by reservoirs 8.32 TOTAL SY to reservoirs 4526.07
SY % trapped in reservoirs 16%
HESSD
4, 627–654, 2007 A spatially distributed analysis of river sediment yield S. Grauso et al. Title Page Abstract Introduction Conclusions References Tables Figures ◭ ◮ ◭ ◮ Back CloseFull Screen / Esc
Printer-friendly Version Interactive Discussion Table 4. Sediment yield estimates from catchments with badlands (calanchi) occurrence.
catchments Area Order Dd ∆a log SSY model SSY total SY
with badlands km2 km−1 equation MG km−2year−1 MG year−1
CASCIANELLA Cascianella calanchi 1.36 4 6.03 0.56 3.32 1.b 2090.75 2843.42 sub12 0.12 3 11.23 0.50 4.07 1.b 11674.56 1400.95 Sub-totals 1.48 4244.37 S. PATRIZIO S. Patrizio calanchi 1.60 4 7.61 1.67 3.76 1.b 5730.70 9169.12 sub4 0.17 3 7.29 0.18 3.50 1.b 3145.21 534.69 sub5 0.20 3 7.33 0.38 3.53 1.b 3406.17 681.23 sub6 0.19 3 11.34 0.53 4.08 1.b 12113.68 2301.60 sub7 0.44 3 5.65 0.00 3.43 2.a 2675.33 1177.15 sub11 0.09 3 7.49 0.00 3.70 2.b 5066.60 455.99 Sub-totals 2.69 14319.78 REILLA
Reilla calanchi 3.63 3 3.65 0.55 2.69 1.a 495.17 1797.46
SABBIONE
Sabbione calanchi 2.89 3 4.15 0.49 2.85 1.a 710.72 2053.98
sub9 calanchi 0.48 3 4.65 0.00 3.09 2.a 1186.47 569.51
sub10 calanchi 0.50 3 6.64 0.45 3.42 1.b 2642.22 1321.11
Sub-totals 3.87 3944.60
MAIN stream
Main calanchi 1.99 3 4.69 0.32 3.01 1.a 1024.63 2039.02
sub3 (res 9) 0.98 3 2.71 0.10 2.34 1.a 219.80 215.40
Sub-totals 2.97 2254.42
Total badlands surface 14.64 TOTAL SY from badlands 26560.63
% of the whole Calvano area 42% % of the whole Calvano SY 96%
HESSD
4, 627–654, 2007 A spatially distributed analysis of river sediment yield S. Grauso et al. Title Page Abstract Introduction Conclusions References Tables Figures ◭ ◮ ◭ ◮ Back CloseFull Screen / Esc
Printer-friendly Version Interactive Discussion Table 5. Test-reservoirs sedimentation estimates and comparison with predicted SSYs by
model equations.
Reservoir Date Time interval
Basin Location Drainage basin area
Estimated sediment volume
Estimated SSY * Predicted SSY by model equations Difference
years km2 m3 Mg km−2year−1 Mg km−2year−1 %
20 Pineto 1959 15 Sabbione Colle Sciarra 0.77 5000 519.48 567.86b 9.3%
119 Atri 1970 35 Calvano Colle Giudeo 0.98 12500 437.32 219.80a –49.7%
147 Atri 1963 25 Piomba Acquatina 0.15 15 000 4800.00 3464.48b –27.8%
141 Atri 1971 22 Cerrano Madonna delle Grazie 0.15 1600 581.82 925.98b 59.2%
average difference = 36.5% * volume-mass conversion by γd = 1.2 Mg m−3 a = Eq. (1a) b = Eq. (2a) 649
HESSD
4, 627–654, 2007 A spatially distributed analysis of river sediment yield S. Grauso et al. Title Page Abstract Introduction Conclusions References Tables Figures ◭ ◮ ◭ ◮ Back CloseFull Screen / Esc
Printer-friendly Version Interactive Discussion Table 6. Sediment yield comparison between south- and northward facing catchments.
Catchment Area Order Dd ∆a log SSY model SSY total SY
km2 km−1 equation MG km−2year−1 MG year−1
southward catchments
(main) sub2 0.43 3 4.04 0.30 2.80 1.a 625.67 269.04
res1 0.59 2 3.13 0.00 2.58 2.a 379.28 223.78 res2 0.28 2 3.82 0.00 2.81 2.a 647.96 181.43 res3 0.12 2 5.07 0.00 3.23 2.a 1709.60 205.15 res4 0.11 2 4.75 0.00 3.13 2.a 1333.61 146.70 res5 0.13 2 4.63 0.00 3.08 2.a 1215.01 157.95 res26 0.13 2 4.33 0.00 2.98 2.a 962.62 125.14 res30 0.11 2 4.86 0.00 3.16 2.a 1452.48 159.77 res29 0.09 1 5.09 0.00 3.24 2.a 1736.35 156.27 (Reilla) res27 0.07 2 6.40 0.00 3.50 2.b 3191.19 223.38 average 1325.38 184.86 northward catchments
(main) (res9) sub3 0.98 3 2.71 0.10 2.34 1.a 219.80 215.40
res8 0.18 2 3.70 0.00 2.77 2.a 590.33 106.26
res7 0.2 1 3.18 0.00 2.60 2.a 394.29 78.86
(Reilla) res16 0.09 1 3.45 0.00 2.69 2.a 486.21 43.76
res21 0.47 1 2.17 0.00 2.26 2.a 180.04 84.62
res20 0.32 2 3.17 0.00 2.59 2.a 391.24 125.20
res28 0.26 2 1.90 0.00 2.16 2.a 146.00 37.96
(Sabbione) res10 0.08 1 3.98 0.00 2.87 2.a 733.63 58.69
res23 0.48 2 3.31 0.00 2.64 2.a 436.15 209.35
average 397.52 106.68
HESSD
4, 627–654, 2007 A spatially distributed analysis of river sediment yield S. Grauso et al. Title Page Abstract Introduction Conclusions References Tables Figures ◭ ◮ ◭ ◮ Back CloseFull Screen / Esc
Printer-friendly Version Interactive Discussion Fig. 1. Geographic location of the Calvano watershed. Projection East U.T.M. 33 European
Datum 1950.
HESSD
4, 627–654, 2007 A spatially distributed analysis of river sediment yield S. Grauso et al. Title Page Abstract Introduction Conclusions References Tables Figures ◭ ◮ ◭ ◮ Back CloseFull Screen / Esc
Printer-friendly Version Interactive Discussion Fig. 2. Geo-lithological scheme.
HESSD
4, 627–654, 2007 A spatially distributed analysis of river sediment yield S. Grauso et al. Title Page Abstract Introduction Conclusions References Tables Figures ◭ ◮ ◭ ◮ Back CloseFull Screen / Esc
Printer-friendly Version Interactive Discussion (a)
(b)
(c+)
Fig. 3. Different patterns of the Calvano watershed subdivision: (a) 4th order partial catchments
draining into the main stream; (b) previous plus 3rd order sub- catchments; (c) previous plus 2nd and 1st order secondary catchments draining into hill-reservoirs.
HESSD
4, 627–654, 2007 A spatially distributed analysis of river sediment yield S. Grauso et al. Title Page Abstract Introduction Conclusions References Tables Figures ◭ ◮ ◭ ◮ Back CloseFull Screen / Esc
Printer-friendly Version Interactive Discussion Fig. 4. Location of catchments affected by badlands.