HAL Id: hal-00301532
https://hal.archives-ouvertes.fr/hal-00301532
Submitted on 14 Jun 2006HAL is a multi-disciplinary open access
archive for the deposit and dissemination of sci-entific research documents, whether they are pub-lished or not. The documents may come from teaching and research institutions in France or abroad, or from public or private research centers.
L’archive ouverte pluridisciplinaire HAL, est destinée au dépôt et à la diffusion de documents scientifiques de niveau recherche, publiés ou non, émanant des établissements d’enseignement et de recherche français ou étrangers, des laboratoires publics ou privés.
Some experimental constraints for spectral parameters
used in the Warner and McIntyre gravity wave
parameterization scheme
M. Ern, P. Preusse, C. D. Warner
To cite this version:
M. Ern, P. Preusse, C. D. Warner. Some experimental constraints for spectral parameters used in the Warner and McIntyre gravity wave parameterization scheme. Atmospheric Chemistry and Physics Discussions, European Geosciences Union, 2006, 6 (3), pp.4755-4794. �hal-00301532�
ACPD
6, 4755–4794, 2006 Some experimental constraints for a GW parameterization scheme M. Ern et al. Title Page Abstract Introduction Conclusions References Tables Figures J I J I Back CloseFull Screen / Esc
Printer-friendly Version Interactive Discussion Atmos. Chem. Phys. Discuss., 6, 4755–4794, 2006
www.atmos-chem-phys-discuss.net/6/4755/2006/ © Author(s) 2006. This work is licensed
under a Creative Commons License.
Atmospheric Chemistry and Physics Discussions
Some experimental constraints for
spectral parameters used in the Warner
and McIntyre gravity wave
parameterization scheme
M. Ern1, P. Preusse1, and C. D. Warner2
1
Institute for Stratospheric Research (ICG-I), Forschungszentrum Juelich, Juelich, Germany
2
Centre for Atmospheric Science, University of Cambridge, Cambridge, UK
Received: 8 March 2006 – Accepted: 22 April 2006 – Published: 14 June 2006 Correspondence to: M. Ern ([email protected])
ACPD
6, 4755–4794, 2006 Some experimental constraints for a GW parameterization scheme M. Ern et al. Title Page Abstract Introduction Conclusions References Tables Figures J I J I Back CloseFull Screen / Esc
Printer-friendly Version Interactive Discussion
Abstract
In order to incorporate the effect of gravity waves (GWs) on the atmospheric circu-lation most global circucircu-lation models (GCMs) employ gravity wave parameterization schemes. To date, GW parameterization schemes in GCMs are used without exper-imental validation of the set of global parameters assumed for the GW launch spec-5
trum. This paper focuses on the Warner and McIntyre GW parameterization scheme. Ranges of parameters compatible with absolute values of gravity wave momentum flux (GW-MF) derived from CRISTA-1 and CRISTA-2 satellite measurements are deduced for several of the parameters and the limitations of both model and measurements are discussed. The findings presented in this paper show that the initial guess of spectral 10
parameters provided byWarner and McIntyre(2001) are some kind of compromise with respect to agreement of absolute values and agreement of the horizontal structures found in both measurements and model results. Better agreement can be achieved by using a vertical wavenumber launch spectrum with a wider saturated spectral range and reduced spectral power in the unsaturated part. Still, even global features of the 15
measurements remain unmatched, and it is inevitable to provide a globally varying source distribution in future.
1 Introduction
Gravity waves (GWs) are one of the most important vertical coupling processes in the atmosphere transferring momentum from the troposphere into the stratosphere 20
and mesosphere and contributing to the acceleration and deceleration of the horizon-tal wind. A review of GW dynamics has been given by Fritts and Alexander(2003). Since the spatial resolution in global circulation models (GCMs) is not sufficient to re-solve medium scale processes like gravity waves the contribution of GWs to the model dynamics is calculated with GW parameterization schemes. Different approaches 25
have led to a number of different parameterization schemes (e.g., McFarlane,1987; 4756
ACPD
6, 4755–4794, 2006 Some experimental constraints for a GW parameterization scheme M. Ern et al. Title Page Abstract Introduction Conclusions References Tables Figures J I J I Back CloseFull Screen / Esc
Printer-friendly Version Interactive Discussion
Medvedev and Klaassen, 1995; Hines, 1997a,b; Warner and McIntyre, 2001) with
spectral parameterizations being the latest development. A review about GW parame-terization schemes is given byKim et al.(2003).
Parameterizing instead of resolving GW processes in a GCM allows the use of model grids with lower spatial resolution and reduces the computational cost dramatically, a 5
requirement which is important especially for long-term model runs. In spectral GW parameterization schemes a GW spectral distribution (launch spectrum) is launched at a fixed altitude (launch altitude). Then the wave spectrum is propagated vertically through the background atmosphere. There are several parameters that are more or less freely adjustable. One parameter is the launch altitude itself. Other parameters 10
define the spectral shape of the GW spectrum at the launch altitude.
There are some assumptions about the properties of the GW spectrum which are commonly made. Supported by various observations (e.g.,Sato,1994;Nastrom et al.,
1997; Cot, 2001; Hertzog and Vial, 2001; Hertzog et al., 2001, 2002; Tsuda et al.,
2004) the intrinsic frequency ˆω spectrum of the GW total wave energy density often is
15
assumed to decrease with ˆω−p for large values of ˆω and typically a value of p=5/3 is
used.
Also well-constrained is the vertical wavenumber m spectrum in its saturated part at large vertical wavenumbers m: there are numerous observations that the saturated part of the vertical wavenumber spectrum obeys a power law ∼m−t and decreases 20
with a power of t≈3 (e.g.,VanZandt,1982;Tsuda et al.,1989,1991;Sato,1993,1994;
Allen and Vincent, 1995; Hertzog et al., 2001). On the other hand, the unsaturated
part of the vertical wavenumber spectrum (at small vertical wavenumbers m) is not well defined observationally or theoretically (Fritts and Alexander,2003).
For the characteristic wavenumber m* separating the saturated from the unsaturated 25
part of the vertical wavenumber spectrum typical values of about 0.2–0.5 cycles/km have been reported for the lower stratosphere (Allen and Vincent,1995;Hertzog et al.,
2001;Tsuda and Hocke,2002). However, the values given are subject to larger
uncer-tainties mainly due to the required detrending of the vertical profiles of observations. In 4757
ACPD
6, 4755–4794, 2006 Some experimental constraints for a GW parameterization scheme M. Ern et al. Title Page Abstract Introduction Conclusions References Tables Figures J I J I Back CloseFull Screen / Esc
Printer-friendly Version Interactive Discussion addition, the meteorological conditions at the measurement locations play an important
role.
All these assumptions and observations are incorporated in the GW parameter-ization schemes used in GCMs. In the Warner and McIntyre GW parameteriza-tion scheme (Warner and McIntyre, 1996, 1999, 2001) for simplification the vertical 5
wavenumber (m) launch spectrum for gravity wave momentum flux (GW-MF) is divided into two parts: The unsaturated part at low vertical wavenumbers m is assumed to increase with ms (with a small-m cutoff value mcut). InWarner and McIntyre(2001) a standard value of s=1 is used. However, this spectral slope is not very well defined by observations or theoretically (Fritts and Alexander,2003). The saturated part of the 10
spectrum at high vertical wavenumbers is assumed to decline with m−t with the stan-dard value t=3. The characteristic wavenumber m* separates the unsaturated from the saturated spectral part (see Fig.1).
Another parameter β defines the value of the GW energy density E0 at the launch level:
15
E0=βN2/m∗2 (1)
where N is the buoyancy frequency. In the Warner and McIntyre scheme the value of
β is proportional to the amount of GW-MF (at all altitudes) and the GW drag derived
from it. From theoretical assumptions the value of β is about 0.1 with an uncertainty of about a factor of two (Warner and McIntyre,1996;Fritts and Alexander,2003).
20
The choice of these launch parameters is based more on theoretical assumptions than on observations (Warner and McIntyre,1996,1999,2001). This is why normally fixed parameter values are taken for all longitudes and latitudes, and global variations of these values due to different sources and mechanisms exciting GWs remain out of consideration. This means the Warner and McIntyre GW scheme (like all other general 25
GW parameterization schemes) will describe only the global background distribution of GWs.
In particular, orographically excited GWs (mountain waves) and GWs excited by deep convection, mainly in the tropics and subtropics, are not covered by these general
ACPD
6, 4755–4794, 2006 Some experimental constraints for a GW parameterization scheme M. Ern et al. Title Page Abstract Introduction Conclusions References Tables Figures J I J I Back CloseFull Screen / Esc
Printer-friendly Version Interactive Discussion GW parameterization schemes. GWs excited by those processes have to be described
by separate models (McFarlane,1987;Eckermann et al.,2000;Chun and Baik,1998,
2002;Beres et al.,2005).
Global data sets of observed GW-MF can help to remedy the lack of experimental constraints. It can be tested whether the simplifying assumptions mentioned above 5
are justified and, in particular, whether a GW parameterization scheme with a selected set of fixed model parameters is able to reproduce the observed horizontal and verti-cal patterns of GW-MF. The only true global data set of GW-MF available was derived from temperature altitude profiles measured by the CRyogenic Infrared Spectrometers and Telescopes for the Atmosphere (CRISTA) instrument (Ern et al., 2004). There-10
fore the purpose of this paper is to compare GW-MF distributions from both CRISTA flights with simulated distributions from the Warner and McIntyre GW parameterization scheme and by variation of the free parameters to infer constraints for the model launch parameters.
2 CRISTA gravity wave momentum flux
15
2.1 Algorithm
The CRISTA instrument was part of two Space Shuttle missions in November 1994 (CRISTA-1) and August 1997 (CRISTA-2). A high-resolution measuring grid in all three spatial dimensions was obtained by using three telescopes simultaneously and by cool-ing the instrument with supercritical helium to improve the measurement speed (O
ffer-20
mann et al.,1999). Atmospheric temperatures were derived from CO2 infrared limb emissions at 12.6 µm (Riese et al.,1999).
To separate temperature fluctuations due to GWs from larger scale atmospheric structures like planetary waves, the temperature data were detrended using a zonal wavenumber 0–6 Kalman filter. The so-obtained vertical profiles of residual tempera-25
tures were analyzed for GWs using a combination of maximum entropy method and 4759
ACPD
6, 4755–4794, 2006 Some experimental constraints for a GW parameterization scheme M. Ern et al. Title Page Abstract Introduction Conclusions References Tables Figures J I J I Back CloseFull Screen / Esc
Printer-friendly Version Interactive Discussion harmonic analysis and vertical profiles of GW amplitudes, vertical wavelengths and
phases of the two strongest vertical wave components were derived (Preusse et al.,
2002).
The short horizontal sampling distance of about 200 km along the satellite track is just sufficient to estimate the horizontal wavelengths of the GWs from GW phase dif-5
ferences between pairs of consecutive altitude profiles. Based on the determined GW temperature amplitudes, vertical and horizontal wavelengths it was possible to derive absolute values of GW-MF from satellite data for the first time (Ern et al.,2004).
Only absolute values of GW-MF (i.e., not the direction of GW-MF) could be derived due to limitations of the horizontal sampling. To derive vectors of GW-MF a high-10
resolution 2-D horizontal sampling of about 40 km along and about 40 km across the satellite track is needed (Riese et al.,2005).
Another problem when determining GW-MF are aliasing effects: The limb scan-ning geometry allows CRISTA to detect GWs with horizontal wavelengths as short as ∼100 km (Preusse et al., 2002; Ern et al., 2005). This is much shorter than the 15
limiting wavelength (Nyquist wavelength) of 400 km (i.e. twice the horizontal sampling distance along the satellite track) that can be resolved unambiguously by the CRISTA horizontal sampling. Therefore limitations arising from the CRISTA sampling are more severe than those arising from the limb scanning geometry.
This undersampling of GWs causes aliasing effects: horizontal wavelengths deter-20
mined for the fraction of undersampled waves are systematically too long and the GW-MF carried by these waves is underestimated. To compensate for this low-bias in CRISTA GW-MF an aliasing correction has been applied. Of course, such an empirical correction is subject to large errors. The correction is based on the mean horizontal wavelength in regions of 30◦ longitude times 20◦latitude (Ern et al.,2004) and gener-25
ally increases the CRISTA GW-MF values. The average correction is about a factor of 1.7 and the correction is limited to not more than a factor of 2. Largest corrections are made at high northern and high southern latitudes. Hence, the contrast between equa-torial and polar latitudes is enhanced. For a more detailed description of the GW-MF
ACPD
6, 4755–4794, 2006 Some experimental constraints for a GW parameterization scheme M. Ern et al. Title Page Abstract Introduction Conclusions References Tables Figures J I J I Back CloseFull Screen / Esc
Printer-friendly Version Interactive Discussion algorithm seeErn et al.(2004).
The single-wave spectral results from CRISTA altitude profiles will be compared with results from a spectral GW parameterization. Since a spectral model reflects the GW mean state at a given location we have to average over the single CRISTA profiles to obtain comparable values. Therefore for all further analyses the GW-MF values 5
determined for the abovementioned regions of 30◦ longitude times 20◦ latitude will be used. Averaging the CRISTA profiles has also the advantage of reducing the scatter due to intermittent GW sources inherent in the single CRISTA profiles. In addition, aliasing corrected GW-MF values can be used.
2.2 GW-MF during CRISTA-1 and CRISTA-2 10
There are some differences between the CRISTA-1 (Nov. 1994) and CRISTA-2 (Aug. 1997) data sets with respect to GW analysis, derivation of GW-MF, and the interpreta-tion of the results.
First, the meteorological conditions during the two CRISTA missions were different. Latitude altitude cross sections of the zonal mean zonal wind for the CRISTA-1 and 15
CRISTA-2 missions are shown in Fig.2. During CRISTA-2 there is a wind reversal in the northern hemisphere already at low altitudes between 20 and 25 km (see Fig.2b). This wind reversal prevents mountain waves from propagating towards higher alti-tudes. In the southern hemisphere there is no wind reversal and mountain waves can propagate through the whole stratosphere. However, there are only few major mountain 20
ridges in the southern hemisphere. Therefore orographic GWs should not be a domi-nant effect. Since nonorographic GW parameterization schemes (e.g., the Warner and McIntyre GW parameterization scheme) do not cover contributions due to mountain waves the CRISTA-2 data set of GW-MF should be suited better for comparisons with those models than, for example, the CRISTA-1 GW-MF data. During CRISTA-1 there 25
is no wind reversal in the northern hemisphere and the wind reversal observed in the southern hemisphere is at higher altitudes (about 20–35 km depending on latitude, see Fig.2a). Therefore part of the GWs observed during CRISTA-1 are mountain waves
ACPD
6, 4755–4794, 2006 Some experimental constraints for a GW parameterization scheme M. Ern et al. Title Page Abstract Introduction Conclusions References Tables Figures J I J I Back CloseFull Screen / Esc
Printer-friendly Version Interactive Discussion (see alsoEckermann and Preusse,1999;Preusse et al.,2002;Jiang et al.,2004a).
In addition, the CRISTA-2 GW-MF data should generally be better suited for global comparisons due to the observed strong meridional variation of GW-MF with very high values in the region of the southern polar jet (Ern et al.,2004), providing a high-contrast distribution of GW-MF. This meridional variation is less pronounced in the CRISTA-1 5
GW-MF data, see also Sect.3. Due to differences between the measurement modes of the two CRISTA missions the CRISTA-2 values of GW-MF also cover a larger altitude interval (about 20–50 km) compared to CRISTA-1 (about 20–40 km).
3 Horizontal distributions of CRISTA GW-MF compared to standard Warner and McIntyre scheme results
10
Previous investigations have shown that good agreement between the GW-MF horizon-tal distributions at 25 km altitude obtained from CRISTA-2 and the Warner and McIntyre scheme using the standard set of launch parameters (s=1, λ∗z,launch=2π/m∗launch=2 km) can only be achieved if a low model GW launch level is chosen (Ern et al.,2004,2005). Using higher launch levels usually results in model GW-MF distributions too symmetric 15
with respect to the equator and the longitudinal structure of GW-MF is not reproduced properly (Ern et al.,2004, 2005). In this section some examples are shown for both CRISTA-1 and CRISTA-2 and a low model launch level of 464 mbar (about 5.4 km).
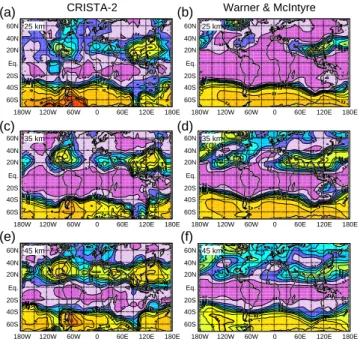
Figure 3shows horizontal distributions of GW-MF absolute values for CRISTA-2 at altitudes of 25 km (Fig.3a), 35 km (Fig.3c), and 45 km (Fig.3e). Also shown are results 20
of GW-MF absolute values calculated with the Warner and McIntyre GW parameteriza-tion scheme using meteorological data (temperature and wind fields) from the UK Met Office (UKMO) stratosphere-troposphere assimilation system (Swinbank and O’Neill,
1994) interpolated to CRISTA-2 measurement times and locations for the same alti-tudes (25 km (Fig.3b), 35 km (Fig.3d), and 45 km (Fig.3f). The model GW-MF results 25
are filtered according to the horizontal and vertical wavelengths of GWs visible for the CRISTA instrument: CRISTA is able to detect waves with horizontal wavelengths
ACPD
6, 4755–4794, 2006 Some experimental constraints for a GW parameterization scheme M. Ern et al. Title Page Abstract Introduction Conclusions References Tables Figures J I J I Back CloseFull Screen / Esc
Printer-friendly Version Interactive Discussion from ∼100 km to ∼5000 km and vertical wavelengths in the intervals λz ∈ [5 km, 25 km]
(CRISTA-1) and λz ∈ [6 km, 30 km] (CRISTA-2) (Ern et al.,2005).
Obviously, the good agreement between the horizontal relative structures of both CRISTA-2 and model data found earlier byErn et al. (2004) at 25 km altitude is also valid for the other altitudes. There are some differences in details of the horizontal 5
structures. For example, the very high values of GW-MF found in the CRISTA-2 data over the Antarctic Peninsula and the southern tip of South America, or the high values over Southeast Asia and the Gulf of Mexico, are all underrepresented in the model results and indicate localized GW sources in these regions. On the other hand, there is slightly too much GW-MF in the northernmost latitudes of the model results, especially 10
at 45 km altitude. It should also be mentioned that the color scales of Figs.3a–f are all different to allow the comparison of horizontal structures (see contour labels). At 25 km altitude the model values of GW-MF are considerably lower than the CRISTA-2 values by over a factor of 5 (global average), whereas at 45 km altitude the model values are lower than the CRISTA-2 values by not more than a factor of about 2 (global average). 15
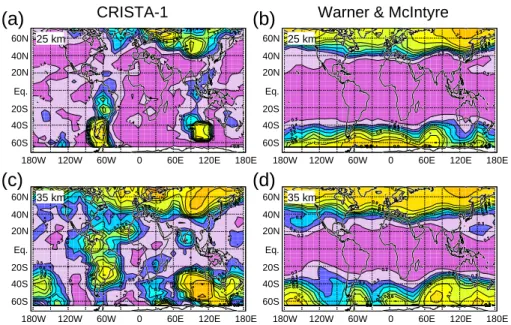
Figure 4 shows a comparison between CRISTA-1 GW-MF absolute values and Warner and McIntyre results like the one in Fig. 3 with the same model launch pa-rameters (launch level 464 mbar, s=1, and λ∗z,launch = 2 km). Since the altitude range of the CRISTA-1 GW-MF data is smaller only altitudes of 25 km and 35 km are shown for the CRISTA-1 (Figs.4a, c) and the model data (Figs.4b, d). Again, the color scales 20
are different in Figs.4a–d to highlight features of the horizontal distributions.
The agreement between model and CRISTA-1 horizontal relative structures of GW-MF absolute values is worse than in the CRISTA-2 case. The agreement improves with altitude, however, in the 25 km as well as in the 35 km CRISTA-1 maps there are additional regions of high GW-MF over entire South America which are not present in 25
the model maps. In addition, in the model maps there are high values of GW-MF at the southernmost latitudes, which are not present in the CRISTA-1 data. Also the bands of high GW-MF in northern latitudes are too uniform and too pronounced in the model data, especially at 25 km altitude.
ACPD
6, 4755–4794, 2006 Some experimental constraints for a GW parameterization scheme M. Ern et al. Title Page Abstract Introduction Conclusions References Tables Figures J I J I Back CloseFull Screen / Esc
Printer-friendly Version Interactive Discussion Like for the CRISTA-2 data, the GW-MF absolute values from CRISTA-1 are
consid-erably higher than the model results. At 25 km altitude they are higher by a factor of about 5 (global average), and at 35 km altitude the CRISTA-1 values are higher by a factor of about 3 (global average).
As a criterion for the agreement between measured and modeled horizontal dis-5
tribution a correlation coefficient can be calculated grid point by grid point from the horizontal maps. Correlation will be especially high if the modeled GW-MF exhibits the same meridional asymmetry as the CRISTA GW-MF and if longitudinal variations are the same. The correlation between horizontal distributions will be used to evaluate choices of model parameters in Sect.4.
10
4 Comparison of horizontal GW momentum flux distributions for different
choices of launch level, λ∗z,launch and s
Given the horizontal distributions of GW-MF from CRISTA as reference possible ranges of the GW launch parameters used in the Warner and McIntyre scheme can be determined. Especially the launch altitude and the spectral parameters λ∗z,launch 15
(λ∗z,launch=2π/m∗launch) and s are poorly constrained by measurements. Therefore we
will focus on these parameters in the following.
Other parameters like the spectral slopes t=3 (saturated part of vertical wavelength spectrum assumed to decrease with m−3) and p=5/3 (intrinsic frequency ˆω spectrum of the GW wave energy density assumed to decrease with ˆω−5/3) are better constrained 20
by observations (see Sect.1) and will be left unchanged.
It should be stated clearly that the error ranges of CRISTA GW-MF and Warner and McIntyre model results are quite large (Ern et al., 2004). Therefore deviations between CRISTA and model GW-MF absolute values will be inside the error range if deviations are less than a factor of about 4–5. (Relative structures are subject to 25
much smaller errors since several error sources shift the distribution in total (Ern et al.,
2004).) Nevertheless, it makes sense to compare CRISTA and Warner and McIntyre 4764
ACPD
6, 4755–4794, 2006 Some experimental constraints for a GW parameterization scheme M. Ern et al. Title Page Abstract Introduction Conclusions References Tables Figures J I J I Back CloseFull Screen / Esc
Printer-friendly Version Interactive Discussion model results for different choices of model parameters to quantify the sensitivity on
the different parameters, and to find out whether there is an optimal set of parameters. This optimal set of parameters would have to fulfill two main criteria: high correlation of the horizontal distributions and comparable values of GW-MF.
It should also be noted that the CRISTA data sets are only about one week of data 5
each and the results obtained in this paper are based on this limited data set only. This means some differences in the results could occur in other seasons and if meteorolog-ical conditions are different. However, there is evidence that the GW activity in August is similar in different years (Jiang et al., 2004b; Preusse et al.,2004; Preusse et al.,
2006). 10
In addition, CRISTA GW-MF is available only in limited altitude regions of about 20– 40 km for CRISTA-1 and 20–50 km for CRISTA-2. This means the altitudes around the mesopause where wind accelerations are maximum are not covered by the GW-MF data available.
4.1 Determination of an optimum model launch altitude by variation of s and λ∗z,launch 15
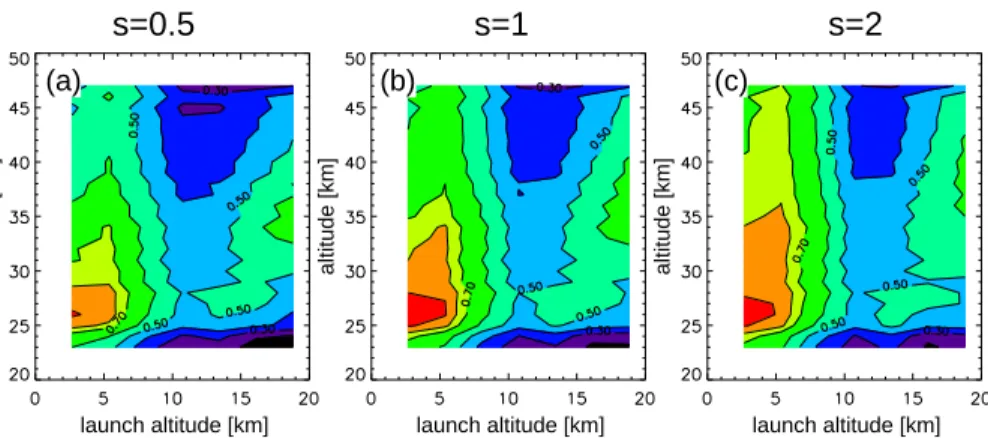
For the standard choice λ∗z,launch=2 km Figs.5and6show contour plots of the correla-tion coefficient between horizontal distributions of GW-MF of the Warner and McIntyre model and CRISTA as a reference. The results were obtained for the altitude range of available CRISTA GW-MF and seven different model launch altitudes from about 2.7 km to about 19 km (according to the UKMO pressure levels from 681 to 68.1 mbar). 20
Figure 5 shows the comparison with CRISTA-1 and Fig. 6 the comparison with CRISTA-2 GW-MF, respectively. Correlation coefficients are given for the spectral launch parameters s=0.5 (a), s=1 (b), and s=2 (c). As can be seen from Figs.5and6
for all choices of s: considering the whole range of measurement altitudes the correla-tion is highest for the second lowest launch level 464 mbar (launch latitude ∼5.4 km). It 25
is also very high for the lowest launch level 681 mbar (launch latitude ∼2.7 km). Since this result is similar also for other choices of launch parameters λ∗z,launch and s (not shown) we average the correlation coefficients over all altitudes for further
ACPD
6, 4755–4794, 2006 Some experimental constraints for a GW parameterization scheme M. Ern et al. Title Page Abstract Introduction Conclusions References Tables Figures J I J I Back CloseFull Screen / Esc
Printer-friendly Version Interactive Discussion isons.
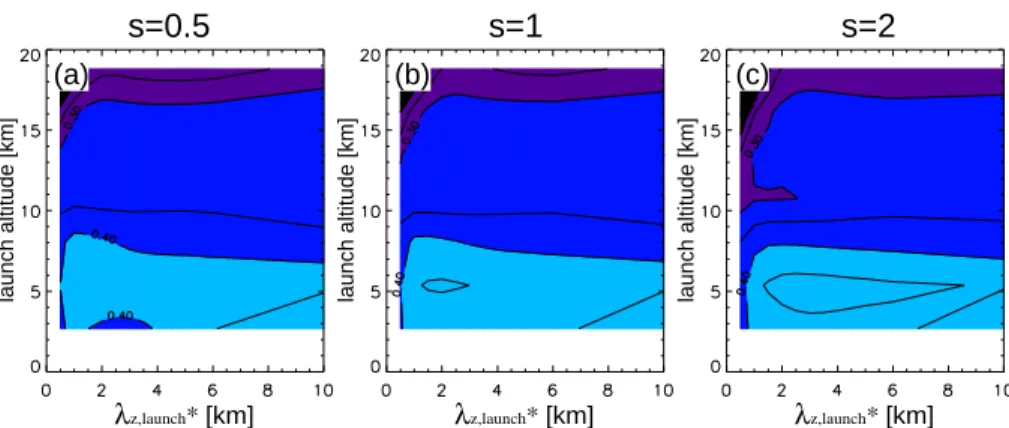
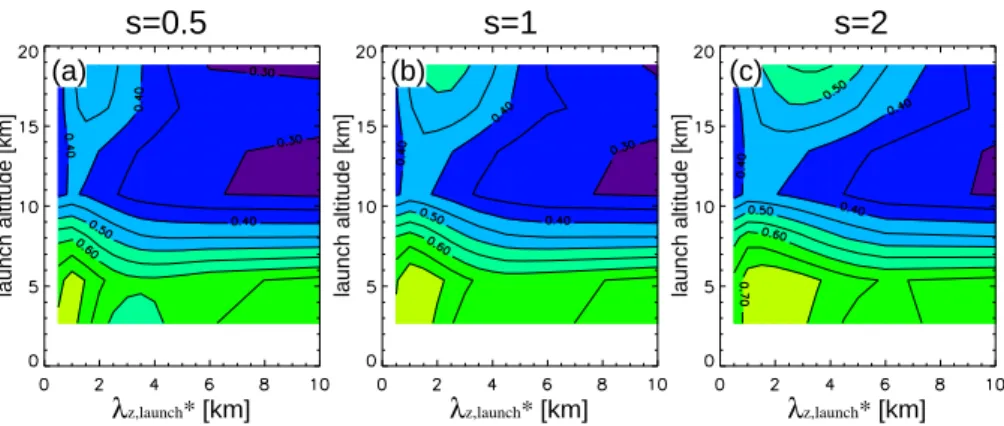
Results based on this vertical averaging are shown in Figs.7and8for CRISTA-1 and CRISTA-2, respectively. Figures7a–c and 8a–c show contour plots of the correlation coefficient averaged over the whole altitude range for different launch levels and differ-ent values of λ∗z,launch. Figures 7 and8 show the results for the choice (a) s=0.5, (b) 5
s=1, and (c) s=2. Again, from these figures it can be seen clearly that the correlation
is highest for the lowest two launch levels 681 and 464 mbar (∼2.7 and ∼5.4 km) with the 464 mbar launch level giving the best results.
This means that the launch level 464 mbar (∼5.4 km) is the best choice for both CRISTA-1 and CRISTA-2 and is some kind of compromise for a globally fixed value of 10
the launch altitude. This is valid for almost all choices of λ∗z,launch and s. Consequently, this launch level will be used for all following investigations.
4.2 Altitude dependence of λ∗z
To determine the correct value of λ∗z,launch=2π/m∗launch direct comparisons with mea-surements of the spectral shape of the GW vertical wavenumber spectrum would be 15
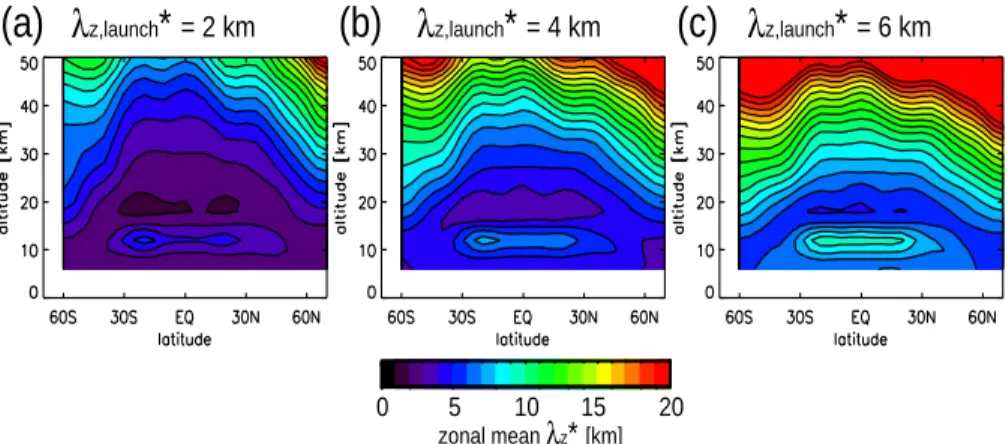
highly desirable. Figure 9 shows latitude altitude cross sections of zonal mean λ∗z for the CRISTA-1 period (Nov. 1994) obtained from the Warner and McIntyre scheme with the GW launch parameters s=1, launch level 464 mbar (∼ 5.4 km) and the choices
λ∗z,launch=2 km (a), λ∗z,launch=4 km (b), and λ∗z,launch=6 km (c). Figure10shows the same,
but for the CRISTA-2 period (Aug. 1997). 20
The Warner and McIntyre scheme calculates values mi* for all directions i , in which GW-MF is derived. In this paper always 4 directions are used (corresponding to the cardinal points). The values of m* used to calculate the values of λ∗z shown in Figs.9
and10 were obtained by calculating a mean of the single mi* components weighted by the squares of the associated GW-MF components without CRISTA observational 25
filter applied. This means the distributions shown in Figs.9and10are about what an ideal instrument would be measuring if the Warner and McIntyre model output would be the “truth”. However, it should be noted that, depending on the specific shape of
ACPD
6, 4755–4794, 2006 Some experimental constraints for a GW parameterization scheme M. Ern et al. Title Page Abstract Introduction Conclusions References Tables Figures J I J I Back CloseFull Screen / Esc
Printer-friendly Version Interactive Discussion the spectrum, the maximum of the GW-MF vertical wavenumber spectrum used in the
Warner and McIntyre scheme can be located at vertical wavelengths somewhat larger than the values of λ∗z shown.
From Figs. 9 and 10 can be seen that, starting from λ∗z,launch at the launch level 464 mbar, the value λ∗z basically increases with altitude. This well-known effect is 5
caused by growth of the GW amplitudes with altitude, leading to an extension of the saturated part of the vertical wavenumber spectrum towards lower m (longer vertical wavelengths) at higher altitudes (Fritts and VanZandt,1993;Gardner,1994). In addi-tion, there are also meridional variations mainly caused by Doppler shift of the vertical wavenumber spectrum due to the vertical profile of the horizontal wind.
10
If the directions of horizontal wind and GW-MF are anti-parallel the vertical wavenum-ber spectrum (this means also the location of m*) is Doppler shifted towards lower val-ues of m (higher λz) and wave breaking is reduced. Therefore GW-MF for the GWs propagating opposite to the wind direction can be higher than GW-MF for GWs with zero Doppler shift. This explains why for CRISTA-2 GW-MF is enhanced inside the 15
southern polar jet and also the values of high GW-MF in the northern subtropics caused by subtropical easterlies. The opposite way around, the vertical wavenumber spectrum of GWs propagating parallel to the direction of the prevailing wind is shifted towards higher values of m. In this case wave breaking is stronger and GW-MF is strongly reduced. Therefore the prevailing propagation direction of GWs inside the polar jet is 20
opposite to the wind direction.
It is a general feature of the λ∗z distributions shown in Figs. 9 and 10 that for low values of λ∗z,launch the average values of λ∗z are lower over the whole altitude range. In addition, the meridional structure of λ∗zis more pronounced for low values of λ∗z,launch(cf. Figs.9a and10a) than for higher values of λ∗z,launch (cf. Figs.9c and10c). This means 25
an instrument with the capability to measure the vertical wavenumber spectrum from about λ∗z . 2 km up to λ∗z & 20 km would be able to resolve the vertical λ∗z distribution and could give directly constraints to the launch value λ∗z,launch by a comparison with model data. However, up to date there is no experimental data set spanning such a
ACPD
6, 4755–4794, 2006 Some experimental constraints for a GW parameterization scheme M. Ern et al. Title Page Abstract Introduction Conclusions References Tables Figures J I J I Back CloseFull Screen / Esc
Printer-friendly Version Interactive Discussion wide interval of vertical wavelengths.
Some constraints can be inferred from the observations already mentioned in Sect.1
(Allen and Vincent,1995;Hertzog et al.,2001;Tsuda and Hocke,2002). The
exper-imental values of m* in the range of about 0.2–0.5 cycles/km (corresponding to λ∗z in the range 2–5 km) are valid for the lower stratosphere and mainly from low and mid-5
latitudes. If these values are compared to Figs. 9 and 10 we can conclude that the model parameter λ∗z,launch should not exceed about 4 km. Otherwise the model values of λ∗z would be too high in the lower stratosphere.
Further constraints of the parameter λ∗z,launch can be made by comparing measured and modeled distributions of GW-MF. Therefore a comparison of GW-MF absolute val-10
ues from CRISTA and the Warner and McIntyre scheme will be made in the following subsection to find possible ranges of λ∗z,launch, and maybe to find even an optimum value for λ∗z,launch.
4.3 Influence of λ∗z,launch and s on horizontal correlations and GW-MF absolute values 4.3.1 Variation of λ∗z,launch and s
15
From Sect.3we have seen that the standard choice of GW launch parameters (s=1,
λ∗z,launch=2 km) used in the Warner and McIntyre scheme already provides good
agree-ment with the horizontal structures found in CRISTA GW-MF absolute values. To find out whether this agreement can be further improved and whether the low-bias of model GW-MF compared to CRISTA values can be reduced the values λ∗z,launch=2π/m∗launch 20
and s have been varied.
Figures11a–c show deviations between horizontal distributions of GW-MF absolute values calculated with the Warner and McIntyre scheme and CRISTA-1 GW-MF as a reference. The reciprocal has been taken from deviations <1 (at low λ∗z,launch) to have the same color scale for GW-MF deviations in both directions. The deviations 25
were obtained from linear fits through the origin from scatter plots of model GW-MF vs. CRISTA GW-MF for every pair of horizontal maps. The logarithm of the GW-MF values
ACPD
6, 4755–4794, 2006 Some experimental constraints for a GW parameterization scheme M. Ern et al. Title Page Abstract Introduction Conclusions References Tables Figures J I J I Back CloseFull Screen / Esc
Printer-friendly Version Interactive Discussion has been used for the fits to avoid over-weighting of low values of GW-MF (see also
Ern et al.,2004,2005).
The Warner and McIntyre GW-MF was calculated for the launch level 464 mbar and different altitudes and values λ∗z,launch=2π/m∗launch.
Figure11a is for s=0.5, (b) for s=1, and (c) for s=2. Low deviations (blue and purple 5
colors) are found in the λ∗z,launch range of about 2–5 km. Model values are lower than CRISTA-1 GW-MF to the left and higher to the right of the contour line labeled “1”. At values λ∗z,launch<1.5 km the model values are lower than the CRISTA-1 values by
over a factor of 5–10 and outside the error margins. This deviation is too large to be compensated by other launch parameters. Therefore values of λ∗z,launch<1.5 km are
10
not realistic. On the other hand for λ∗z,launch>6 km the GW-MF model values exceed
CRISTA-1 GW-MF by over a factor of 4–5, suggesting that also values λ∗z,launch>6 km
are not realistic.
The different choices of s in Figs.11a–c have almost no effect on this general be-havior. Solely on average the model values for s=0.5 (Fig.11a) are somewhat higher 15
and the model values for s=2 (Fig.11c) are somewhat lower than the results for s=1 (Fig.11b). As a consequence, the contour line labeled “1” is slightly shifted towards lower values of λ∗z,launch for s=0.5 and towards higher values λ∗z,launchfor s=2.
In Figs.11d–f correlations between the horizontal distributions of Warner and McIn-tyre and CRISTA-1 GW-MF absolute values are shown for (d) s=0.5, (e) s=1, and (f) 20
s=2. Similar as in Fig.5the correlation increases with altitude. Except for the lowest values λ∗z,launch<1 km the correlation is almost independent from λ∗z,launch.
In Figs.12a–c the deviations of GW-MF values between model and instrument for the 464 mbar launch level are given for the CRISTA-2 case. Again, (a) shows the results for s=0.5, (b) for s=1, and (c) for s=2. The general behavior is similar as for the 25
CRISTA-1 comparison. However, there is a tilt between CRISTA-2 and model GW-MF absolute values with altitude (about a factor of 2 from 25 to 45 km). For the Warner and McIntyre/CRISTA-2 comparison even values of λ∗z,launch as high as 8–10 km would be possible without too serious deviations between the magnitudes of model and
ACPD
6, 4755–4794, 2006 Some experimental constraints for a GW parameterization scheme M. Ern et al. Title Page Abstract Introduction Conclusions References Tables Figures J I J I Back CloseFull Screen / Esc
Printer-friendly Version Interactive Discussion 2 GW-MF values. Again, the choice of s causes only minor shifts of the absolute values.
Figures 12d–f show the correlation coefficients for the model vs. CRISTA-2 com-parison with model launch level 464 mbar. The behavior of the correlation coefficients is completely different from the results obtained for the CRISTA-1 comparison. For CRISTA-2 correlation is maximum for low values of λ∗z,launch, minimum for λ∗z,launch in 5
the range of about 4–8 km, and there is again higher correlation (but less pronounced) for λ∗z,launch >8 km. The exact location of the maxima and minima changes with the
choice of s. Especially the choice of s=2 produces a broader range of maximum cor-relation at values λ∗z,launch in the range from about 1–4 km.
4.3.2 Variation of λ∗z,launch and s: discussion of results 10
Determining a best choice global set of launch parameters for the Warner and McIntyre scheme, i.e. suitable values of λ∗z,launch, s and the launch level, means to weight the different results appropriately and to compromise between the two CRISTA flights. This will be aimed at in the following discussion. To decide whether a certain combination
of λ∗z,launch and s provides good agreement of CRISTA and model GW-MF two criteria
15
have to be fulfilled.
As a first criterion the deviation between CRISTA and Warner and McIntyre values of GW-MF can be used (absolute value criterion). The deviation between CRISTA and Warner and McIntyre results should not exceed a factor of about 4–5 given by the error ranges of the data. The distribution of the correlations shown in Figs.11and12
20
can serve as a second criterion (correlation criterion): The ranges of λ∗z,launch with the highest correlation will be favored.
The general behavior of the GW-MF deviations, apart from some tilt with altitude between CRISTA and model GW-MF values and some shifts in the model value due to different choices of s, is as follows: The deviations are minimum for λ∗z,launch in the 25
range of about 2.5–4 km, model values are too low for about λ∗z,launch<2 km and too high
for λ∗z,launch>6–10 km. More exact values for the different choices of s are summarized
in Table1in the column for the absolute value criterion. This gives a first constraint to 4770
ACPD
6, 4755–4794, 2006 Some experimental constraints for a GW parameterization scheme M. Ern et al. Title Page Abstract Introduction Conclusions References Tables Figures J I J I Back CloseFull Screen / Esc
Printer-friendly Version Interactive Discussion the possible range of λ∗z,launch.
As can be seen from Figs.11a–c for the CRISTA-1 case there are almost no further constraints from the correlation criterion.
There is much stronger variation of the correlation for CRISTA-2. Usually there is a region of high correlation at low values of λ∗z,launch ranging from low to high altitudes 5
and also a region of higher correlation at values of λ∗z,launch>6 km. The region at high
λ∗z,launch shows high correlation only at altitudes 25–40 km and correlation is lower at
lower and higher altitudes. Nevertheless, this region is listed in Table1for the sake of completeness.
Resulting λ∗z,launch ranges (see Table 1) have been determined by combining the 10
limitations given by the absolute value and the correlation criterion. In addition, the resulting ranges have been limited to values of λ∗z,launch≤4km because values of λ∗z,launch higher than about 4 km result in too high λ∗z in the lower stratosphere (see Sect.4.2).
From Table1we can see that for CRISTA-2 and s=0.5 the resulting range is empty. In the regions of high correlation the deviations from the CRISTA-2 GW-MF values are too 15
large. This indicates that a common global value of s=0.5 would not be a good choice. Combining the resulting ranges of CRISTA-1 and CRISTA-2 for s=1 and s=2 gives us possible λ∗z,launch ranges of about 2.5–3 and 2.5–4 km, respectively. However, for CRISTA-2 and s=1 as a compromise we have to accept somewhat reduced correlation at altitudes above 35 km. This situation is improved for s=2.
20
We have also determined optimum ranges of λ∗z,launch (see Table 1) by considering only the part of the resulting ranges with deviations less than a factor of about 2 for CRISTA-1. For CRISTA-2 it is more important to choose λ∗z,launch in a way to obtain correlation as high as possible from low to high altitudes.
Therefore we choose as optimum values for CRISTA-2 the lower limit of the resulting 25
λ∗z,launch ranges. Combining the optimum values from CRISTA-1 and CRISTA-2 gives
us optimum values of λ∗z,launch=2.5 km for s=1 and λ∗z,launch=3.0 km for s=2.
As can be summarized, a common global value of λ∗z,launch lower than about 2.0– 2.5 km is unlikely because model GW-MF is too low compared to CRISTA GW-MF. On
ACPD
6, 4755–4794, 2006 Some experimental constraints for a GW parameterization scheme M. Ern et al. Title Page Abstract Introduction Conclusions References Tables Figures J I J I Back CloseFull Screen / Esc
Printer-friendly Version Interactive Discussion the other hand, to preserve the high correlation for the CRISTA-2 case at low λ∗z,launch,
an increase of λ∗z,launch to values over about 3 km does not seem to be justified. This gives us a quite narrow range of λ∗z,launch which is compatible with both CRISTA mis-sions for s=1 and s=2. Since s=2 gives the largest resulting range of λ∗z,launch this value might be better suited than s=1. For s=0.5 no resulting λ∗z,launch range can be 5
found for CRISTA-2. This means values of s and λ∗z,launch somewhat higher than the standard values s=1 and λ∗z,launch=2 km are the best choice.
Optimum values of λ∗z,launch=2.5–3.0 km still produce a notable low-bias (about a factor of 2–3) of the model GW-MF compared to CRISTA GW-MF. This low-bias could be reduced, for example, by increasing the model parameter β (see Sect.1) by a factor 10
of 2. However, it should also be kept in mind that CRISTA GW-MF could be somewhat high-biased due to additional GW sources (e.g., mountain waves) not considered in the parameterization scheme and that deviations of a factor of 2–3 are inside the error limits.
5 Influence of λ∗z,launch and s on the vertical distribution of GW drag
15
One of the main purposes of a GW parameterization scheme is to provide realistic values of GW drag so that winds calculated in GCMs are more reliable. In this section we investigate whether the ranges of λ∗z,launch and s derived in the previous section are compatible with measurements and theoretical considerations. To check whether the different choices of launch parameters discussed above give reasonable results 20
the zonal mean zonal GW drag has been calculated for some selected cases. As at-mospheric background the same composite wind and temperature field was used as
in (Preusse et al.,2006): From 0–28 km altitude European Centre for Medium-Range
Weather Forecasts (ECMWF) reanalyses were used (Coy and Swinbank,1997). For al-titudes 20–85 km 2 temperatures and geostrophic wind derived from CRISTA-25
2 data were used (Oberheide et al.,2002). Above 70 km COSPAR International Refer-ence Atmosphere (CIRA) climatological data were used (Chandra et al.,1990). At the
ACPD
6, 4755–4794, 2006 Some experimental constraints for a GW parameterization scheme M. Ern et al. Title Page Abstract Introduction Conclusions References Tables Figures J I J I Back CloseFull Screen / Esc
Printer-friendly Version Interactive Discussion overlapping altitudes smooth transitions were generated by applying weighted means.
The results obtained from the Warner and McIntyre scheme are shown in Fig.13. The peak values of GW drag are about the same in all cases shown, however, there are significant differences in the vertical distributions of GW drag.
Figures13a–c show the influence of different values s for fixed λ∗z,launch=2 km. For 5
s=0.5 (Fig.13a) GW-MF is higher in the unsaturated part of the launch spectrum than for the standard case with s=1 (Fig. 13b). Therefore for s=0.5 a larger part of the GW spectrum is saturated already at lower altitudes, leading to somewhat higher GW drag already at lower altitudes than in the standard case (see Figs.13a and b). Ac-cordingly, for s=2 (Fig.13c) a shift of high GW drag towards higher altitudes would be 10
expected because GW-MF in the unsaturated part of the launch spectrum is reduced and GW breaking postponed towards higher altitudes. Comparing Figs.13b and c this is observed, indeed.
Figures13d–f show the influence of different λ∗z,launch on the GW drag vertical distri-bution. The results of Fig.13d were obtained with λ∗z,launch=1 km and s=1. This means 15
a larger part of the launch spectrum is unsaturated. And, as expected, in Fig.13d the regions of GW breaking and high GW-MF are shifted to higher altitudes than in the standard case with λ∗z,launch=2 km and s=1 (Fig.13b). For example, in Fig.13d at the southernmost latitudes there is a peak of GW drag at altitudes above 90 km and only moderate values of GW drag below. This distribution of GW drag does not seem to 20
be realistic because there are indications for GW breaking already at lower altitudes of about 50–60 km at the top of the southern polar jet (Preusse et al.,2006). Therefore higher values of GW drag are expected already in the altitude region 50–60 km. This confirms that the choice of λ∗z,launch=1 km is too low.
In Fig.13e the launch parameters were λ∗z,launch=4 km and s=1. Choosing a higher 25
value of λ∗z,launchimplicates a larger saturated part of the launch spectrum. Correspond-ingly in Fig.13e already at altitudes as low as 30 km relatively high GW drag values of about 10–15 m/s/day can be found in the region of the southern polar jet. Increasing
s to a value of 2 (Fig.13f) cannot reduce this effect significantly.
ACPD
6, 4755–4794, 2006 Some experimental constraints for a GW parameterization scheme M. Ern et al. Title Page Abstract Introduction Conclusions References Tables Figures J I J I Back CloseFull Screen / Esc
Printer-friendly Version Interactive Discussion Using a value of λ∗z,launch=10 km (not shown) leads to GW drag values of up to
50 m/s/day already at altitudes of 25 km. From theoretical considerations maximum values of about 2 m/s/day at these altitudes would be expected (e.g.,Alexander and
Rosenlof,1996). Measurements can exceed this value by more than a factor of two (e.g.,Sato,1994). Nevertheless, the very high values of GW drag at low altitudes ob-5
tained for λ∗z,launch=10 km seem to be unrealistic. An increase of λ∗z,launchover a value of about 4 km therefore does not seem to make sense. This gives us another consistency check for the reasonable ranges of λ∗z,launch deduced from Table1.
Increasing of the model parameter β (see Sect. 1) to reduce the low-bias of model GW-MF as suggested in Sect.4.3.2makes sense because for the CRISTA-2 case peak 10
values of acceleration calculated with the Warner and McIntyre scheme in the upper mesosphere are about 50 m/s/day for the standard launch parameters (see Fig.13b) and only a little higher for the optimum launch parameters shown in Table1. On the other hand monthly mean values of GW-MF derived from radar observations can be as high as 100–200 m/s/day (Hocking,2005). This means higher values of β than the 15
standard value of ∼ 0.1 are not in contradiction with observations. In fact, a value of
β=0.2 would result in peak values comparable to those reported byHocking(2005). Another important point can be seen from Fig.13: There are high values of GW drag not only in the winter hemisphere at the top of the southern polar jet, but also in the northern hemisphere where only little GW-MF was observed by CRISTA (see above) 20
and also only low temperature variances are observed at higher altitudes (Preusse et
al.,2006). This means that GW-MF and GW drag are too high in the model results. Again, this is a clear indication that the assumption of a global launch distribution for GW parameterization schemes is too simple and global measurements of GW-MF es-pecially in the mesosphere and the mesopause region over a full annual cycle are in 25
need to give further constraints to the GW-MF launch distribution.
ACPD
6, 4755–4794, 2006 Some experimental constraints for a GW parameterization scheme M. Ern et al. Title Page Abstract Introduction Conclusions References Tables Figures J I J I Back CloseFull Screen / Esc
Printer-friendly Version Interactive Discussion
6 Summary and conclusions
In this paper absolute values of GW-MF derived from the CRISTA-1 (November 1994) and CRISTA-2 (August 1997) satellite missions have been compared to GW-MF ab-solute values calculated with the Warner and McIntyre GW parameterization scheme for these two periods. Horizontal structures of GW-MF can be reproduced already by 5
using the standard set of Warner and McIntyre launch parameters (λ∗z,launch=2 km and
s=1) if a low launch level is used. For this standard set of launch parameters the
model values of GW-MF are considerably lower, however, this set of parameters is al-ready some kind of compromise, considering the large error range of about a factor of 4–5 for the GW-MF absolute values.
10
The best correlation between CRISTA and Warner and McIntyre horizontal distribu-tions is achieved for the second lowest model launch level 464 mbar (i.e. about 5.4 km). This maximum correlation is a persistent feature for both CRISTA flights and almost all choices of spectral launch parameters λ∗z,launch and s.
Possible ranges of λ∗z,launch have been determined by optimizing the agreement of 15
GW-MF absolute values as well as the correlation between CRISTA and model dis-tributions of GW-MF and by considering the vertical distribution of λ∗z. The resulting range for λ∗z,launchis about 2–4 km, depending on s. The value s=2 gives better overlap between the ranges obtained for the absolute value criterion on the one hand and the correlation criterion on the other hand. Using the vertical distribution of GW drag as 20
cross-check confirms the derived λ∗z,launchrange of about 2–4 km.
This means there are some indications that λ∗z,launchshould be somewhat larger than the standard value of 2 km, but not very much larger (maybe λ∗z,launch=2.5–3.0 km). In addition, the parameter s should be increased to s=2, reducing the spectral power in the unsaturated part of the GW vertical wavenumber spectrum. The remaining low-25
bias of the model GW-MF with respect to the CRISTA estimates could be reduced by increasing the model input parameter β by a factor of about 2 (this would also increase the GW-MF values as well as the GW drag values by a factor of 2) without causing
ACPD
6, 4755–4794, 2006 Some experimental constraints for a GW parameterization scheme M. Ern et al. Title Page Abstract Introduction Conclusions References Tables Figures J I J I Back CloseFull Screen / Esc
Printer-friendly Version Interactive Discussion incompatibilities with radar observations of GW drag.
The choice of such a global set of model launch parameters should be made with some caution for some reasons. First, the error ranges of GW-MF are relatively large, even though part of the error will be a systematic error and relative variations of GW-MF in the horizontal distributions are highly significant. Of course, this large error range, 5
as well as the fact that CRISTA is only a very limited data set of two weeks of measure-ments in a limited altitude interval, will put some uncertainty on the determined ranges of model parameters. Second, the choice of a global set of launch parameters itself is a problem. Already from the CRISTA versus Warner and McIntyre model comparison there are some indications for localized GW sources which cannot be reproduced by 10
the model. In addition, there are high values of model GW drag in northern latitudes and at the same time only little GW activity at high northern latitudes during CRISTA-2. This indicates that there should be some annual cycle in the GW sources at middle and high latitudes which is not incorporated in the model.
Therefore we conclude that to overcome the limitation of GW parameterization 15
schemes to a fixed set of launch parameters detailed global measurements of the GW source distribution over a full annual cycle are highly desirable.
Acknowledgements. This work was funded through Deutsche Forschungsgemeinschaft (DFG) project GW-CODE (ER 474/1-1), DFG priority program CAWSES SPP 1176.
References
20
Alexander, M. J. and Rosenlof, K. H.: Nonstationary gravity wave forcing of the stratospheric zonal mean wind, J. Geophys. Res., 101, 23 465–23 476, 1996. 4774
Allen, S. J. and Vincent R. A.: Gravity wave activity in the lower atmosphere: Seasonal and latitudinal variations, J. Geophys. Res., 100, 1327–1350, 1995. 4757,4768
Beres, J. H., Garcia, R. R., Boville, B. A., and Sassi, F.: Implementation of a gravity
25
wave source spectrum parameterization dependent on the properties of convection in the Whole Atmosphere Community Climate Model (WACCM), J. Geophys. Res., 110, D10108, doi:10.1029/2004JD005504, 2005. 4759
ACPD
6, 4755–4794, 2006 Some experimental constraints for a GW parameterization scheme M. Ern et al. Title Page Abstract Introduction Conclusions References Tables Figures J I J I Back CloseFull Screen / Esc
Printer-friendly Version Interactive Discussion
Chandra, S., Fleming, E. L., Schoeberl, M. R., and Barnett, J. J.: Monthly mean climatology of temperature, wind, geopotential height, and pressure for 0–120 km, Adv. Space Res., 10, 3–12, 1990. 4772
Chun, H. Y. and Baik, J. J.: Momentum flux by thermally induced internal gravity waves and its approximation for large-scale models, J. Atmos. Sci., 55, 3299–3310, 1998. 4759
5
Chun, H. Y. and Baik, J. J.: An updated parameterization of convectively forced gravity wave drag for use in large-scale models, J. Atmos. Sci., 59, 1006–1017, 2002. 4759
Cot, C.: Equatorial mesoscale wind and temperature fluctuations in the lower atmosphere, J. Geophys. Res., 106, 1523–1532, 2001. 4757
Coy, L. and Swinbank, R.: Characteristics of stratospheric winds and temperatures produced
10
by data assimilation, J. Geophys. Res., 102, 25 763–25 781, 1997. 4772
Eckermann, S. D. and Preusse, P.: Global measurements of stratospheric mountain waves from space, Science, 286, 1534–1537. 4762
Eckermann, S. D., Broatman, D., Tan, K. A., Preusse, P., and Bacmeister, J. T.: Mountain Waves in the Stratosphere, NRL-Review, 73–84, 2000. 4759
15
Ern, M., Preusse, P., Alexander, M. J., and Warner, C. D.: Absolute values of grav-ity wave momentum flux derived from satellite data, J. Geophys. Res., 109, D20103, doi:10.1029/2004JD004752, 2004. 4759,4760,4761,4762,4763,4764,4769
Ern, M., Preusse, P., and Warner, C. D.: A comparison between CRISTA satellite data and Warner and McIntyre gravity wave parameterization scheme: horizontal and vertical
20
wavelength filtering of gravity wave momentum flux, Adv. Space Res., 35, 2017–2023, doi:10.1016/j.asr.2005.04.109, 2005. 4760,4762,4763,4769
Fritts, D. C. and VanZandt, T. E.: Spectral estimates of gravity wave energy and momentum fluxes. Part I: Energy dissipation, acceleration, and constraints, J. Atmos. Sci., 50(22), 3685– 3694, 1993. 4767
25
Fritts, D. C. and Alexander, M. J.: Gravity wave dynamics and effects in the middle atmosphere, Rev. Geophys., 41(1), 1003, doi:10.1029/2001RG000106, 2003. 4756,4757,4758
Gardner, C. S.: Diffusive filtering theory of gravity wave spectra in the atmosphere, J. Geophys. Res., 99, 20 601–20 622, 1994. 4767
Hertzog, A. and Vial, F.: A study of the dynamics of the equatorial lower stratosphere by use of
30
ultra-long-duration balloons, 2, Gravity waves, J. Geophys. Res., 106, 22 745–22 761, 2001.
4757
Hertzog, A., Souprayen, C., and Hauchecorne, A.: Measurements of gravity wave activity in the
ACPD
6, 4755–4794, 2006 Some experimental constraints for a GW parameterization scheme M. Ern et al. Title Page Abstract Introduction Conclusions References Tables Figures J I J I Back CloseFull Screen / Esc
Printer-friendly Version Interactive Discussion
lower stratosphere by Doppler lidar, J. Geophys. Res., 106, 7879–7890, 2001. 4757,4768
Hertzog, A., Vial, F., Mechoso, C. R., Basdevant, C., and Cocquerez, P.: Quasi-Lagrangian measurements in the lower stratosphere reveal an energy peak associated with near-inertial waves, Geophys. Res. Lett., 29, 1229–1232, 2002. 4757
Hines, C. O.: Doppler-spread parameterization of gravity-wave momentum deposition in the
5
middle atmosphere. Part 1: Basic formulation, J. Atmos. Solar-Terr. Phys., 54, 371–386, 1997. 4757
Hines, C. O.: Doppler-spread parameterization of gravity-wave momentum deposition in the middle atmosphere. Part 2: Broad and quasi monochromatic spectra and implementation, J. Atmos. Solar-Terr. Phys., 54, 387–400, 1997. 4757
10
Hocking, W. K.: A new approach to momentum flux determination using SKiYMET meteor radars, Ann. Geophys., 23, 2433–2439, 2005. 4774
Jiang, J. H., Eckermann, S. D., Wu, D. L., and Ma, J.: A search for mountain waves in MLS stratospheric limb radiances from the winter Northern Hemisphere: Data analysis and global mountain wave modeling, J. Geophys. Res., 109, D03107, doi:10.1029/2003JD003974,
15
2004. 4762
Jiang, J. H., Wang, B., Goya, K., Hocke, K., Eckermann, S. D., Ma, J., Wu, D. L., and Read, W. J.: Geographical distribution and interseasonal variability of tropical deep convection: UARS MLS observations and analyses, J. Geophys. Res., 109, D03111, doi:10.1029/2003JD003756, 2004. 4765
20
Kim, Y. J., Eckermann, S. D., and Chun, H. Y.: An overview of the past, present and future of gravity-wave drag parameterization for numerical climate and weather prediction models, Atmos. Ocean, 41, 65–98, 2003. 4757
McFarlane, N. A.: The effect of orographically excited wave drag on the general circulation of the lower stratosphere and troposphere, J. Atmos. Sci., 44, 1775–1800, 1987. 4756,4759 25
Medvedev, A. S. and Klaassen, G. P.: Vertical evolution of gravity wave spectra and the param-eterization of associated wave drag, J. Geophys. Res., 100, 25 841–25 853, 1995. 4757
Nastrom, G. D., VanZandt, T. E., and Warnock, J. M.: Vertical wavenumber spectra of winds and temperature from high-resolution balloon soundings over Illinois, J. Geophys. Res., 102, 6685–6701, 1997. 4757
30
Oberheide, J., Lehmacher, G. A., Offermann, D., Grossmann, K. U., Manson, A. H., Meek, C. E., Schmidlin, F. J., Singer, W., Hoffmann, P., and Vincent, R. A.: Geostrophic wind fields in the stratosphere and mesosphere from satellite data, J. Geophys. Res., 107, 8175,
ACPD
6, 4755–4794, 2006 Some experimental constraints for a GW parameterization scheme M. Ern et al. Title Page Abstract Introduction Conclusions References Tables Figures J I J I Back CloseFull Screen / Esc
Printer-friendly Version Interactive Discussion
doi:10.1029/2001JD000655, 2002. 4772
Offermann, D., Grossmann, K. U., Barthol, P., Knieling, P., Riese, M., and Trant, R.: CRyogenic Infrared Spectrometers and Telescopes for the Atmosphere (CRISTA) experiment and middle atmosphere variability, J. Geophys. Res., 104, 16 311–16 325, 1999. 4759
Preusse, P., D ¨ornbrack, A., Eckermann, S. D., Riese, M., Schaeler, B., Bacmeister, J. T.,
Brout-5
man, D., and Grossmann, K. U.: Space based measurements of stratospheric mountain waves by CRISTA, 1. Sensitivity, analysis method and a case study, J. Geophys. Res., 107, 8178, doi:10.1029/2001JD000699, 2002. 4760,4762
Preusse, P., Ern, M., Grossmann, K. U., and Mergenthaler, J. L.: Seasonal variations of gravity wave variance inferred from CLAES, Proc. SPIE, 5235, 288–297, 2004. 4765
10
Preusse, P., Ern, M., Eckermann, S. D., Warner, C. D., Picard, R. H., Knieling, P., Krebsbach, M., Russell, J. M., Mlynczak, M. G., Mertens, C. J., and Riese, M.: Tropopause to mesopause gravity waves in August: measurement and modeling, J. Atmos. Solar-Terr. Phys., in print, 2006. 4765,4772,4773,4774
Riese, M., Spang, R., Preusse, P., Ern, M., Jarisch, M., Offermann, D., and Grossmann,
15
K. U.: Cryogenic Infrared Spectrometers and Telescopes for the Atmosphere (CRISTA) data processing and atmospheric temperature and trace gas retrieval, J. Geophys. Res., 104, 16 349–16 367, 1999. 4759
Riese, M., Friedl-Vallon, F., Spang, R., Preusse, P., Schiller, C., Hoffmann, L., Konopka, P., Oelhaf, H., von Clarmann, T., and H ¨opfner, M.: GLObal limb Radiance Imager
20
for the Atmosphere (GLORIA): Scientific objectives, Adv. Space Res., 36, 989–995, doi:10.1016/j.asr.2005.04.115, 2005. 4760
Sato, K.: Small-scale wind disturbances observed by the MU radar during the passage of Typhoon Kelly, J. Atmos. Sci., 50, 518–537, 1993. 4757
Sato, K.: A statistical study of the structure, saturation and sources of inertio-gravity waves in
25
the lower stratosphere observed with the MU radar, J. Atmos. Solar-Terr. Phys., 56, 755–774, 1994. 4757,4774
Swinbank, R. and O’Neill, A.: A stratosphere-troposphere data assimilation system, Mon. Weather Rev., 122, 686–702, 1994. 4762
Tsuda, T., Inoue, T., Fritts, D. C., VanZandt, T. E., Kato, S., Sato, T., and Fukao, S.: MST radar
30
observations of a saturated gravity wave spectrum, J. Atmos. Sci., 46, 2440–2447, 1989.
4757
Tsuda, T., VanZandt, T. E., Mizumoto, M., Kato, S., and Fukao, S.: Spectral analysis of
ACPD
6, 4755–4794, 2006 Some experimental constraints for a GW parameterization scheme M. Ern et al. Title Page Abstract Introduction Conclusions References Tables Figures J I J I Back CloseFull Screen / Esc
Printer-friendly Version Interactive Discussion
ature and Brunt-Vaisala frequency fluctuations observed by radiosondes, J. Geophys. Res., 96, 17 265–17 278, 1991. 4757
Tsuda, T. and Hocke, K.: Vertical wave number spectrum of temperature fluctuations in the stratosphere using GPS occultation data, J. Meteorol. Soc. Japan, 80, 925–938, 2002. 4757,
4768 5
Tsuda T., Ratnam, M. V., May, P. T., Alexander, M. J., Vincent, R. A., and MacKinnon, A.: Characteristics of gravity waves with short vertical wavelengths observed with radiosonde and GPS occultation during DAWEX (Darwin Area Wave Experiment), J. Geophys. Res., 109, D20S03, doi:10.1029/2004JD004946, 2004. 4757
VanZandt, T. E.: A universal spectrum of buoyancy waves in the atmosphere, Geophys. Res.
10
Lett., 9, 575–578, 1982. 4757
Warner, C. D. and McIntyre, M. E.: On the propagation and dissipation of gravity wave spectra through a realistic middle atmosphere, J. Atmos. Sci., 53, 3213–3235, 1996. 4758
Warner, C. D. and McIntyre, M. E.: Toward an ultra-simple spectral gravity wave parameteriza-tion for general circulaparameteriza-tion models, Earth Planets Space, 51, 475–484, 1999. 4758
15
Warner, C. D. and McIntyre, M. E.: An ultrasimple spectral parameterization for nonorographic gravity waves, J. Atmos. Sci., 58, 1837–1857, 2001.
4756,4757,4758
ACPD
6, 4755–4794, 2006 Some experimental constraints for a GW parameterization scheme M. Ern et al. Title Page Abstract Introduction Conclusions References Tables Figures J I J I Back CloseFull Screen / Esc
Printer-friendly Version Interactive Discussion
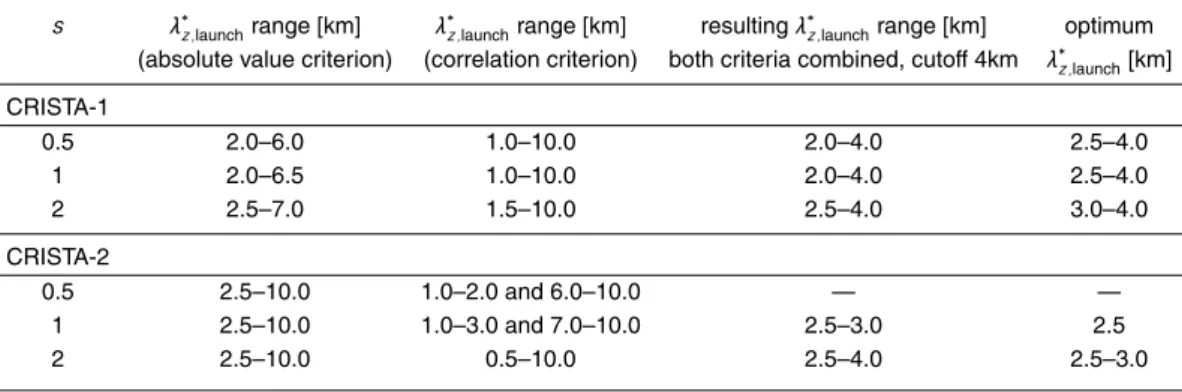
Table 1. Possible λ∗z,launchranges for the second lowest launch level (464 mbar, i.e. ∼5.4 km).
s λ∗
z,launchrange [km] λ ∗
z,launchrange [km] resulting λ ∗
z,launchrange [km] optimum (absolute value criterion) (correlation criterion) both criteria combined, cutoff 4km λ∗z,launch[km] CRISTA-1 0.5 2.0–6.0 1.0–10.0 2.0–4.0 2.5–4.0 1 2.0–6.5 1.0–10.0 2.0–4.0 2.5–4.0 2 2.5–7.0 1.5–10.0 2.5–4.0 3.0–4.0 CRISTA-2 0.5 2.5–10.0 1.0–2.0 and 6.0–10.0 — — 1 2.5–10.0 1.0–3.0 and 7.0–10.0 2.5–3.0 2.5 2 2.5–10.0 0.5–10.0 2.5–4.0 2.5–3.0 4781
ACPD
6, 4755–4794, 2006 Some experimental constraints for a GW parameterization scheme M. Ern et al. Title Page Abstract Introduction Conclusions References Tables Figures J I J I Back CloseFull Screen / Esc
Printer-friendly Version Interactive Discussion
vertical wavenumber m
GW momentum flux spectral density
part 1 part 2
m*
~ms
~m-t
Fig. 1. GW momentum flux vertical wavenumber spectrum used in the Warner and McIntyre
GW scheme at the model launch level. The spectrum consists of two parts: the unsaturated part (part 1, m<m∗) is ∼ms, the saturated part (part 2, m>m∗) is ∼m−t.
ACPD
6, 4755–4794, 2006 Some experimental constraints for a GW parameterization scheme M. Ern et al. Title Page Abstract Introduction Conclusions References Tables Figures J I J I Back CloseFull Screen / Esc
Printer-friendly Version Interactive Discussion (b) CRISTA-2 (Aug. 97)
zonal wind [m/s]
(a) CRISTA-1 (Nov. 94)
zonal wind [m/s]
Fig. 2. Zonal mean zonal wind for CRISTA-1 (a) and CRISTA-2 (b) calculated from UKMO data
interpolated to CRISTA measurement times and locations. Zero wind is represented by a bold contour line. Please note that the color code is different in (a) and (b).