HAL Id: hal-00299021
https://hal.archives-ouvertes.fr/hal-00299021
Submitted on 1 Jan 2003
HAL is a multi-disciplinary open access
archive for the deposit and dissemination of
sci-entific research documents, whether they are
pub-lished or not. The documents may come from
teaching and research institutions in France or
abroad, or from public or private research centers.
L’archive ouverte pluridisciplinaire HAL, est
destinée au dépôt et à la diffusion de documents
scientifiques de niveau recherche, publiés ou non,
émanant des établissements d’enseignement et de
recherche français ou étrangers, des laboratoires
publics ou privés.
Preseismic ULF electromagnetic effect from observation
at Kamchatka
O. Molchanov, A. Schekotov, E. Fedorov, G. Belyaev, E. Gordeev
To cite this version:
O. Molchanov, A. Schekotov, E. Fedorov, G. Belyaev, E. Gordeev. Preseismic ULF electromagnetic
effect from observation at Kamchatka. Natural Hazards and Earth System Science, Copernicus
Pub-lications on behalf of the European Geosciences Union, 2003, 3 (3/4), pp.203-209. �hal-00299021�
Natural Hazards and Earth System Sciences (2003) 3: 203–209 c
European Geosciences Union 2003
Natural Hazards
and Earth
System Sciences
Preseismic ULF electromagnetic effect from observation at
Kamchatka
O. Molchanov1, A. Schekotov1, E. Fedorov1, G. Belyaev1, and E. Gordeev2 1Institute of the Physics of the Earth, Moscow, Russia
2Institute of Geophysical Survey, Petropavlovsk-Kamchatski, Russia
Received: 28 May 2002 – Revised: 30 September 2002 – Accepted: 7 October 2002
Abstract. Some results of ULF magnetic field observation
at Karimshino site (Kamchatka, Russia) since June 2000 to September 2001 are presented here. Using case study we have found an effect of suppression of ULF intensity about 2–6 days before rather strong and nearby seismic shocks (magnitude M = 4.0 − 6.2). It is revealed for nighttime and horizontal component of ULF field (G) in the frequency range 0.01 − 0.1 Hz. Then we prove the reliability of the effect by computed correlation between G (or 1/G) and spe-cially calculated seismic indexes Ks for the whole period
of observation. Basing on the simple criteria we conclude that reliability of seismo-associated ULF suppression effect is comparable with well-known effect of connection between ULF variation and Kp index of global magnetic activity. It
seems the reason of suppression is located at the atmosphere or ionosphere but not in the ground medium.
1 Introduction
It is recognized now that analysis of seismic data itself, even sophisticated, is not sufficient in order to resolve two es-sential problems of geodynamics: what are mechanisms of earthquakes (EQs) origin and how to do forecasting of large EQs. In such a situation an importance of nonseismic meth-ods is evident. One of them is variation of magnetic field in the ultra-low frequency (ULF) range 0.01 − 10 Hz.
This effect was firstly reported by Fraser-Smith et al. (1990) in relation to Loma-Prieta (1989) (USA) large EQ (magnitude Ms = 7.1) and by Molchanov et al. (1992),
Kopytenko et al. (1993) in association with Spitak, 1987 (former Soviet Union) EQ (Ms = 6.9). Fraser-Smith et
al. (1990) were lucky to observe ULF geomagnetic varia-tions at distance 7 km from EQ epicenter and found that ULF magnetic intensity increased about 14 days before EQ, then it depressed several days ahead and once again it increased strongly at 4 h before the main shock and continued at high Correspondence to: O. Molchanov ([email protected])
level after EQ. They found the most clear effect in the fre-quency band F = 0.01 − 0.1 Hz. Molchanov et al. (1992), Kopytenko et al. (1993) observed ULF variation at distance 130 km from the EQ epicenter and noted only last stage of the process: increase of ULF intensity in time period from 3 h before to several days after EQ.
Next researches on this subject were mainly produced in Japan. Hayakawa et al. (1996a) reported results of obser-vation the ULF magnetic field variations before great EQ at Guam, 1993 (Ms = 8.0) at epicenter distance 65 km. They
suggested to analyze the polarization ratio R = Z/H in fre-quency band 0.01 − 0.05 Hz and found that this parameter increased about 1 month before EQ but returned to the regu-lar level after it. Later Hayakawa et al. (1999) considered the data once again and showed that slope of ULF spec-trum (fractal number) also changed before the EQ. Hattori et al. (2002) reported observation of ULF magnetic variation around date of two Kagoshima, 1997 large EQs (M = 6.5 and M = 6.3) at distance about 60 km from the both epi-centers. They also analyzed polarization ratio and found its increase about 1 month before EQ date. They could not find this signature at the far-distance stations with the same equip-ment. Kopytenko et al. (2002) observed ULF magnetic vari-ations using network of stvari-ations situated in the Izu and Chiba area of Japan. They discussed results related to EQ swarm during June–July 2000 with strongest shock Ms =6.4 in the
middle of the swarm. Epicenter distances to the stations var-ied from 70 to 150 km and the authors paid main attention to polarization ratio near frequencies F1=0.1 ± 0.005, F2=
0.01 ± 0.005 and F3 = 0.005 ± 0.003 Hz. It was shown
that ratio R(F3)/R(F1)sharply increases just before a start
of strong seismic activity, while amplitudes of Z and G com-ponent variations and Z/G ratio defined in a frequency range
F2during night time intervals (00:00–06:00 LT) begin to
in-crease 1.5 months before the period of the seismic activity. In this paper we consider ULF perturbations only in tem-poral scale from several hours to a few days and pay main attention to time correlation of our data with seismicity.
204 O. Molchanov et al.: Preseismic ULF electromagnetic effect
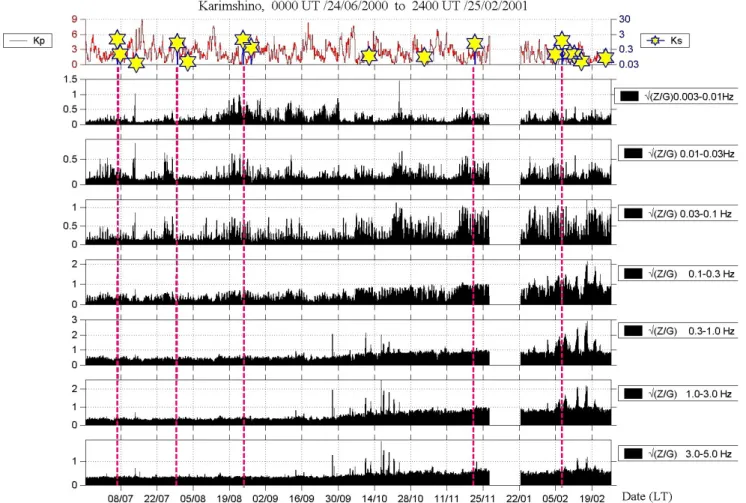
Fig. 1. Ks, Kp(upper panel) and amplitude polarization ratio (Z/G)1/2in the different frequency bands (2 h averaging) for the first interval
of observation from 24 June 2000 to 25 February 2001.
2 Index of seismic activity
In order to estimate a correlation between seismicity and nonseismic parameter like ULF magnetic intensity at a given station it is necessary to introduce a parameter characterizing seismic influence in the observational point for earthquakes with different magnitudes M, epicenter distance D and depth
H. We assume that index of seismic activity is proportional to seismic energy input
1Es =
Z
Psdt ∼< Ps > τ
where Ps is seismic energy flux and τ is duration of
seis-mic pulse. Ps is decreasing on distance due to divergence of
flux in space (∝ R−2), then due to inelastic attenuation (co-efficient Fa) and due to scattering or elastic attenuation (Aki
and Richards, 1980). Scattering can be described in terms of multi-ray propagation and in the first approximation the scattering factor in Psis in inverse proportion to τ . Hence:
1Es '(Es/R2)Fa∼(101.5M/R2)Fa(R, M) (1)
where Kanamori and Anderson (1975) scaling is used. So, we can introduce seismic index Ksas following:
Ks =
p
1Es/1Es∗=K0100.75M8a/R (2)
where 1E∗s = 1Es near the boundary of seismic influence
R = R∗, K0 is a constant and attenuation coefficient can
be presented by approximated formula (Molchanov et al., 2002):
8a=
p
Fa'(1 + R/La)−2.5 (3)
Here La is attenuation distance and it is easy to find that
La ' QLs/2 ' 10M/2, where Q ' 100 is elastic quality
and Ls is average size of seismic source (Aki and Richards,
1980). It is evident that Ks = 1 near boundary of seismic
influence, where 1Es =1Es∗and R = R
∗. It allows to
de-termine K0 '0.1 directly from observational data as it was
done in (Gorbatikov et al., 2002). In result K0'0.1 we will
use this seismic index Ks in above-described formulation.
3 Description of observation and case study results
During 1999–2000, in addition to the existing seismic and geophysical observations, Russian and Japanese scien-tists established a special observatory at Karimshino site (52.94◦N, 158.25◦E) in Kamchatka (Far-Eastern Russia). Its main purpose was to study a correlation of seismic activity with electromagnetic and other nonseismic phenomena. The
O. Molchanov et al.: Preseismic ULF electromagnetic effect 205
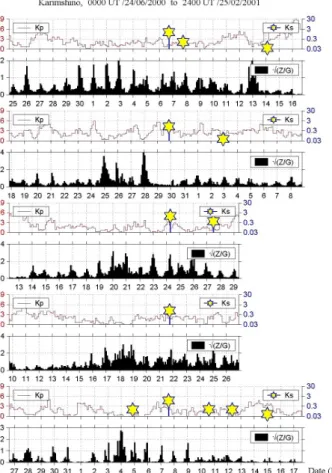
Fig. 2. Variations of amplitude polarization ratio around date of selected EQs (indicated in Fig. 1) in the channel 2, F = 0.01 − 0.03 Hz (two hours averaging). Vertical dotted lines show midnight times.
main advantage of this station is quiet electromagnetic envi-ronment that allows us to use rather sensitive equipment and to check some theoretical ideas. The regular recordings have been started since June 2000 and some information about Karimshino station is already published (Uyeda et al., 2002; Gladyshev et al., 2002).
Our three-component induction magnetometer measures the geomagnetic field variations in the frequency range 0.003 − 40 Hz. The sensitivity threshold is better than 20 pT/Hz1/2 at frequency 0.01 Hz. It corresponds to 0.02 pT/Hz1/2 at frequencies above 10 Hz. Here we ana-lyze results in the interval from 24 June 2000 to 25 February 2001 (the first interval duration of 7 months) and second in-terval from 26 February 2001 to 16 September 2001 (during of about 6 months). So, whole period of the observation has duration about 13 months. As mentioned before in this paper we are presenting results on variation with scale more than several hours that is why we use two hour averaging of the data.
First of all we have produced the variation of the spec-trum of ULF intensity for each magnetic field component (H, D, Z) in the 7 frequency bands: F = 0.003 − 0.01 Hz (channel 1), F = 0.01 − 0.03 Hz (channel2), F = 0.03 −
0.1 Hz (channel 3), F = 0.1 − 0.3 Hz (channel 4), F = 0.3 − 1.0 Hz (channel 5), F = 1.0 − 3.0 Hz (channel 6) and
F =3.0 − 5.0 Hz (channel 7). We have found conventional correlation with Kp index of magnetic activity and evident
daily variation, especially in channels 1, 2, 3. But a clear sig-nature of correlation with Ks (i.e. seismicity) has not been
discovered in such a type of analysis.
Then we apply the method of polarization ratio, which was discussed in many papers since (Hayakawa et al., 1996a) and which is reduced to analysis of Z1/2/G1/2)ratio in our re-search. The results for the first time interval are shown in Fig. 1. In contrast with amplitude analysis some correlation with Ks can be supposed at least for the frequency channels
2 and 3 and near the date of large Ks values (these cases are
indicated by vertical dash lines).
In order to check it we demonstrate all the cases in Fig. 2, each case during time interval ±14 days around the EQ date and presentation is centered to the corresponding date. Rely-ing upon results in Fig. 1 and for simplicity we present only channel 2 (F = 0.01 − 0.03 Hz). It is obvious that nighttime values of√(Z/G)show increase at about 2–7 days time pe-riod before EQ date.
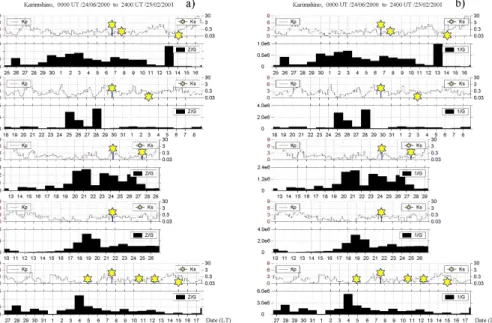
An important question arises immediately: what it means, increase of Z component or decrease of G component or both? The first of all we examined a behavior of Z compo-nent and found it reveals mainly seasonal changes and some-times it is exposed to small man-made perturbations but does not show correlation with seismicity. To clarify it we present
Z/Gvalues and 1/G values after 1 day averaging in Fig. 3 for the same cases as in Fig. 2.
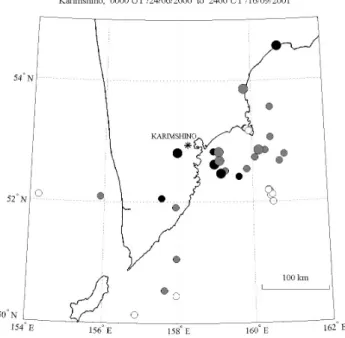
After scrutinized consideration we have found the effect discussed not for all the cases. The possible reason is that characteristics of EQs are different. To check it we present EQs characteristics for the cases with rather big Ks value in
Fig. 4 together with estimation of possibly correlated cases. It seems the correlated cases are mainly concentrated near sea shore. We failed to discover the direction to ULF emis-sion from H/D ratio. It indicates probably on large scale of the emission source. We hope to conduct some direction finding in future multi-station observations, which are sup-posed since end of 2002 year.
4 Prove of the effect by correlation analysis
Here we are going to check the effect, i.e. association of G intensity with Ksindex, by conventional correlation method.
Furthermore we try to find the anticipated correlation with
Kp. At the beginning we construct the set of normalized
deviations as the following:
δGi(t ) = (Gi−< Gi >)/ < Gi >
δ(1/Gi) = (1/Gi−<1/Gi >)/ <1/Gi >
where i is number of the frequency channel, i = 1, 2, 3 and < Gi >, < 1/Gi > denotes running mean with 1
month window. Taking into consideration that the tempo-ral scale of expected effect is about sevetempo-ral days we
pro-206 O. Molchanov et al.: Preseismic ULF electromagnetic effect
Fig. 3. (a) Z/G ratio for selected EQs after 1-day averaging. (b) The same as in (a) but for 1/G values and in corresponding scaling.
duce 2 day averaging of δGi and δ(1/Gi) which leads to
values δ2Gi, δ2(1/Gi), and find Ksd = P Ks per 2 days,
Kpd = P Kp per 2 days. Due to clear daily variation
of ULF spectral power in the selected channels, δ2Gi is
mainly related to daytime ULF intensity, but δ2(1/Gi) is
mainly related to nighttime ULF intensity. As a next step we have computed correlation functions F1i(τ ) = δ2Gi∗Ksd,
F2i(τ ) = δ2(1/Gi) ∗ Ksd, F3i(τ ) = δ2Gi ∗ Kpd and
F4i(τ ) = δ2(1/Gi) ∗ Kpd using conventional programs,
where τ is determined in the interval ±15 days. The negative value of τ corresponds to preseismic period and positive τ -value is for postseismic period in our formulation. Because of Ksdand Kpd are positive values, it is evident that positive
value of F1i(τ )corresponds to increase of daytime ULF
in-tensity with Ksand negative value is for its decrease. In
con-trast positive value of F2i(τ )means suppression of nighttime
ULF intensity and negative value F2i(τ ) means increase of
the intensity with seismicity. The signs of correlation func-tions F3i(τ )and F4i(τ )characterizing relation of ULF
mag-netic field with processes in the ionosphere-magnetosphere have the same meaning.
First of all we present a correlation of ULF intensity with global ionosphere-magnetosphere activity, functions F3i(τ )
in the Fig. 5a and F4i(τ )in the Fig. 5b. Obvious correlation
is observed both for daytime ULF intensity (Fig. 5a) and for the night-time values (Fig. 5b). It is stable, i.e. it reveals for the first interval of observation, then for the second 6-month interval and for the whole 13 month’s interval. Remembering above-mentioned definition, positive values of δ2Gi ∗Kpd
correlation and negative values of δ2(1/Gi) ∗ Kpd
correla-tion at τ ' 0 mean that both day-time and night-time ULF intensity is proportional and concurrent to Kp index. This
correlation is rather understandable.
We call a correlation as reliable one if it reveals for all the
intervals and at least twice out of a reliability margin at the whole interval, which is about ±0.1. Basing on this point a correlation in Figs. 5a and 5b is reliable. Then we show correlation of ULF intensity with seismic index Ks, functions
F1i(τ ) (Fig. 5c) and F2i(τ ) (Fig. 5d). Due to our criteria
there is no correlation between daytime intensity and Ks, but
night-time suppression of ULF intensity near value τ ∼ −4 days looks as reliable effect. This conclusion coincides with result of case study. Some increase of correlation at +14 days is probably connected with aftershock activity and it is not considered here.
5 Discussion and conclusions
We have found effect of suppression of ULF magnetic field variations about 2 − 6 days before rather strong seismic shocks in a case study. It is revealed for night-time and for horizontal component intensity (G) in the frequency range 0.01 − 0.1 Hz. We prove a reliability of the effect by com-puted correlation between G (or 1/G) and specially calcu-lated seismic indexes Ks. Basing on the simple criteria we
conclude that reliability of seismo-associated ULF suppres-sion effect is comparable with well-known effect of relation between ULF variation and Kpindex of global magnetic
ac-tivity. Using Ksin our formulation for analysis of preseismic
effect means indeed assumption that seismic shock is a result of some dynamic process (like instability) and intensity of preseismic perturbations is proportional to energy of seismic shock itself. Some justification of this approach contains in well-known correlation between magnitudes of foreshocks and main shock (see e.g. Scholz, 1990).
This effect can be also supposed in the previous observa-tions at least in those where preseismic increase of polariza-tion ratio had been found (see Introducpolariza-tion). As it is shown
O. Molchanov et al.: Preseismic ULF electromagnetic effect 207
Fig. 4. Map of observation area at Kamchatka peninsula around Karimshino station (star). Positions of EQs with Ks > 0.3 are
shown by big circles, positions of EQs with 0.03 < Ks < 0.3 are
shown by medium circles. Coloring is estimation of the suppression effect from case study: black is for clear effect, gray is for weak effect and blank is for questionable cases.
here a decrease of G could lead to observed increase of ratio
Z/G. As mentioned above we need to take into consider-ation that ULF signal at Z component is more exposed to man-made interferences than response in horizontal compo-nents. Note furthermore that depression of variation of ho-risontal components of the magnetic field several days before main shock was noted in one of the first paper by Fraser-Smith et al. (1990). It was usually supposed that seismo-associated ULF variations could be either due to direct radia-tion from EQ origin zone (Fenoglio et al., 1995; Molchanov and Hayakawa, 1995) or due to a change of geoelectric con-ductivity inside and nearby EQ zone, which leads to the change of ULF waves generated by ionospheric sources (e.g. Merzer and Klemperer, 1997). The first mechanism is not compatible with our observational results because it predicts preseismic increase of ULF intensity. Indeed we have ob-served such an increase about 0.5 − 2 h before several EQ shocks but it can not be revealed in our statistics. Probably the interval of ULF increase could be extended essentially for the very large EQs up to a few days as reported earlier (see Introduction). However an explanation by preceding change of the ground conductivity is also not very attractive for us because long-time magnetotelluric observation in USA and Japan did not show any correlation with seismicity (see e.g. Park, 1997). It seems that suppression of ULF magnetic vari-ation is happened not inside of the ground but in the lower ionosphere. A hint might be in results of monitoring of upper atmosphere and ionosphere around EQ date by VLF trans-mitter signals, which reported by Hayakawa et al. (1996b)
Fig. 5. Cross correlation of δ2G ∗ Kp(a), δ2(1/G) ∗ Kp(b), δ2G ∗
Ks (c) and δ2(1/G) ∗ Ks (d) in a range of ±15 days for whole 13
months period of observation and different frequency bands.
and Molchanov et al. (2001). They found clear perturba-tions of atmosphere-ionosphere boundary several days be-fore large EQs at nighttime or during night-to day transition (so-called terminator time).
208 O. Molchanov et al.: Preseismic ULF electromagnetic effect
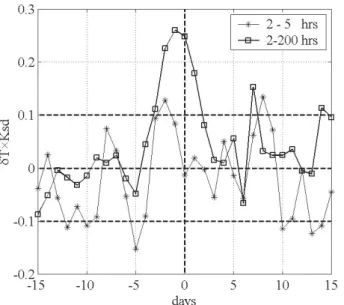
Fig. 6. Cross correlation of atmosphere temperature variations at Karimshino and Ksindex during summer-autumn time of 2000 year
(5 month) for periods 2–5 h (stars) and whole range of spectrum analysis 2–200 hours (squares).
Molchanov et al. (2001) provide arguments that water and gas eruptions before EQs could origin “mosaic” and “twin-kle ” spots of atmospheric temperature and density variations leading to generation of acoustic-gravity waves (AGW) tur-bulence with horizontal scales about 1–100 km. As consid-ered by Mareev et al. (2002) and Alperovich et al. (2002), propagation of AGW perturbations into the ionosphere can modify plasma conductivity, which results in the loss of pen-etration ability for the ULF waves generated in the magne-tosphere (magnetic pulsations). In order to justify such an approach we have produced the correlation analysis of atmo-spheric temperature variations observed by portable meteo-station at Karimshino. We exclude tidal variations by rejec-tion of spectrum components with periods 24 ± 2 h, 12 ± 1 h, 8 ± 1 h and 6 ± 0.5 h and produce the analysis both for fast variations (periods T = 2 − 5 h) and slow variations (T = 2 − 200 h with rejection of tides). The results for the summer-autumn period of 2000 are presented in Fig. 6. They do not contradict to our point of view. Note that we cannot find this correlation for the interval winter 2000-spring 2001, when rather hard snowing happened at Kamchatka.
So, suggested here mechanism could be responsible for our effect though these perturbations can not be found in the conventional impedance analysis of the magneto-telluric fields.
Like some other non-seismic precursors our effect looks as sporadic one in a case study and can be recognized only by statistics. We believe that ULF-seismicity relation becomes more clear and regular after integration on space, i.e. using of network of stations, what we suppose to do in future. Acknowledgements. This research was supported by ISTC grant
No. 1121, the work of OM was partially supported by the Inter-national Space Science Institute (ISSI) at Bern, Switzerland within the project “Earthquake influence of the ionosphere as evident from satellite plasma density-electric field data”.
References
Aki, K. and Richards, P. G.: Quantitative seismology, W. H. Free-man and Company, San Francisco, 1, 545, 1980.
Alperovich, L., Chaikovsky, I., Gurvich, Yu., and Melnikov, A.: Laboratory modelling of the disturbed D- and E-layers: DC and AC fields, in: Seismo-Electromagnetics (Lithosphere-Atmosphere-Ionosphere Coupling), (Eds) Hayakawa, M. and Molchanov, O., TERRUPUB, 343–348, 2002.
Fenoglio, M. A., Johnston, M. J. S., and Byerlee, J. D.: Magnetic and electric fields associated with changes in high pore pressure in fault zone-application to the Loma Prieta ULF emissions, J. Geophys. Res. Solid Earth, 100, 12 951–12 958, 1995.
Fraser-Smith, A. C., Bernardy, A., McGill, P. R., Ladd, M. E., Helli-well, R. A., and Villard, Jr., O. G.: Low frequency magnetic field measurements near the epicenter of the Loma-Prieta earthquake, Geophys. Res. Lett., 17, 1465–1468, 1990.
Gladyshev, V., Baransky, L., and Schekotov, A., et al.: Some preliminary results of seismo-electromagnetic research at Com-plex Geophysical Observatory, Kamchatka, in: Seismo-Electromagnetics (Lithosphere-Atmosphere-Ionosphere Cou-pling), (Eds) Hayakawa, M. and Molchanov, O.,TERRUPUB, 421–432, 2002.
Gorbatikov, A. V., Molchanov, O. A., Hayakawa, M., Uyeda, S., Hattori, K., Nagao, T., Nikolaev, A. V., and Maltsev, P.: Acoustic emission possibly related to earthquakes,observed at Matsushiro, Japan and its implications, in: Seismo-Electromagnetics (Lithosphere-Atmosphere-Ionosphere Cou-pling), (Eds) Hayakawa, M. and Molchanov, O., TERRUPUB, 1–10, 2002.
Hattori, K., Akinaga, Y., Hayakawa, M., Yumoto, K., Na-gao, T., and Uyeda, S.: ULF Magnetic Anomaly Pre-ceding the 1997 Kagoshima Earthquakes, in: Seismo-Electromagnetics (Lithosphere-Atmosphere-Ionosphere Cou-pling), (Eds) Hayakawa, M. and Molchanov, O., TERRUPUB, 19–28, 2002.
Hayakawa, M., Kawate, R., Molchanov, O. A., and Yumoto, K.: Re-sults of ultra-low-frequency magnetic field measurements during the Guam earthquake of 8 August, 1993, Geophys. Res. Lett., 23, 241–244, 1996a.
Hayakawa, M, Molchanov, O. A., Ondoh, T., and Kawai, E.: Anomalies in the sub-ionospheric VLF signals for the 1995 Hyogo-ken Nanbu earthquake, J. Phys. Earth, 44, 413–418, 1996b.
Hayakawa, M., Ito, T., and Smirnova, N.: Fractal analysis of ULF geomagnetic data associated with the Guam earthquake on 8 Au-gust 1993, Geophys. Res. Lett., 26, 2797–2800, 1999.
Kanamori, H. and Anderson, D.: Theoretical basis of some empir-ical relations in seismology, Bull. Seismol. Soc. Am., 65, 1073– 1095, 1975.
Kopytenko, Yu. A., Matiashvily, T. G., Voronov, P. M., Kopytenko, E. A., and Molchanov, O. A.: Detection of ULF emission con-nected with the Spitak earthquake and its aftershock activity based on geomagnetic pulsations data at Dusheti and Vardziya observatories, Phys. Earth and Plan. Interiors, 77, 85–95, 1993.
O. Molchanov et al.: Preseismic ULF electromagnetic effect 209 Kopytenko, Yu. A., Ismaguilov, V. S., and Hattori, K., et al.:
Mon-itoring of the ULF Electromagnetic Disturbances at the Sta-tion Network before EQ in Seismic zones of Izu and Chibo Peninsulas (Japan), in: Seismo-Electromagnetics (Lithosphere-Atmosphere-Ionosphere Coupling), (Eds) Hayakawa, M. and Molchanov, O., TERRUPUB, 11–18, 2002.
Mareev, E. A., Iudin, D. I., and Molchanov, O. A.: Mosaic source of internal gravity waves associated with seismic activity, in: Seismo-Electromagnetics (Lithosphere-Atmosphere-Ionosphere Coupling), (Eds) Hayakawa, M. and Molchanov, O., TER-RUPUB, 335–342, 2002.
Merzer, M. and Klemperer, S. L.: Modeling low-frequency mag-netic field precursors to the Loma Prieta earthquake with a pre-cursory increase in fault-zone conductivity, Pure and Appl. Geo-phys., 150, 217–248, 1997.
Molchanov, O. A., Kopytenko, Yu. A., Voronov, P. M., Kopytenko, E. A., Matiashvili, T. G., Fraser-Smith, A. C., and Bernardy, A.: Results of ULF magnetic field measurements near the epicenters of the Spitak (Ms = 6.9) and Loma Prieta (Ms = 7.1)
earth-quakes: comparative analysis, Geophys. Res. Lett., 19, 1495– 1498, 1992.
Molchanov, O. A. and Hayakawa, M.: Generation of ULF
electro-magnetic emissions by microfracturing, Geophys. Res. Lett., 22, 3091–3094, 1995.
Molchanov, O. A., Hayakawa, M., and Miyaki, K.: VLF/LF sound-ing of the lower ionosphere to study the role of atmospheric oscil-lations in the lithosphere-ionosphere coupling, Adv Polar Upper Atmos. Res., N15, 146–158, 2001.
Molchanov, O., Kulchitsky, A., and Hayakawa, M.: ULF emission due to inductive seismo-electromagnetic effect, in: Seismo-Electromagnetics (Lithosphere-Atmosphere-Ionosphere Coupling), (Eds) Hayakawa, M. and Molchanov, O., TER-RUPUB, 153–162, 2002.
Park, S. K.: Monitoring resistivity change in Parkfield, California: 1988–1995, J. Geophys. Res., 102, 24, 545–559, 1997.
Scholz, C. H.: The Mechanics of Earthquakes and Faulting, Cam-bridge University Press, 1990.
Uyeda, S., Nagao, T., and Hattori, K., et al.: Japanese-Russian Complex Geophysical Observatory in Kamchatka region for monitoring of phenomena connected with seismic activity, in: Seismo-Electromagnetics (Lithosphere-Atmosphere-Ionosphere Coupling), (Eds) Hayakawa, M. and Molchanov, O., TER-RUPUB, 413–419, 2002.