HAL Id: hal-00304613
https://hal.archives-ouvertes.fr/hal-00304613
Submitted on 1 Jan 2001HAL is a multi-disciplinary open access archive for the deposit and dissemination of sci-entific research documents, whether they are pub-lished or not. The documents may come from teaching and research institutions in France or abroad, or from public or private research centers.
L’archive ouverte pluridisciplinaire HAL, est destinée au dépôt et à la diffusion de documents scientifiques de niveau recherche, publiés ou non, émanant des établissements d’enseignement et de recherche français ou étrangers, des laboratoires publics ou privés.
acid-sensitive streams in Europe
R. F. Wright, C. Alewell, J. M. Cullen, C. D. Evans, A. Marchetto, F.
Moldan, A. Prechtel, M. Rogora
To cite this version:
R. F. Wright, C. Alewell, J. M. Cullen, C. D. Evans, A. Marchetto, et al.. Trends in nitrogen deposition and leaching in acid-sensitive streams in Europe. Hydrology and Earth System Sciences Discussions, European Geosciences Union, 2001, 5 (3), pp.299-310. �hal-00304613�
Trends in nitrogen deposition and leaching in acid-sensitive
streams in Europe
R.F. Wright
1, C. Alewell
2, J.M. Cullen
3, C.D. Evans
3, A. Marchetto
4, F. Moldan
5, A. Prechtel
2and M. Rogora
41 Norwegian Institute for Water Research, P.O. Box 173 Kjelsås, N-0411 Oslo, Norway
2 Institute for Terrestrial Ecosystem Research (BITÖK), University of Bayreuth, D-95440 Bayreuth, Germany 3 Centre for Ecology and Hydrology, Wallingford, Oxon OX10 8BB, UK
4 Consiglio Nazionale delle Ricerche - Istituto Italiano di Idrobiologia, 28922 Verbania Pallanza (VB), Italy 5 Swedish Environmental Research Institute IVL, Box 47086, S-402 58 Göteborg, Sweden
Email for ecorresponding author: richard.wright@niva.no
Abstract
Long-term records of nitrogen in deposition and streamwater were analysed at 30 sites covering major acid sensitive regions in Europe. Large regions of Europe have received high inputs of inorganic nitrogen for the past 20-30 years, with an approximate 20% decline in central and northern Europe during the late 1990s. Nitrate concentrations in streamwaters are related to the amount of N deposition. All sites with less than 10 kgN ha-1 yr-1 deposition have low concentrations of nitrate in streamwater, whereas all sites receiving > 25 kgN ha-1 yr-1 have elevated
concentrations. Very few of the sites exhibit significant trends in nitrate concentrations; similar analyses on other datasets also show few significant trends. Nitrogen saturation is thus a process requiring many decades, at least at levels of N deposition typical for Europe. Declines in nitrate concentrations at a few sites may reflect recent declines in N deposition. The overall lack of significant trends in nitrate concentrations in streams in Europe may be the result of two opposing factors. Continued high deposition of nitrogen (above the 10 kgN ha-1 yr-1 threshold)
should tend to increase N saturation and give increased nitrate concentrations in run-off, whereas the decline in N deposition over the past 5– 10 years in large parts of Europe should give decreased nitrate concentrations in run-off. Short and long-term variations in climate affect nitrate concentrations in streamwater and, thus, contribute “noise” which masks long-term trends. Empirical data for geographic pattern and long-term trends in response of surface waters to changes in N deposition set the premises for predicting future contributions of nitrate to acidification of soils and surface waters. Quantification of processes governing nitrogen retention and loss in semi-natural terrestrial ecosystems is a scientific challenge of increasing importance.
Keywords: Europe, acid deposition, nitrogen, saturation, recovery, water
Introduction
During the 1900s large regions of Europe received elevated deposition of nitrogen (N) compounds. Emissions of oxidised N species from combustion of fossil fuels and emissions of reduced N compounds from agriculture increased dramatically in Europe during the 1900s to reach peak levels by about 1980. Since then emissions have levelled off and decreased slightly in most countries (Tarrason and Schaug, 2000).
Excess N deposition has long been viewed as a threat to the nutrient balance and health of forests and semi-natural terrestrial ecosystems. In the absence of significant N deposition, N is usually the growth-limiting nutrient in these
ecosystems (Tamm, 1991). Chronic excess N deposition can lead to N saturation, defined by Aber et al., 1989) as “the availability of ammonium (NH4) and nitrate (NO3) in excess of total combined plant and microbial nutritional demand”. By this definition N saturation is manifest by increased leaching of inorganic N (generally NO3) below the rooting zone. Since NO3 is a strong acid anion, increased leaching of NO3 enhances acidification of soils and surface waters. Increased concentrations of inorganic N in run-off (streamwater) thus indicate N saturation of terrestrial ecosystems, assuming that there are no significant sources of N in the catchment (such as fertilisers, municipal and industrial wastewater).
Long-term records of deposition and run-off of N are available for streamwaters in several acid-sensitive areas in Europe. Many of these data have been collected as part of national monitoring programmes and are included in international co-operative programmes under the auspices of the UN-ECE Convention on Long Range Transboundary Air Pollution, such as EMEP (Co-operative Programme for Monitoring and Evaluation of the Long Range Transmission of Air Pollutants in Europe), ICP-Waters (International Co-operative Programme on Assessment and Monitoring of Acidification of Rivers and Lakes) (Kvæven et al., 2001) and ICP Integrated Monitoring (Lundin et al., 2001). Trends in deposition and run-off from such data provide a basis for assessing both the role of N in recovery of surface waters from acidification and the status and change in N saturation status of terrestrial ecosystems. EMEP (Barrett et al., 2000a) and ICP-Waters (Stoddard et al., 2001) have previously conducted such analyses based on emission and deposition data and surface water data, respectively, from the 1980s and 1990s.
The European research project RECOVER:2010 is designed to assess the impact of acid deposition on sensitive freshwater ecosystems and to predict the recovery by the year 2010 (Ferrier et al., 2001). One objective of RECOVER:2010 is to analyse systematically long-term
records of deposition and surface water chemistry at acid-sensitive sites characteristic of the major types of acidified waters in Europe. RECOVER:2010 includes sites in Scandinavia (Norway, Sweden and Finland), the British Isles (UK), central Europe (Germany, Czech Republic, and Slovakia) and the southern Alps (Italy). Here we present the long-term trends in inorganic N concentrations in deposition and streamwater at 30 stream sites in Europe (Table 1, Fig. 1). In a companion paper, Prechtel et al. (2001) present trends in sulphur (S) for these sites. Lakes are not addressed here, because of the complicating factor of in-lake retention of N. Trends in N concentrations in Scandinavian lakes are presented by Skjelkvåle et al. (2001a), trends in Czech lakes are presented by Kopácek et
al., (1998) and trends in four Italian lakes are presented by
Rogora et al. (2001).
Materials and methods
SITES AND RUN-OFF DATAAll of the 30 sites are running waters with catchments ranging in size from a few hectares (Gårdsjön F1 in Sweden) to over 100 km2 (Cannobino River, Italy) (Table 1). The
four sites in Norway (Birkenes, Storgama, Langtjern and
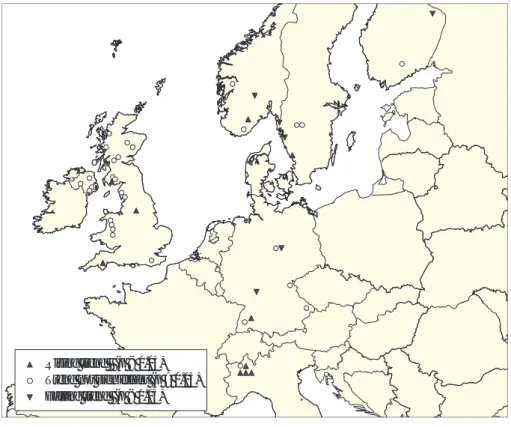
Fig. 1. Map of Europe showing RECOVER:2010 stream sites used in analysis of long-term trends in N. Triangles up indicate significant increasing trends in NO3 concentrations. Triangles down indicate significant decreasing trends. Circles indicate sites with no significant trend.
Rising trend (p < 0.05) Trend not significant (p > 0.05) Falling trend (p < 0.05)
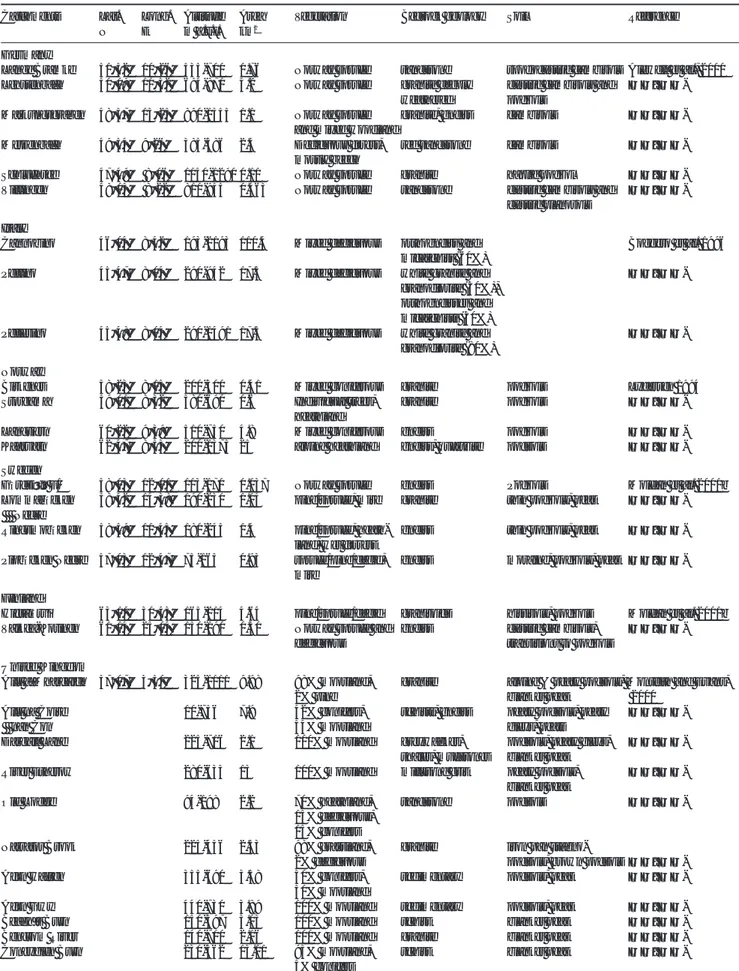
Table 1. Location and characteristics of streamwater sites included
Catchments Lat. Long. Altitude Area Vegetation Bedrock geology Soil Reference
N E m a.s.l. km2
Germany
Lange Bramke 51°52' 10°26' 535-700 0.76 Norway spruce sandstone spododystric cambisols Alewell et al., 2000
Lehstenbach 50°09' 11°52' 694-871 4.2 Norway spruce granite deeply dystric cambisols and
——”——-weathered podzols
Markungsgraben 48°57' 13°25' 890-1355 1.1 Norway spruce granite, gneiss cambisols
——”——-and mixed woodl——”——-and
Metzenbach 49°54' 9°26' 385-586 2.4 Deciduous forest, red sandstone cambisols
——”——-mostly beech
Schluchsee 47°49' 8°06' 1150-1290 0.11 Norway spruce granite haplic podzol
——”——-Villingen 48°03' 8°22' 810-945 0.463 Norway spruce sandstone dystric cambisols and
——”——-dystric planosols
Italy
Cannobino 46°04' 8°42' 193-2193 110.4 Mixed deciduous orthogneiss and Boggero et al. 1996
micaschist (60%)
Pellino 45°47' 8°04' 290-942 17.5 Mixed deciduous white granite and
——”——-granodiorite (50%), orthogneisses and micaschists (30%)
Pellesino 45°48' 8°04' 290-1491 17.5 Mixed deciduous white granite and
——”——-granodiorite (80%)
Norway
Birkenes 58°23' 8°15' 200-300 0.41 Mixed coniferous granite podzols Lydersen 1994
Storgama 59°01' 8°32' 580-690 0.6 Individual trees, granite podzols
——”——-heathland
Langtjern 60°22' 9°39' 510-750 4.8 Mixed coniferous gneiss podzols
——”——-Kaarvatn 62°47' 8°53' 200-1375 25 alpine heathland gneiss, quartzite podsols
——”——-Sweden
Gårdsjön F1 58°03' 12°01' 113-170 0.037 Norway spruce gneiss Podzols Moldan et al. 2001b
Lommabäcken 58°42' 14°38' 190-230 1.04 pine/spruce, mire granite thin podzols, peat
Nedre
Ringsmobäcken 58°59' 11°45' 180-245 1.4 pine/spruce, heath- gneiss thin podzols, peat
——”——-land, wet forrest
Pipbäcken Nedre 57°03' 12°47' 75-165 0.93 spruce/pine/decid, gneiss moraine, podzols, peat
——”——-mire
Finland
Hietajärvi 63°10' 30°43' 165-214 4.64 pine/spruce/decid granitoids histisols, podzols Moldan et al. 2001b
Valkea-Kotinen 61°14' 25°04' 150-190 0.30 Norway spruce and gneiss dystric cambisols,
——”——-deciduous transitions to podzols
United Kingdom
Allt a’Mharcaidh 57°07' 3°50' 325-1111 9.98 98% moorland, granite alpine & peaty podsols, Monteith and Evans,
2% pine blanket peat 2000
Allt na Coire 10-756 7.9 42% conifers, schists, gneiss peaty podsols, peaty
nan Con 54% moorland gleys, peats
Dargall Lane 225-716 2.1 100% moorland greywackes, podsols, peaty gleys,
——”——-shales, mudstones blanket peat
River Etherow 280-633 13 100% moorland millstone grit peaty podsols,
——”——-blanket peat
Old Lodge 94-198 2.2 70% heathland, sandstone podsols
——”——-15% deciduous, 15% conifers
Narrator Brook 225-456 2.53 98% grassland, granite iron pan
stagno-2% deciduous podsols, brown podsols
——”——-Afon Hafren 355-690 3.58 50% conifers, sedimentary podsols, peat
——”——-50% moorland
Afon Gwy 440-730 3.89 100% moorland sedimentary podsols, peat
——”——-Beagh’s Burn 150-397 3.03 100% moorland schist blanket peat
——”——-Bencrom River 140-700 2.16 100% moorland granite blanket peat
——”——-Coneyglen Burn 230-562 13.11 95% moorland, schist blanket peat
Kaarvatn) are all included in the Norwegian monitoring programme for long range transboundary air pollution (Skjelkvåle and Tørseth, 2001) and are described by Lydersen (1994). Monitoring began in the 1970s and is reported annually (Aas et al., 2000; SFT, 2000). The Swedish site at Gårdsjön is part of several research projects (NITREX: Moldan and Wright, 1998; roof catchment: Moldan et al., 2001a) as well as a monitoring site included in ICP Waters and ICP Integrated Monitoring. The other three Swedish sites are part of the national monitoring programme and operated by the Swedish University of Agricultural Sciences. The Finnish sites are operated by the Finnish Meteorological Institute. Further details on these sites are given in Moldan et al. (2001b). The UK sites are the 11 streams included in the UK Acid Waters Monitoring Network (AWMN) (Monteith and Evans, 2000) and have been sampled since 1988. The German sites are included in the ICP-Waters programme and are described by Alewell
et al. (2001), with methods given by LfW (1994)
(Markungsgraben, Metzenbach and Lehstenbach) and Armbruster (1998) (Schluchsee and Villingen). Hauhs (1990) describes the Lange Bramke catchment (Harz, Germany). The three Italian rivers (Pellino, Pellesino and Cannobino) are also part of ICP-Waters (Mosello et al., 2000) and are described by Boggero et al. (1996).
The catchments of the 30 streams are in coniferous and deciduous forests or heathlands (moorlands), on bedrock and soils resistant to weathering (with the exception of the three Italian rivers) and with cambisols, podsols or peaty soils (Table 1). There are no major sources of pollution from within the catchments and, thus, they are well suited for examining the role of atmospheric deposition on water chemistry.
DEPOSITION DATA
Routine and systematic measurement of deposition of acidifying pollutants in Europe has been conducted since the 1950s. Measurement stations are operated as part of national monitoring programmes and since 1978 have been formally organised as EMEP as part of the UN-ECE Convention on Long-Range Transboundary Air Pollution. EMEP entails systematic measurement of wet and dry deposition of N compounds at > 50 sites in Europe (Barrett
et al., 2000a,b). EMEP data comprise both measured and
regional deposition modelled by an emission-transport-deposition model. The modelled emission-transport-deposition has been used as the basis for negotiations of emissions protocols under the convention (Bull et al., 2001).
Results reported here are from three sources: bulk precipitation collected at the sites (six sites in Germany, four
sites in Norway and one site in Sweden), measured deposition at EMEP or other stations located in the same region as the streamwater sites (Barrett et al., 2000a) and modelled deposition by country (Tarrason and Schaug, 2000).
TREND ANALYSES
Trend analyses on deposition and streamwater data were carried out using the seasonal Kendall test. Details are given by Evans et al., 2001.
Results
DEPOSITIONDeposition of both oxidised and reduced N in Europe increased during the 1900s and plateaued in the 1970s and 1980s. Levels have decreased somewhat during the late 1990s in central and northern Europe (Tarrason and Schaug, 2000) (Fig. 2a,b). Trend analyses on the EMEP data conducted by Barrett et al. (2000a,b) indicate approximately 20% decline in deposition of N in central Germany and southern Scandinavia during the period 1989-1998. This is interpreted as a response to declining emissions of N compounds during the 1990s.
Measured wet deposition of N compounds at EMEP sites, and sites included here from RECOVER:2010, show relatively large year-to-year variations (Fig. 2b), probably mainly due to natural variations in meteorological conditions such as the amount of precipitation. This “noise” in the record means that trends in N deposition must be relatively large before they become statistically significant. This probably explains why there are no significant trends in N deposition during the 1990s at many of the EMEP and RECOVER sites.
STREAMWATER
Mean concentrations of NO3 in streamwater were lowest in northern Scandinavia and northwestern UK and highest in central Europe (Table 2). This is the same geographic pattern as N deposition. Ammonium concentrations at all these sites are very low, often below the analytical detection limit. (Detection limit for NH4 varies between laboratories, and has changed over time, but is generally 0.5-1.0 µeq L-1).
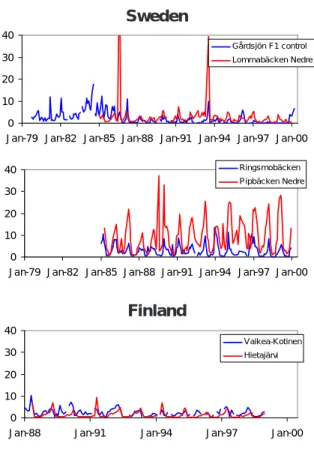
Mean concentrations of NO3 in streamwater at the Scandinavian catchments were < 10 µeq L-1 with a clear
gradient of increasing concentrations from north to south (Table 2). The records begin in the 1970s at the Norwegian sites, the mid-1980s at the Swedish sites and 1988 at the Finnish Sites. Only the sites Pipbäcken Nedre in
Fig. 2a. Emissions of N compounds to the atmosphere (oxidised plus reduced) in the EMEP region of Europe (data from Tarrason and Schaug, 2000). The data indicate a 20% reduction in emissions
during the 1990s.
Fig. 2b. Measured wet deposition of N (NO3 plus NH4) at several
EMEP stations in Europe. For the 10-year period 1989-1998 none of the trends in annual deposition were significant at the p=0.05 level except for the site SE03 Rörvik in southern Sweden (data from EMEP Chemical Co-odinating Centre http://www-nilu.no/projects/ ccc/ default.htm; trend analyses from Barrett et al., 2000a).
southernmost Sweden and Storgama and Birkenes in southernmost Norway exhibited signs of elevated NO3
concentrations in streamwater (Figs. 3a,b).
The 11 stream sites in the UK also showed pronounced geographic gradient, with low concentrations (< 5 µeq L-1)
at sites on the periphery (northern Scotland, western Northern Ireland, southwestern and southeastern England) and higher concentrations (> 10 µeq L-1) at sites in southern
Scotland, central England, central Wales and southernmost Northern Ireland (Table 2, Fig. 4). Again the highest NO3 concentrations are found at sites receiving highest N deposition, and in the most polluted regions approach concentrations observed in central Europe.
With the exception of Villingen in the Black Forest, all the German sites had very high concentrations of NO3 in streamwater with mean concentrations for the 12 year period 1987–99 exceeding 50 µeq L-1 at Lehstenbach
(Fichtelgebirge) and Markungsgraben (Bavarian Forest) (Table 2, Fig. 5). These sites also receive very high N deposition (> 25 kg ha-1 yr-1). The three streams in northern
Italy all had high concentrations of NO3 (> 40 µeq L
-1) (Table
2, Fig. 6).
Only nine of the 30 sites had significant trends over time in NO3 concentrations in streamwater (Table 2). All three
Italian rivers had significant positive trends amounting to an increase of about 1-2% per year. Two sites in the UK (River Etherow and Narrator Brook) also had positive trends. The only sites with negative trends were Metzenbach (central Germany), Storgama (southern Norway) and Gårdsjön F1 (west-coast Sweden). The latter two sites had low mean concentrations of NO3 (< 10 µeq L-1) and the
Total N emissions (ox + red) EMEP region Europe
0 2 4 6 8 10 12 14 16 18 1977 1979 1981 1983 1985 1987 1989 1991 1993 1995 1997 Ye ar m il li o n t onn e s N y r -1 N we t de position G e rman y 0 5 10 15 20 25 30 197 7 197 9 198 1 198 3 198 5 198 7 198 9 199 1 199 3 199 5 199 7 Y e a r kg N h a -1 yr -1
DE 02 Langenbrügge DE 03 S c hauins land DE 05 B rotjac k riegel N we t de position N orway, S we de n 0 5 10 15 20 25 30 197 7 197 9 198 1 198 3 198 5 198 7 198 9 199 1 199 3 199 5 199 7 Y e a r kg N h a -1 y r -1
NO 01 B irk enes S E 03 Rörvik
N we t de position Italy, U K 0 5 10 15 20 25 30 197 7 197 9 198 1 198 3 198 5 198 7 198 9 199 1 199 3 199 5 199 7 Y e a r kg N h a -1 y r -1
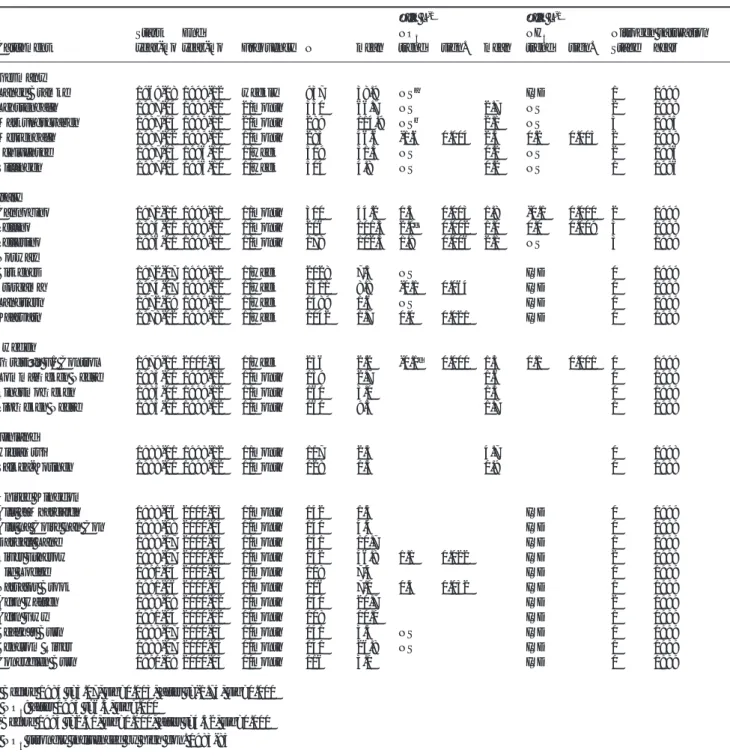
Table 2. Results of trend analyses for nitrate and ammonium concentrations in streamwater. Level of significance p< 0.05.
NS=not significant. ISD= insufficient data. Test: Seasonal Kendall. Also shown are stages of nitrogen saturation based on nitrate concentrations in run-off by the criteria of Stoddard and Traaen (1995).
µeq L-1 µeq L-1
Start End NO3 NH4 Nitrogen saturation
Catchment year-mo year-mo Frequency N mean trend sign. mean trend sign. Stage Year
Germany
Lange Bramke 1969-08 1999-12 weekly 937 38.9 NSa ISD 1 1999
Lehstenbach 1987-04 1999-11 2/month 330 66.7 NS 2.7 NS 2 1999 Markungsgraben 1987-03 1999-11 2/month 289 114.9 NSb 2.1 NS 3 1995 Metzenbach 1987-02 1999-11 1/month 283 46.6 -1.6 0.004 2.5 0.2 0.005 2 1999 Schluchsee 1987-03 1996-10 1/week 509 31.3 NS 0.2 NS 2 1996 Villingen 1987-03 1996-10 1/week 504 4.8 NS 0.2 NS 1 1996 Italy Cannobino 1971-10 1999-11 1/month 300 44.2 0.5 0.003 1.8 -0.1 0.000 2 1999 Pellino 1984-01 1999-11 1/month 206 101.5 2.0c 0.002 1.0 0.0 0.009 3 1999 Pellesino 1986-01 1999-11 1/month 178 102.3 1.8 0.006 2.1 NS 3 1999 Norway
Birkenes 1972-07 1999-12 1/week 2028 7.5 NS ISD 0 1999
Storgama 1974-07 1999-12 1/week 1311 8.8 -0.1 0.064 ISD 0 1999
Langtjern 1972-09 1999-12 1/week 1489 1.6 NS ISD 0 1999
Kaarvatn 1978-02 1999-12 1/week 1042 1.7 0.0 0.021 ISD 0 1999
Sweden
Gårdsjön F1 Control 1979-10 2000-03 1/week 236 2.2 -0.1d 0.000 1.3 0.1 0.001 0 1999
Lommabäcken Nedre 1985-01 1999-12 1/month 159 2.7 1.6 0 1999
Ringsmobäcken 1985-01 1999-12 1/month 160 3.0 1.3 0 1999
Pipbäcken Nedre 1985-01 1999-12 1/month 160 9.3 1.7 1 1999
Finland
Hietajärvi 1988-01 1998-12 1/month 117 2.5 4.7 0 1998
Valkea-Kotinen 1988-01 1998-12 1/month 128 1.5 0.9 0 1998
United Kingdom
Allt a’Mharcaidh 1988-06 2000-03 1/month 142 1.5 ISD 0 1999
Allt na Coire nan Con 1988-08 2000-03 1/month 140 4.4 ISD 0 1999
Dargall Lane 1988-07 2000-03 1/month 141 10.7 ISD 1 1999
River Etherow 1988-07 2000-02 1/month 142 46.8 1.1 0.022 ISD 2 1999
Old Lodge 1991-04 2000-03 1/month 108 7.4 ISD 0 1999
Narrator Brook 1991-06 2000-03 1/month 106 7.0 0.3 0.032 ISD 1 1999
Afon Hafren 1988-08 2000-02 1/month 140 20.7 ISD 2 1999
Afon Gwy 1991-04 2000-02 1/month 108 10.0 ISD 1 1999
Beagh’s Burn 1988-07 2000-03 1/month 141 3.3 NS ISD 0 1999
Bencrom River 1988-07 2000-03 1/month 141 26.8 NS ISD 1 1999
Coneyglen Burn 1990-08 2000-03 1/month 116 3.0 ISD 0 1999
a Before 1984 t=3.07, sig=0.013, after t=-1.74, sig=0.000 b NO
3: after 1995 t=6.5, sig=.000
c Before 1993 t=2.31, sig=0.000, after t=4.52, sig=0.000 d NO
3 strongly influenced by high con. 1983-85
negative trends are not significant with respect to streamwater acidity.
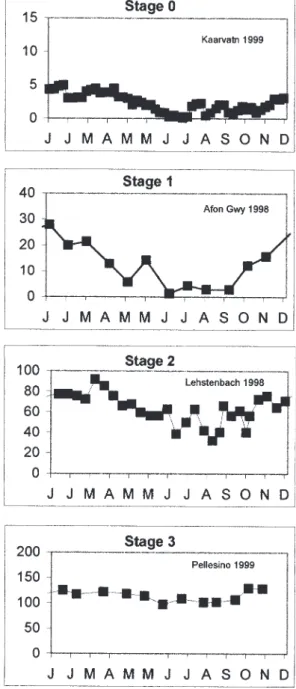
The seasonal pattern of NO3 concentrations was quite pronounced with higher levels during the dormant seasons and lower levels during the growing season. At a few sites
concentrations of NO3 were moderate to high all year round. These seasonal patterns correspond to various stages of N saturation where stage 0 represents the pristine, unpolluted stage, and stage 3 represents the fully N saturated stage (Stoddard, 1994). Stoddard and Traaen (1995) suggested
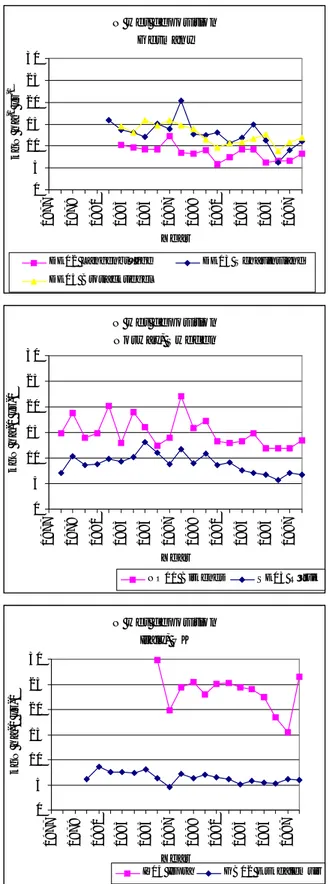
Fig. 3b. Concentrations of NO3 (µeq L
-1) in streamwater at four
catchments in Norway over the period 1972-1999 (data from annual reports of the Norwegian monitoring programme; SFT, 2000).
Fig. 4. Concentrations of NO3 (µeq L
-1) in streamwater at 11
catch-ments in the UK over the period 1988-1999 (data from Monteith and Evans, 2000; Evans and Monteith, 2001)
Fig. 3a. Concentrations of NO3 (µeq L
-1) in streamwater at four
catchments in Sweden (upper 2 panels) and two catchments in Finland (bottom panel) over the period 1985-1999 (data from Moldan et al., 2001b)
criteria for classification of streams based on NO3 concentrations during the growing and dormant seasons (Table 3, Fig. 7). Based on these criteria, 14 of the catchments were classed as stage 0 (Scandinavian and some UK sites), 7 as stage 1 (German and UK sites), 6 as stage 2 (German and UK sites) and 3 as stage 3 (German and Italian sites) (Table 2). At Markungsgraben the strong increase in concentrations and disappearance of seasonal pattern during the 1990s is probably due to bark beetle attack in the forest (Alewell et al., 2001).
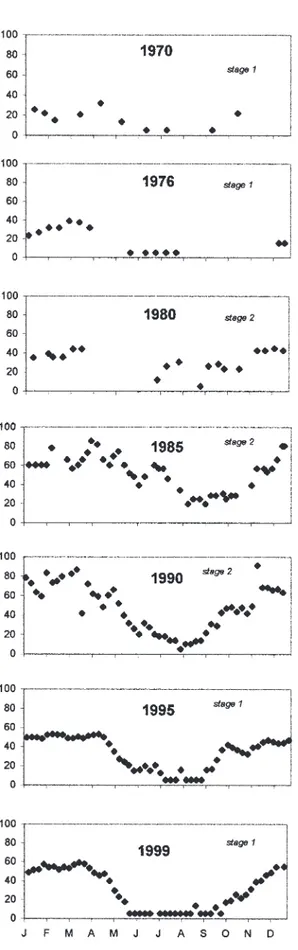
Only one of the sites (Lange Bramke) showed clear change in stage over the period of data. Lange Bramke moved from stage 1 in 1970 to stage 3 in 1985 but then back to stage 1 in 1999 (Fig. 8). These changes in stage, of course, parallel the general trends in NO3 concentrations at Lange Bramke. Two adjacent catchments (Dicke Bramke and Steile Bramke) both also show the same decline in NO3 concentrations beginning in about 1985 (Alewell et al., 2001). These changes are not explained by changes in N deposition, climate or management practices.
0 10 20 30 40
Jan-79 Jan-82 Jan-85 Jan-88 Jan-91 Jan-94 Jan-97 Jan-00
Gårdsjön F1 control Lommabäcken Nedre 0 10 20 30 40
Jan-79 Jan-82 Jan-85 Jan-88 Jan-91 Jan-94 Jan-97 Jan-00
Ringsmobäcken Pipbäcken Nedre 0 10 20 30 40
Jan-88 Jan-91 Jan-94 Jan-97 Jan-00
Valkea-Kotinen Hietajärvi Finland Sweden Scotland 0 20 40 60 80
Jan-88 Jan-91 Jan-94 Jan-97 Jan-00
Allt a Mharcaidh Allt na Coire nan Con Dargall Lane N. Ireland 0 20 40 60 80
Jan-88 Jan-91 Jan-94 Jan-97 Jan-00
Coneyglen Burn Beagh's Burn Bencrom River Wales 0 20 40 60 80
Jan-88 Jan-91 Jan-94 Jan-97 Jan-00
Afon Gwy Afon Hafren England 0 20 40 60 80
Jan-88 Jan-91 Jan-94 Jan-97 Jan-00
Narrator Brook Old Lodge River Etherow UK 0 2 0 4 0 6 0 8 0 Ja n-7 2 Ja n-7 6 Ja n-8 0 Ja n-8 4 Ja n-8 8 Ja n-9 2 Ja n-9 6 Ja n-0 0 K aarvatn Langtjern 0 2 0 4 0 6 0 8 0 Ja n-7 2 Ja n-7 6 Ja n-8 0 Ja n-8 4 Ja n-8 8 Ja n-9 2 Ja n-9 6 Ja n-0 0 S torgam a B irk enes Norway
Table 3. Criteria for stage of nitrogen saturation based on nitrate concentrations in run-off
(Stoddard and Traaen, 1995)
Lowest value Highest value
Stage months with conc. conc. µeq L-1 months
below 3 µeq L-1
0 more than 3 and less than 20 0
1 more than 3 and more than 20 more than 3
2 1-3 and less than 50 more than 3
3 0 and less than 50 less than 3
Fig. 7. Seasonal patterns of NO3 concentrations (µeq L-1) in
streamwater at four sites in Europe, illustrating the four stages of N saturation (after criteria of Stoddard and Traaen, 1995) Fig. 6. Concentrations of NO3 (µeq L
-1) in streamwater at three
catchments in northern Italy over the period 1972 (or 1984 or 1986)-1999 (data from Rogora et al., 2001) Fig. 5. Concentrations of NO3 (µeq L
-1) in streamwater at
catchments in Germany. Upper panel: Lange Bramke north-central Germany (Harz Mountains). Middle panel: three catchments in central and southern Germany. Bottom panel: two catchments in southwestern Germany (Black Forest). Data from Alewell et al.,
2001). 0 50 100 150 200
Jan-71 Jan-76 Jan-81 Jan-86 Jan-91 Jan-96 Cannobino Pellino Pellesino Italy 0 50 100 150
Jan-69 Jan-74 Jan-79 Jan-84 Jan-89 Jan-94 Jan-99
Lange B ram k e 0 50 100 150 200 250
Jan-87 Jan-90 Jan-93 Jan-96 Jan-99
M et z enbac h M ark ungs graben Lehs tenbac h 0 20 40 60 80 100
Jan-87 Jan-90 Jan-93 Jan-96 Jan-99
S c hulc hs ee V illingen
Discussion
The data from these 30 stream sites in Europe fit well into the general picture of N deposition and N concentrations in surface waters. Ammonium concentrations at all sites are very low, as is usually the case in most streamwaters (except, of course, those receiving NH4 pollution from direct sources within the catchment). Nitrate concentrations are clearly related to N deposition; average concentrations are below 5 µeq L-1 in areas receiving N deposition below about
10 kgN ha-1yr-1, variable in areas receiving 10-25 kgN
ha-1yr-1 and above 10 µeq L-1 at sites receiving more than
25 kgN ha-1 yr-1 (Fig. 9). These same two thresholds emerge
from several previous data compilations such as those from forested sites in Europe (the ENSF or ECOFEE dataset) (Dise and Wright, 1995), the ICP-Waters sites in Europe and North America (Skjelkvåle et al., 2001b), lakes in Norway (Skjelkvåle et al., 1996) and upland surface waters in the UK (Allott et al., 1995). Chronic N deposition at levels above about 10 kg N ha-1 yr-1 is thus a necessary but not
sufficient factor for elevated concentrations of NO3 in surface waters.
The general absence of trends in NO3 concentrations in the 30 streams addressed here is consistent with several other analyses of N trends in surface waters in Europe. Skjelkvåle
et al. (2001c) conducted trend analyses for the period 1989–
98 on the ICP-Waters data set. They found very few significant trends in NO3 concentrations at these sites. An earlier analysis of the ICP data by Stoddard et al. (1999) showed significant trends in the region north/central Europe with increases in the 1980s followed by decreases in 1990–95.
Fig. 8. Seasonal patterns of NO3 concentrations (µeq L -1) in
streamwater at Lange Bramke, Germany, at five year intervals over the period 1970 to 1999. Stage of N saturation (after criteria of
Stoddard and Traaen, 1995) indicated.
Fig. 9. Mean concentration of NO3 (µeq L
-1) in stream waters at 30
sites in Europe and inorganic N deposition (throughfall or bulk). Time periods covered by the data differ from site-to-site (see Table 2). The vertical dotted lines indicate minimum threshold of 10 kgN ha-1 yr-1 below which all streams have very low concentrations of
NO3 and the maximum threshold of 25 kgN ha
-1 yr-1 above which all
streams have elevated concentrations of NO3 (thresholds from Dise and Wright, 1995).
The concept of N saturation implies that terrestrial catchments have a finite capacity to store N deposited from the atmosphere. A larger and larger fraction of incoming N will be leached as the capacity is gradually depleted. Thus increasing trends in NO3 concentrations in surface waters are expected in regions receiving excess N deposition.
The trend analyses presented here from other studies, however, do not show consistent regional patterns of increasing concentrations during the past 15-30 years. These empirical data from many sites in Europe show that the process of N saturation is very slow. This in turn implies that ecosystems not currently suffering from N saturation are under no immediate threat of increased NO3 leaching.
This does not, however, mean that N saturation does not occur over the long term. Synoptic empirical data for forest stands in Europe compiled by Gundersen et al. (1998), Dise
et al. (1998) and Gundersen and Kristensen (2001) show
that stands currently receiving high deposition of N (above 10 kgN ha-1 yr-1) have statistically significantly different
characteristics relative to stands receiving less than 10 kg N ha-1 yr-1. Among other factors, the C/N ratio of the forest
floor (uppermost soil layers) is significantly lower at sites receiving high N deposition. There is also a significant correlation between C/N ratio and N leached from these sites.
Measures of pools and fluxes of N within temperate and boreal forest ecosystems shows that by far the largest amount of N from deposition is stored in the soil, at least over the short-term (Nadelhoffer et al., 1999). The implication is that as a site is exposed to chronic elevated N deposition, the N retained goes mostly to the soil and leads to a lower C/N ratio in forest floor. As the C/N ratio declines, less N is retained, and more goes to run-off, and appears as NO3 in streamwater. But the trend data presented here clearly show that this evolution from N-limited to N-saturated requires at least several decades at N deposition levels typical for Europe.
N saturated sites leach significant amounts of NO3 only if they receive substantial N deposition. Large-scale experiments with roofs to exclude acid deposition all show immediate and large decreases in NO3 leached. Such experiments have been conducted at Risdalsheia, Norway (RAIN project: Wright et al., 1993; Wright and Jenkins, 2001), Ysselsteyn and Speuld, the Netherlands (NITREX project: Boxman et al., 1998) and Solling, Germany (NITREX project: Xu et al., 1998). The roof catchment experiments at Klosterhede, Denmark (Beier et al., 1998) and Gårdsjön, Sweden (Moldan et al., 2001a) are on N-limited systems. Prior to treatment these ecosystems all exhibited symptoms of N saturation with low C/N ratios in the forest floor and high concentrations of NO3 in leachate.
With exclusion of N deposition, the ecosystems stopped leaching significant amounts of NO3, despite the fact that the systems were still full of N. Nitrogen deposition is thus a necessary factor in accounting for high NO3 concentrations in surface waters. Together, the NITREX and roof experiments show that terrestrial ecosystems exhibit extreme hysteresis in run-off NO3 response to N deposition; increased NO3 concentrations come first after many decades of high N deposition, but decreases in concentrations come immediately following decreases in deposition.
In light of the quick response of the roof experiments, the recent 20% decline in N deposition in central and northern Europe should result in a commensurate decline in NO3 concentrations in surface waters. Yet trend analyses at the 30 sites gave significant declining trends at only three sites, Metzenbach in central Germany, Gårdsjön F1 control in Sweden and Storgama in southernmost Norway. The recent compilation of trends in the 1990s from the ICP-Waters programme showed significant negative trends at only eight of 96 sites (Skjelkvåle et al., 2001b).
The overall lack of significant trends in NO3 concentrations in streams in Europe may be the result of two opposing factors. Continued high deposition of N (above the 10 kgN ha-1 yr-1 threshold) should tend to increase
N saturation and give increased NO3 concentrations in run-off, whereas the decline in N deposition over the past 5–10 years in large parts of Europe should give decreased NO3 concentrations in run-off.
Nitrate concentrations in streamwater often show large regular seasonal variations, with low concentrations during the growing season and high concentrations during the dormant season. The large intra-annual variations in the data contribute substantially to the “noise” from which the long-term trend “signal” is to be separated. Furthermore, the climatic factors that influence biological activity in the terrestrial ecosystem also affect processes involved in retention and release of N in the ecosystem. Thus, the record of NO3 concentrations in streamwater will also be affected by short-term and long-term variations in climate and these variations will also mask long-term trends caused by changes in N deposition. Examples of short-term climatic variations are the cold winters followed by unusually high concentrations of NO3 in streamwater in the spring; this occurred in 1996 at sites in the UK Acid Waters Monitoring Network (Monteith et al., 2000), and in 1990 at sites in the eastern United States (Mitchell et al., 1996). The CLIMEX experiment at Risdalsheia, Norway, a N-saturated site, showed that a permanent increase in temperature of 3-5oC
results in a long-term increase in NO3 concentrations in run-off (Wright, 1998; Wright and Jenkins, 2001).
trends in response of surface waters to changes in N deposition such as the RECOVER:2010 sites described here, set the premises for predicting future concentrations of NO3 and thus future contributions of NO3 to acidification of soils and surface waters. Process-oriented acidification models such as MAGIC (Cosby et al., 2001) require such constraints so that the range of possible forecasts can be restricted. As SO4 deposition and SO4 concentrations in acidified surface waters continue to decline, the role of NO3 in acidification will become greater. Quantification of processes governing N retention and loss in semi-natural terrestrial ecosystems is thus a scientific challenge of increasing importance.
Acknowledgements
The synthesis and analysis of results reported here was carried out as part of the RECOVER:2010 project (the Commission of European Communities EVK1-CT-1999-00018). The work was financially supported in part by the German Ministry of Education and Research (grant no. PT BEO 51-0339476), the Nordic Council of Ministers, the Research Council of Norway, and the Norwegian Institute for Water Research and the Natural Environment Research Council (UK).
References
Aas, W., Tørseth, K., Solberg, S., Berg, T. and Manø, S., 2000.
Overvåking av langtransportert forurenset luft og nedbør.
Atmosfærisk tilførsel 1999. Rapport 797/00, Statens forurensningstilsyn, Oslo, Norway.
Aber, J. D., Nadelhoffer, K.J., Steudler, P. and Melillo, J., 1989. Nitrogen saturation in northern forest ecosystems. Bioscience,
39, 378–386.
Alewell, C., Prechtel, A., Bittersohl, J., Moritz, K., Meesenburg, H. and Armbruster, M., 2001. Are there signs of recovery after two decades of reduced acid input in the low mountain ranges of Germany? Hydrol. Earth Syst. Sci., 5, 367–378.
Allott, T.E.H., Curtis, C., Hall, J., Harriman, R. and Battarbee, R. W., 1995. The impact of nitrogen deposition on upland surface waters in Great Britian: A regional assessment of nitrate leaching. Water Air Soil Pollut., 85, 297–302.
Armbruster, M., 1998. Zeitliche Dynamik der Wasser- und Elementflüsse in Waldökosystemen. Freiburger Bodenkundl.
Abh., 38, 1–301.
Barrett, K., Aas, W., Hjellbrekke, A.G., Tarrason, L. and Schaug, J., 2000a. An evaluation of trends for concentrations in air and precipitation. In: Transboundary Acidification and
Eutrophication in Europe, L. Tarrason and J. Schaug (Eds.),
41–58. EMEP Summary Report 2000, Norwegian Meteorological Institute, Oslo, Norway.
Barrett, K., Schaug, J., Bartonova, A., Semb, A., Hjellbrekke, A.G. and Hanssen, J.E., 2000b. A contribution from CCC to the
re-evaluation of the observed trends in sulphur and nitrogen in Europe 1978–1998. CCC Report 7/2000, Norwegian Institute
for Air Research, Kjeller, Norway, 205 pp.
Beier, C., Blanck, K., Bredemeier, M., Lamersdorf, N., Rasmussen, L. and Xu, Y.J., 1998. Field-scale “clean rain” treatments to
two Norway spruce stands within the EXMAN project - effects on soil solution chemistry, foliar nutrition and tree growth.
Forest Ecol. Manage., 101, 111–123.
Boggero, A., Belfanti, S., Brizzio, M.C., Calderoni, A. and Mosello, R., 1996. Trends in the chemistry of surface water in north-western Italy. IV. Nitrogen in sub-alpine rivers Pellino, Pellesino, Pescone and Cannobino (Lago Maggiore watershed).
Mem. Ist. Ital. Idrobiol., 54, 143–160.
Boxman, A.W., van der Ven, P.J.M. and Roelofs, J.G.M., 1998. Ecosystem recovery after a decrease in nitrogen input to a Scots pine stand at Ysselsteyn, the Netherlands. Forest Ecol. Manage.,
101, 155–164.
Bull, K.R., Achermann, B., Bashkin, V., Chrast, R., Fenech, G., Forsius, M., Gregor, H-D., Guardans, R., Haussmann, T., Hayes, F., Hettelingh, J.P., Johannessen, T., Krzyzanowski, M., Kucera, V., Kvæven, B., Lorenz, M., Lundin, L., Mills, G., Posch, M., Skjelkvåle, B.L. and Ulstein, M.J., 2001. Coordinated effects monitoring and modelling for developing and supporting international air pollution control agreements. Water Air Soil
Pollut., (in press).
Cosby, B.J., Ferrier, R.C., Jenkins, A. and Wright, R.F., 2001. Modelling the effects of acid deposition: refinements, adjustments and inclusion of nitrogen dynamics in the MAGIC model. Hydrol. Earth Syst. Sci., 5, 499–517.
Dise, N.B. and Wright, R.F., 1995. Nitrogen leaching from European forests in relation to nitrogen deposition. Forest Ecol.
Manage., 71, 153–162.
Dise, N.B., Matzner, E. and Forsius, M., 1998. Evaluation of organic horizon C:N ratio as an indicator of nitrate leaching in conifer forests across Europe. Environ. Pollut., 102, 453-461. Evans, C.D. and Monteith, D.T., 2001. Chemical trends at lakes
and streams in the UK Acid Waters Monitoring Network, 1988– 2000: evidence for recent recovery at a national scale. Hydrol.
Earth Syst. Sci., 5, 351–366.
Evans, C.D., Cullen, J.M., Alewell, C., Marchetto, A., Moldan, F., Kopácek, J., Prechtel, A., Rogora, M., Veselý, J. and Wright, R.F., 2001. Recovery from acidification in European surface waters. Hydrol. Earth Syst. Sci., 5, 383–297.
Ferrier, R.C., Jenkins, A., Wright, R.F., Schöpp, W. and Barth, H., 2001. Assessment of recovery of surface waters from acidification, 1970-2000: Introduction to the Special Issue.
Hydrol. Earth Syst. Sci., 5, 374–282.
Gundersen, P. and Kristensen, H.L., 2001. Nitrogen input, cycling and leaching in European forests. Water Air Soil Pollut., xxx-xxx. Gundersen, P., Callesen, I. and de Vries, W., 1998. Nitrate leaching in forest ecosystems is controlled by forest floor C/N ratio.
Environ. Pollut., 102, 403–407.
Hauhs, H., 1990. Lange Bramke: An ecosystem study of a forested watershed. In: Acidic Precipitation, Vol. 1, Case Studies (D.C. Adriano and M. Havas (Eds.)), 275-305. Springer, New York. Kopáèek, J., Stuchlík, E., Fott, J., Veselý, J. and Hejzlar, J., 1998. Reversibility of acidification of mountain lakes after reduction in nitrogen and sulfur emissions in central Europe.
Limnol.Oceanogr., 43, 357–361.
Kvæven, B., Ulstein, M.J., Skjelkvåle, B.L. and Raddum, G.G., 2001. ICP Waters - An international programme for surface water monitoring. Water Air Soil Pollut., (in press).
LfW, 1994. Bayerisches Landesamt für Wasserwirtschaft. Auswirkungen des sauren Regens und des Waldsterbens auf das Grundwasser. Dokumentation der Methoden und Mebdaten des Entwicklungsvorhabens 1988-1992. Materialen, 40, 1–387. Lundin, L., Kleemola, S. and Forsius, M., 2001. Observing effects of air pollution and climate change by integrated monitoring of ecosystems. Water Air Soil Pollut., (in press).
Lydersen, E., 1994. Long-term Monitored Catchments in Norway
Report 34-A/1994, Norwegian Institute for Water Research, Oslo, Norway. 306 pp.
Mitchell, M.J., Driscoll, C.T., Kahl, J.S., Likens, G.E., Murdoch, P.S. and Pardo, L.H., 1996. Climatic control of nitrate loss from forested watersheds in the northeast United States. Environ. Sci.
Technol., 30, 2609–2612.
Moldan, F. and Wright, R.F., 1998. Changes in run-off chemistry after 5 years of N addition to a forested catchment at Gårdsjön, Sweden. Forest Ecol. Manage., 101, 187–198.
Moldan, F., Hultberg, H., Munthe, J., Mörth, M. and Torssander, P., 2001a. Results from the covered catchment experiment at Gårdsjön, Sweden, after nine years of clean precipitation treatment. Water Air Soil Pollut., (in press).
Moldan, F., Wright, R.F., Löfgren, S., Forsius, M. and Skjelkvåle, B. L., 2001b. Long-term changes in acidification and recovery at nine calibrated catchments in Norway, Sweden and Finland.
Hydrol. Earth Syst. Sci., 5, 339–349.
Monteith, D.T. and Evans, C.D., 2000. 10 Year Report. Analysis
and Interpretation of Results, April 1988 - March 1998. UK Acid Waters Monitoring Network. ENSIS Publishing, London,
363 pp.
Monteith, D.T., Evans, C.D. and Reynolds, B., 2000. Are temporal variations in the nitrate content of UK upland freshwaters linked to the North Atlantic Oscillation? Hydrol. Process., 14, 1745– 1749.
Mosello, R., Marchetto, A., Brizzio, M.C., Rogora, M. and Tartari, G.A., 2000. Results from the Italian participation in the International Co-operative Programme on Assessment and Monitoring of Acidification of Rivers and Lakes (ICP Waters).
J. Limnol., 59, 47–54.
Nadelhoffer, K.J., Emmett, B.A., Gundersen, P., Kjønaas, O.J., Koopmans, C.J., Schleppi, P., Tietema, A., and Wright, R.F., 1999. Nitrogen deposition makes a minor contribution to carbon sequestration in temperate forests. Nature, 398, 145–148. Prechtel, A., Alewell, C., Armbruster, M., Bittersohl, J., Cullen,
J.M., Evans, C.D., Helliwell, R.C., Kopáèek, J., Marchetto, A., Matzner, E., Meesenburg, H., Moldan, F., Moritz, K., Veselý, J. and Wright, R.F., 2001. Response of sulphur dynamics in European catchments to decreasing sulphate deposition. Hydrol.
Earth Syst. Sci., 5, 367–378.
Rogora, M., Marchetto, A. and Mosello, R., 2001. Trends in the chemistry of atmospheric deposition and surface waters in Lake Maggiore watershed. Hydrol. Earth Syst. Sci., 5, 379–390. SFT, 2000. Overvåking av langtransportert forurenset luft og
nedbør. Årsrapport - Effekter 1999. Statlig program for
forurensningsovervåking Rapport Statens forurensningstilsyn, Oslo, Norway, 198 pp.
Skjelkvåle, B. L. and Tørseth, K., 2001. Decrease in acid deposition — recovery in Norwegian waters. Water Air Soil
Pollut, (in press).
Skjelkvåle, B.L., Henriksen, A., Faafeng, B., Fjeld, E., Traaen, T.S., Lien, L., Lydersen, E. and Buan, A.K., 1996. Regional
innsjøundersøkelse 1995. En vannkjemisk undersøkelse av 1500
norske innsjøer. Statlig program for forurensningsovervåking
Rapport 677/96, Statens forurensningstilsyn, Oslo, Norway, 73 pp. Skjelkvåle, B.L., Andersen, T., Mannio, J. and Wilander, A., 2001a. Recovery in small lakes in the Nordic countries. Hydrol.
Earth Syst. Sci., 5, 327–337.
Skjelkvåle, B.L., Olendrzynski, K., Stoddard, J.L., Traaen, T.S. and Wright, R.F., 2001b. Assessment of trends and leaching of
nitrogen at ICP Waters sites (Europe and North America). SNO
4383/2001, ICP Waters Report 54/2001, Norwegian Institute for Water Research, Oslo, Norway, 42 pp.
Skjelkvåle, B.L., Stoddard, J.L. and Andersen, T., 2001c. Trends in surface waters acidification in Europe and North America (1989-1998). Water Air Soil Pollut., (in press).
Stoddard, J.L., 1994. Long-Term Changes in Watershed Retention of Nitrogen: its causes and aquatic consequences. In:
Environmental Chemistry of Lakes and Reservoirs, L.A. Baker
(Ed.), 223-284. ACS Advances in Chemistry Series no. 237., American Chemical Society, Washington, DC.
Stoddard, J.L. and Traaen, T.S., 1995. The stages of nitrogen saturation: Classification of catchments included in «ICP on waters». In: Mapping and modelling of critical loads for nitrogen
- a workshop report , M. Hornung, M.A. Sutton and R.B. Wilson
(Eds.), 69–76. Proceedings of the Grange-over-Sands Workshop, 24-26 Oct., 1994, Institute of Terrestrial Ecology, Edinburgh, UK. Stoddard, J.L., Jeffries, D.S., Lükewille, A., Clair, T.A., Dillon, P.J., Driscoll, C.T., Forsius, M., Johannessen, M., Kahl, J.S., Kellogg, J.H., Kemp, A., Mannio, J., Monteith, D., Murdoch, P.S., Patrick, S., Rebsdorf, A., Skjelkvåle, B.L., Stainton, M. P., Traaen, T.S., van Dam, H., Webster, K.E., Wieting, J. and Wilander, A., 1999. Regional trends in aquatic recovery from acidification in North America and Europe 1980-95. Nature,
401, 575–578.
Stoddard, J.L., Traaen, T.S. and Skjelkvåle, B.L., 2001. Assessment of nitrogen leaching at ICP-Waters sites (Europe and North America). Water Air Soil Pollut., (in press). Tamm, C.O., 1991. Nitrogen in Terrestrial Ecosystems. Ecological
Studies 81. Springer, Berlin, 115 pp.
Tarrason, L. and Schaug, J., 2000. Transboundary Acidification
and Eutrophication in Europe. EMEP Summary Report 2000.
EMEP/MSC-W 1/2000, Norwegian Meteorological Institute, Oslo, Norway, 264 pp.
Wright, R.F., 1998. Effect of increased CO2 and temperature on run-off chemistry at a forested catchment in southern Norway (CLIMEX project). Ecosystems, 1, 216–225.
Wright, R.F. and Jenkins, A., 2001. Climate change as a confounding factor in reversibility of acidification: RAIN and CLIMEX projects. Hydrol. Earth Syst. Sci., 5, 477–486. Wright, R.F., Lotse, E. and Semb, A., 1993. RAIN project: results
after 8 years of experimentally reduced acid deposition. Can.
J. Fisheries Aquat. Sci., 50, 258–268.
Xu, Y.J., Blanck, K., Bredemeier, M. and Lamersdorf, N., 1998. Hydrochemical input-output budgets for a clean rain and drought experiment at Solling. Forest Ecol. Manage., 101, 295–306.