HAL Id: hal-00304193
https://hal.archives-ouvertes.fr/hal-00304193
Submitted on 28 May 2008HAL is a multi-disciplinary open access
archive for the deposit and dissemination of sci-entific research documents, whether they are pub-lished or not. The documents may come from teaching and research institutions in France or abroad, or from public or private research centers.
L’archive ouverte pluridisciplinaire HAL, est destinée au dépôt et à la diffusion de documents scientifiques de niveau recherche, publiés ou non, émanant des établissements d’enseignement et de recherche français ou étrangers, des laboratoires publics ou privés.
1-D air-snowpack modeling of atmospheric nitrous acid
at South Pole during ANTCI 2003
Wei Liao, D. Tan
To cite this version:
Wei Liao, D. Tan. 1-D air-snowpack modeling of atmospheric nitrous acid at South Pole during ANTCI 2003. Atmospheric Chemistry and Physics Discussions, European Geosciences Union, 2008, 8 (3), pp.9731-9759. �hal-00304193�
ACPD
8, 9731–9759, 2008 1-D air-snowpack modeling of atmospheric nitrous acidWei Liao and D. Tan
Title Page Abstract Introduction Conclusions References Tables Figures ◭ ◮ ◭ ◮ Back Close
Full Screen / Esc
Printer-friendly Version Interactive Discussion
Atmos. Chem. Phys. Discuss., 8, 9731–9759, 2008 www.atmos-chem-phys-discuss.net/8/9731/2008/ © Author(s) 2008. This work is distributed under the Creative Commons Attribution 3.0 License.
Atmospheric Chemistry and Physics Discussions
1-D air-snowpack modeling of
atmospheric nitrous acid at South Pole
during ANTCI 2003
Wei Liao and D. Tan
Georgia Institute of Technology, Earth and Atmospheric Sciences Department, 311 Ferst Dr. Atlanta, GA 30332, USA
Received: 26 February 2008 – Accepted: 21 April 2008 – Published: 28 May 2008 Correspondence to: D. Tan ([email protected])
ACPD
8, 9731–9759, 2008 1-D air-snowpack modeling of atmospheric nitrous acidWei Liao and D. Tan
Title Page Abstract Introduction Conclusions References Tables Figures ◭ ◮ ◭ ◮ Back Close
Full Screen / Esc
Printer-friendly Version Interactive Discussion Abstract
A 1-D air-snowpack model of HONO has been developed and constrained by observed chemistry and meteorology data. The 1-D model includes molecular diffusion and mechanical dispersion, windpumping in snow, gas phase to quasi-liquid layer phase HONO transfer and quasi-liquid layer nitrate and interstitial air HONO photolysis.
Pho-5
tolysis of nitrate is important as a dominant HONO source inside the snowpack, how-ever, the observed HONO emission from the snowpack was triggered mainly by the equilibrium between quasi liquid layer nitrite and firn air HONO deep down the snow surface (i.e. 30 cm below snow surface). The high concentration of HONO in the firn air is subsequently transported above the snowpack by diffusion and windpumping. The
10
model uncertainties come mainly from lack of measurements and the interpretation of the QLL properties based on the bulk snow measurements. One critical factor is the ionic strength of QLL nitrite, which is estimated here by the bulk snow pH, nitrite concentration, and QLL to bulk snow volume ratio.
1 Introduction
15
Increasing interest has been focused on the measurement of atmospheric nitrous acid (HONO) in the high latitude boundary layer. HONO plays an important role in the atmosphere due to its photo-dissociation by UV radiation into hydroxyl (OH) and nitric oxide (NO) radicals. As a result of poor vertical mixing in the polar lower atmosphere, snow pack emissions of HONO remain confined to a thin layer near the surface, where
20
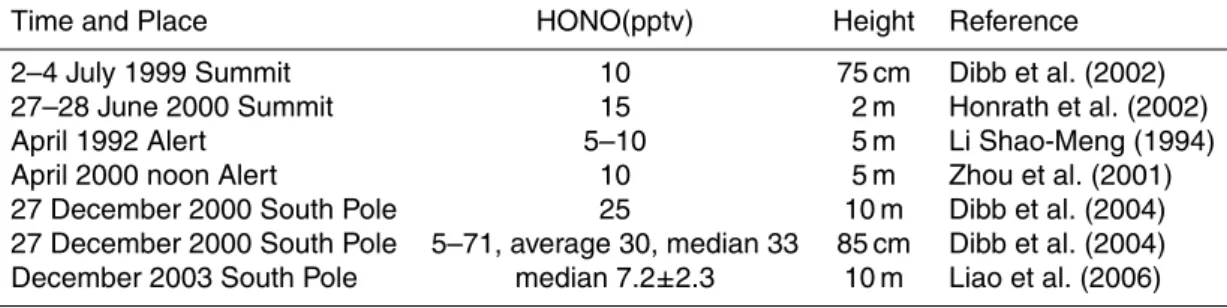
HONO can give rise to a much greater production of OH radicals in Arctic polar sunrise than previously believed (Domine and Shepson, 2002). A number of measurements (Table 1) report elevated HONO concentrations, sometimes much higher than can be accounted for in photochemistry models. The high levels of HONO reported often lead to a dramatic over-prediction of HOx (Davis et al., 2004) and sometimes NOx
25
ACPD
8, 9731–9759, 2008 1-D air-snowpack modeling of atmospheric nitrous acidWei Liao and D. Tan
Title Page Abstract Introduction Conclusions References Tables Figures ◭ ◮ ◭ ◮ Back Close
Full Screen / Esc
Printer-friendly Version Interactive Discussion
measurements of OH, HO2 and NO. These results raised possible missing sinks for HOxand NOxor, alternatively, problems with the HONO measurements.
The Antarctic Troposphere Chemistry Investigation (ANTCI) is a four-year program including two major field studies (2003 and 2005) in Antarctica. The major science objectives are to evaluate the physical and chemical processes of nitrogen oxides and
5
hydrogen oxides; to compare boundary layer measurements of South Pole with other regions of Antarctica; and to investigate the importance and location of the coast-to-plateau transport of sulfur. Measurements during ANTCI 2003 at the Amundsen-Scott South Pole Station include OH, HO2, H2SO4, HONO, HO2NO2, SO2, HNO3, NO, NOy,
O3, PAN, H2O2, HCHO, non-methane hydrocarbons, halocarbons, CH4, CO, DMS,
10
aerosol chemical composition, Hg, temperature, relative humidity, wind speed, wind direction, boundary layer height and actinic fluxes.
The gas phase HONO mixing ratios are measured by mist chamber/ion chromatog-raphy (MC/IC) and laser-induced fluorescence (LIF) techniques. MC/IC observations were higher than the LIF observations by a factor of 7.2±2.3 in the median. Both
mea-15
surement results are significantly higher than what a pure gas phase model can predict (Liao et al., 2006). Quantifying the amount of HONO emitted by snowpack is important for the photochemistry budget, especially the HOxbudget. Furthermore, a deeper un-derstanding of the heterogeneous processes involving snowpack important to HONO is also necessary to account for additional source/sink of HONO. Consequently, the
20
main goal of this paper is the quantitative assurance of these elevated daytime HONO mixing ratios, which are used to evaluate the importance of HONO with respect to HOx and the possible magnitude of snow emission of HONO.
ACPD
8, 9731–9759, 2008 1-D air-snowpack modeling of atmospheric nitrous acidWei Liao and D. Tan
Title Page Abstract Introduction Conclusions References Tables Figures ◭ ◮ ◭ ◮ Back Close
Full Screen / Esc
Printer-friendly Version Interactive Discussion 2 Model description
2.1 Overview of the snowpack model
Current research in polar snow chemistry focuses on the chemical and physical transfer processes that control the concentrations and fluxes of the atmospheric components. Understanding the transfer processes is essential to snow chemistry. To the best of the
5
authors’ knowledge, models for investigating snow chemistry to date only include hy-drogen peroxide by McConnell et al. (1998) and formaldehyde by Hutterli et al. (1999). They use parameterizations to relate gas concentrations in the ice to those in the firn air (Domine et al., 2008).
A series of field campaigns (e.g. Greenland (Honrath et al., 1999, 2002), ISCAT
10
(Davis et al., 2004), CHABLIS (Jones et al., 2007), etc.) in polar regions have spurred intense interest in the photochemistry occurring in snow. Because snow has a large surface-to-volume ratio, it can efficiently remove atmospheric trace gases from the gas phase by adsorption, thus modifying atmospheric composition. Adsorbed gases can release reactive trace gases back to the interstitial air via heterogeneous
photochem-15
istry. Changes in wind speed and wind direction may affect snowpack ventilation and therefore interstitial air species may come out of the snowpack via diffusion and wind-pumping processes.
The boundary layer is ubiquitously stable in polar region, due to the combined ef-fects of the infra-red properties and albedo of the snow and low sun angle (Anderson
20
and Neff, 2007). The lack of diurnal radiation variations during ANTCI 2003 makes the stable boundary layer condition with suppressed vertical mixing more obvious at South Pole than at other polar locations (Helmig et al., 2007). This causes snowpack emissions at South Pole to accumulate to higher mixing ratios than other polar sites.
Photochemical production of HONO has been reported as products of nitrate
pho-25
tolysis in natural and artificial snow (Honrath et al., 1999, 2000). Sampling of HONO 30 cm below the snow surface found levels much higher than at 10 cm below the snow surface (Jacobi et al., 2004). Photolysis of nitrate alone cannot explain the measured
ACPD
8, 9731–9759, 2008 1-D air-snowpack modeling of atmospheric nitrous acidWei Liao and D. Tan
Title Page Abstract Introduction Conclusions References Tables Figures ◭ ◮ ◭ ◮ Back Close
Full Screen / Esc
Printer-friendly Version Interactive Discussion
high concentration of ambient HONO because there is hardly any actinic flux 30 cm deep in the snow. We assume that the NO−2 in the quasi-liquid layer is the source of snowpack emission of HONO:
NO−
2(aq)+ H +
(aq) ⇋HONO(aq)
Henry’s Law
←→ HONO(gas) (1)
NO−2 is protonated to produce HONO which will be released into the gas phase. The
5
HONO has a long life time deep below the snow surface so that the equilibrium be-tween quasi-liquid nitrite and interstitial air HONO according to Henry’s law is reached. This high interstitial air HONO is transported to the surface snow by windpumping and subsequent diffusion to the ambient air. During this transport process, HONO concentrations are reduced by photolysis and uptake on ice. In this way, the HONO
10
concentration is greater deep into the snowpack and its concentration is proportional to snowpack nitrite concentration, which in turn is very sensitive to the acidity of the snowpack. Photolysis of nitrate as well as NO2hydrolysis could serve as the source of nitrite. Modeling of the nitrite and nitrate in the quasi-liquid layer is beyond the scope of this paper. We assume constant vertical profiles of nitrate and nitrite concentration in
15
the absence of profile measurements. We build a comprehensive 1-D model to quantify the above mentioned processes.
The model comprises of wind pumping, diffusion, chemistry, and inter-phase transfer processes. First we describe the wind pumping and actinic flux inside the snowpack. We further discuss chemical sources and sinks and quasi liquid layer nitrite partitioning
20
to explain the observed high HONO concentrations above the snow surface and how this high concentration HONO is ventilated throughout the snowpack. In the end, we briefly discuss the factors important to quantifying snowpack HONO emission. The model is highly constrained by available measurement data including dimensions of sastrugi, snow surface actinic flux, bulk snow pH, bulk snow [NO−
3], bulk snow [NO − 2],
25
ACPD
8, 9731–9759, 2008 1-D air-snowpack modeling of atmospheric nitrous acidWei Liao and D. Tan
Title Page Abstract Introduction Conclusions References Tables Figures ◭ ◮ ◭ ◮ Back Close
Full Screen / Esc
Printer-friendly Version Interactive Discussion
2.2 Wind pumping
Waddington et al. (1996) estimated that the surface area of ice grains in the upper 7 cm was more than three orders of magnitude larger than the area of a smooth impenetrable surface. Therefore the snow surface may be considered to be a big chemical reaction chamber. The transfer of local chemical tracers into the snow or vice versa by air
5
flow through the snow (wind pumping) is important for snow chemistry. Snow contains varying quantities of air, the large part of this air volume will be replaced frequently due to changes of air pressure and strong winds above the surface. The snow structure and surface roughness will determine the ventilation processes.
Sastrugi are meter-scale longitudinal dunes eroded by the wind. Sastrugi are most
10
prominent where ice-sheet surfaces are exposed to persistent strong winds from a single direction, as on the perimeter of East Antarctica. At the South Pole, the winds are weaker and more variable, and the lengths of sastrugi are typically a few meters, widths 1 m, and heights 0.1–0.5 m. Sometimes there are two or three sets of sastrugi crossing each other and forming a network of ridges (Warren et al., 1998).
15
Air pressure should be elevated over some area on the upwind face of a topographic bump due to dynamic wind pressure, and should be lowered over some area on the lee side near the crest of the bump due to the airfoil effect associated with the increased velocity. The pressure differences on the surface would induce pressure gradients and steady air flow within the bump and surrounding snow. Toyota and McConnell
20
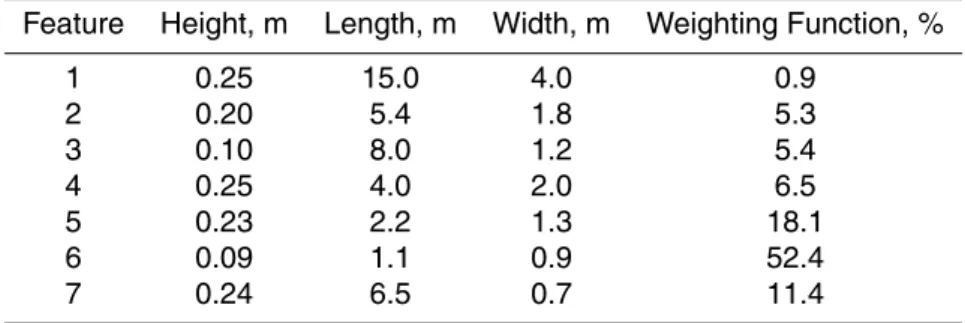
(2005) derived the mean 1-D wind pumping speed for the Darcy’s flow rate within snowpack. We applied their windpumping model under conditions relevant to the South Pole.during ANTCI 2003 There are no sastrugi measurements from ANTCI 2003. Here the 1994 South Pole summertime measurement data are used (Table 2) (Warren et al., 1998). The weighting function is assumed to be inversely proportional to the sastrugi’s
25
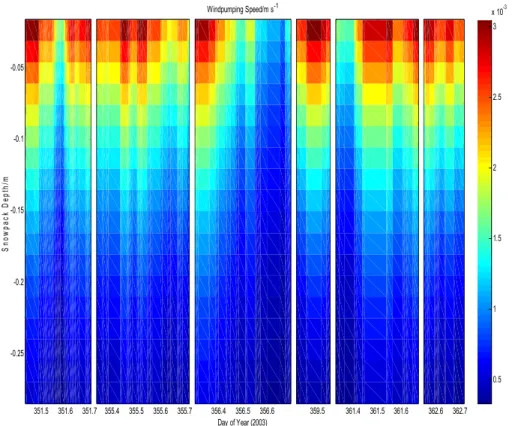
area (Stephen Warren, personal communication, 2006). We multiply each wind pump-ing speed with the respective weightpump-ing function and add them together to get the mean wind pumping speed (Fig. 1).
ACPD
8, 9731–9759, 2008 1-D air-snowpack modeling of atmospheric nitrous acidWei Liao and D. Tan
Title Page Abstract Introduction Conclusions References Tables Figures ◭ ◮ ◭ ◮ Back Close
Full Screen / Esc
Printer-friendly Version Interactive Discussion
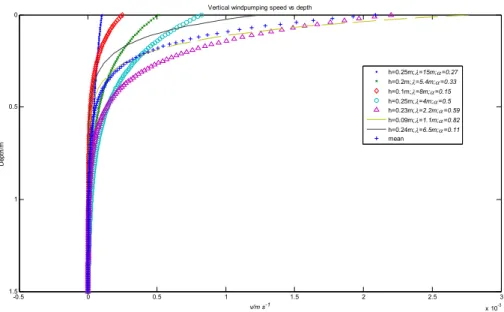
The largest uncertainties of wind pumping arise from the parameterization of the snow microtopography and from the permeability of the near-surface snow (Cunning-ham and Waddington, 1993). For example, the windpumping speed based on the sastrugi feature 6 in Table 2 is twenty times of that based on feature 1 near the surface, and the difference decreases exponentially with the depth (Fig. 2).
5
2.3 Actinic flux inside the snowpack
The snowpack is modeled as a diffusive medium with actinic flux circulating through it. A two-stream method was used for the movement (Toon et al., 1989). Actinic flux is divided into an upward and downward component. Each of the components is approx-imated with a forward and backward probability function. Scattering by snow grains
10
has a forward diffraction peak, making two-stream expansion of the probability function inadequate. To correct this, a Delta-Eddington algorithm (Joseph et al., 1976) is used, which uses a delta function in the forward direction and a smooth scaled probability function. The optical properties of the snowpack are described by scattering and im-purity absorption cross sections, as well as the snowpack density. Empirical values for
15
absorption and scattering coefficients are parameterized to match the existing obser-vation data at polar regions so that no knowledge of the snow crystal size or shape is required (Lee-Taylor and Madronich, 2002). The diffusion equation was solved numeri-cally by defined boundary conditions. The snow top boundary condition is derived from the Tropospheric Ultraviolet Visible (TUV) model (Madronich and Flocke, 1998). The
20
TUV model is used to parameterize the atmospheric conditions on a cloudless day (21 December 2003). Cloud optical density and O3 and NO2columns are chosen so that the values of J(O1D) and J(NO2) from the model output match those derived by the Biospherical Company using an Eppley radiometer during ANTCI 2003. We scale ev-ery data point based on measured J(NO2) and J(O
1
D) for that data point, which reflects
25
the changing optical depth above the snow surface.
For the bottom layer of the snow, the upward flux is zero.
ACPD
8, 9731–9759, 2008 1-D air-snowpack modeling of atmospheric nitrous acidWei Liao and D. Tan
Title Page Abstract Introduction Conclusions References Tables Figures ◭ ◮ ◭ ◮ Back Close
Full Screen / Esc
Printer-friendly Version Interactive Discussion
convolution product over all wavelengths:
Jx = Z
σx(λ)Φx(λ)F (λ)d λ (2)
Here, F (λ) is the spectral actinic flux (radiant flux density incident onto a spherical
area) andσ(λ) and Φ(λ) are, respectively, the absorption cross-section and the
pho-todissociation quantum yield of the moleculex at wavelength λ. The absorption spectra
5
and temperature-dependent quantum yield of nitrate are taken from Burley and John-ston (1992), Chu and Anastasio (2003), Warneck and Wurzinger (1988), Zellner, et al. (1990) and Bartels-Rausch and Donaldson (2006). The e-folding depths for J(NO−3) and J(HONO) are 6 cm and 8 cm respectively.
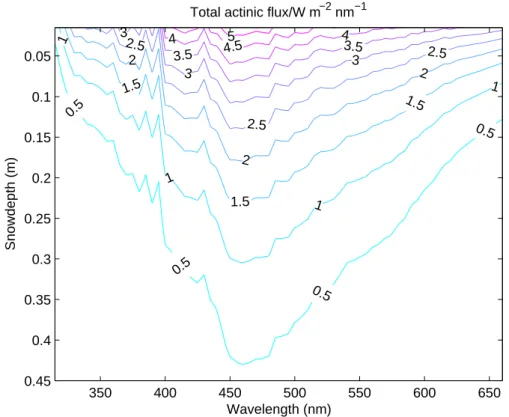
Figure 3 shows the total actinic flux changing with snowpack and wavelength. The
10
total actinic flux peaks around 450 nm because the snow/ice has minimum absorption at this wavelength (Grenfell and Perovich, 1986; Perovich and Govoni, 1991). The structure between 300 nm and 400 nm is inherited from the incoming actinic flux at the snow surface.
2.4 Master equation and model results
15
The quasi-liquid layer (QLL) is a disordered layer of ice at the surface that has chemical properties closer to liquid water than solid crystalline ice (Boxe, 2005). Ionic solutes are efficiently excluded from the ice matrix upon freezing, and in the presence of solutes it is not clear whether the surface layer of ice is a true liquid or a quasi-liquid. There are no reaction data for the QLL phase reactions or for the thickness of the QLL as a
20
function of temperature for solute-containing ices. The model assumes that the surface layer is a true liquid with a significant freezing point depression and uses the known aqueous phase reactions. Henceforth we will refer to this layer as the surface layer or the “QLL” to distinguish it from the true QLL that forms on pure water ices. The volume exclusion factor, that is, the surface layer thickness relative to the snow grain
25
ACPD
8, 9731–9759, 2008 1-D air-snowpack modeling of atmospheric nitrous acidWei Liao and D. Tan
Title Page Abstract Introduction Conclusions References Tables Figures ◭ ◮ ◭ ◮ Back Close
Full Screen / Esc
Printer-friendly Version Interactive Discussion
solute concentration.
Diffusion and ventilation are two important processes that affect the movement of trace gases within a snowpack. Diffusion is a transport process driven by both concen-tration and temperature gradients, where wind ventilation provides an advective trans-port process with interstitial air movement within the snowpack. Trace gas
concentra-5
tions are also affected by in situ chemistry production/loss and gas/liquid exchange. We model interstitial HONO using the combination of one-dimensional advection-dispersion equation by McConnell et al. (1998) and multiphase model by Sportisse and Djouad (2000): ∂Cg ∂t =D ∂2Cg ∂z2 − U ∂Cg ∂z +Qg− Sg− 3 λm a × LWC 1 − LWC × (Cg− Ca× P H × 10 12) (3) 10
whereCg/Cais the gas/liquid phase HONO concentration,t and z are time and depth
respectively. The first two terms describe transport of gas phase HONO by dispersion and convection. D is the dispersion, including both gas-phase molecular diffusion Dg
and mechanical dispersion Dm. The mechanical dispersion is caused by advective mixing of tracers on the pore scale and is given by the product of the absolute value
15
of the flow velocity fieldv and a dispersion length (generally taken as the mean pore
diameter)d (Neuweiler et al., 2001). Under South Pole conditions, d is 2 mm (Waldner
et al., 2004), the daily average pore velocities range from 10−2 to 10−4m/s. D
g is
1.4×10⁻⁵m2/s (Reid et al., 1987; Ervens et al., 2003). U is the wind pumping velocity
of the air in thez direction.
20
Q and S represent the chemical sources and sinks for gas phase HONO within the
snowpack. Here we assume that HONO photolysis is the most important sink and NO−
3 photolysis is the most important source. Snowpack nitrate profiles were not mea-sured, so the concentration of NO−3 is assumed to be constant with snow depth, which is NO−3=2×10⁻⁵mol/kg (Jack Dibb, personal communication, 2006). The J values of
25
nitrate and nitrite have similar behavior with depth through out snowpack. Snow pit measurements by the University of New Hampshire (Dibb, personal communication)
ACPD
8, 9731–9759, 2008 1-D air-snowpack modeling of atmospheric nitrous acidWei Liao and D. Tan
Title Page Abstract Introduction Conclusions References Tables Figures ◭ ◮ ◭ ◮ Back Close
Full Screen / Esc
Printer-friendly Version Interactive Discussion
show that bulk nitrite concentrations are four orders of magnitude less than that of nitrate. It is not feasible to model snow-phase nitrite for ANTCI 2003, given the lack of profiles and the limited chemical measurements in the snowpack: here we use the UNH bulk nitrite and assume a constant concentration of nitrite with snow depth.
The transfer of molecules from the interstitial air to the “QLL” and vice versa is treated
5
by the last term in Eq. (3). The net flux is the difference of the departure from Henry’s law equilibrium at the surface and the reactive uptake of HONO on the snow surface. Trace gases can diffuse to the “QLL” or collide and stick to the surface of “QLL”. In the case of HONO, the mass transfer is controlled mainly by the interfacial mass transport term (Schwartz, 1986). Mass accommodation coefficient and reversible dissolution
10
according to the Henry’s Law are taken into account. LWC is the unitless liquid water content:
LWC=ρfirn
ρice × QLL to snow volume ratio=0.47 × 2 × 10
−3=9.4 × 10⁻⁴ vol/vol.
λm describes the mass transfer through gas-liquid phase:
λm =
1
4α ¯v (4)
15
The QLL to snow volume ratio is taken from Michalowski et al. (2000). α is the mass
accommodation coefficient; ¯v is the mean molecular velocity; a is the snow grain radius. H stands for the Henry law constant and P is the pressure. The factor 1012 in Eq. (3) is used to scale to the gas phase concentration in units of part per trillion (ppt).
The solar zenith angle during ANTCI 2003 is near constant and the constrained
20
input data points are ten minute averages. It is reasonable to assume quasi-steady state conditions for gas phase concentrations, that is ∂C∂t=0. Equation (3) then reduces to an ordinary differential equation, which is solved numerically (Matlab, Natick, MA) for the top 30 cm of the snowpack, using 20 uniformly distributed layers for a vertical resolution of 1.5 cm. Photolysis frequencies in the snowpack were calculated using the
25
ACPD
8, 9731–9759, 2008 1-D air-snowpack modeling of atmospheric nitrous acidWei Liao and D. Tan
Title Page Abstract Introduction Conclusions References Tables Figures ◭ ◮ ◭ ◮ Back Close
Full Screen / Esc
Printer-friendly Version Interactive Discussion
3 Results and dicsussion
3.1 Model results
The windpumping speed and actinic flux decrease sharply with the depth. Deep below the snowpack surface, chemical reaction rates are slow enough that the gas phase HONO reaches equilibrium with the “QLL” phase HONO according to Henry’s Law.
5
Due to the lack of a measured nitrite profile, here we use a constant snowpack ni-trite concentration. The bulk snow nini-trite concentration, the median value of measured snowpack pH and “QLL” volume ratio were used to estimate the aqueous phase HONO concentration. Deep below the snow surface, we assume no vertical gradient (∂C∂zg=0) and below the photic zone Eq. (3) simplifies to exactly the form of Henry’s Law.
Assum-10
ing a bulk nitrite concentration of 20 nM and a “QLL” volume exclusion factor of 10−3, the interstitial air HONO mixing ratio deep in the snowpack is estimated to be about 164 pptv.
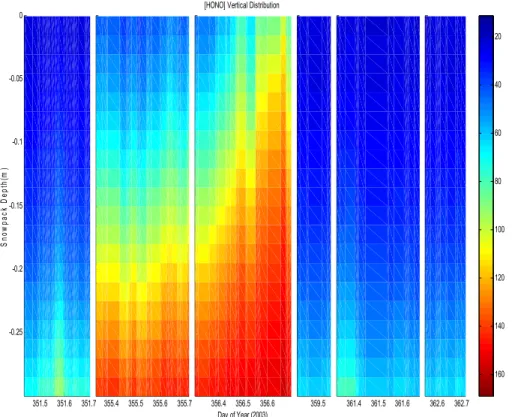
Figure 4 shows the modeled HONO vertical profile inside the snowpack on 17, 21, 22, 25, 27 and 28 December. HONO distributions are primarily controlled by
wind-15
pumping, and concentrations decrease significantly on 17, 25, 27 and 28 December when the boundary layer is high and the chemical migration is large due to advective transport (Fig. 5). On 21 and 22 December, the mean boundary layer depth is only 25.55 m and the atmosphere is very stable, in the low-wind scenario the migration of HONO in the snowpack can be largely attributed to diffusive transport.
20
3.2 Model sensitivity analysis
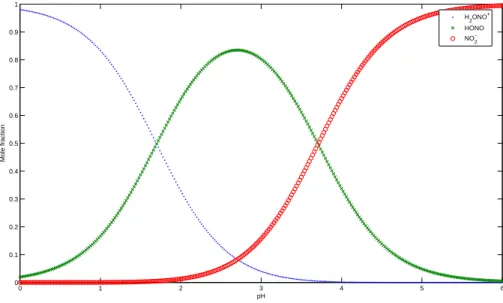
Nitrous acid (HONO) and the nitrite ion represent a particularly important conjugate pair in the surface layer of ice. In highly acidic media, HONO will form nitroacidium ion, H2ONO + : H2ONO + (aq) H+ ←→ HONO(aq) H + ←→ NO−2(aq) (5) 25
ACPD
8, 9731–9759, 2008 1-D air-snowpack modeling of atmospheric nitrous acidWei Liao and D. Tan
Title Page Abstract Introduction Conclusions References Tables Figures ◭ ◮ ◭ ◮ Back Close
Full Screen / Esc
Printer-friendly Version Interactive Discussion
pKa1=1.7, pKa2=2.8 (Riordan et al., 2005)
HONO(aq)=[H2ONO + aq+ HONOaq+ NO−2 aq] pKa1[H+] [H+]2+ pK a1[H+] + pKa1pKa2 (6)
The HONO concentration is very sensitive to the pH, “QLL” to snow volume ratio and nitrite concentration of the snowpack (Table 3). From the table we can infer no nitrous acid emission on alkaline snow surfaces, which is consistent with the field
measure-5
ments of Beine et al. (2005).
A major uncertainty is the “QLL” to snow volume ratio (the volume exclusion factor) which is likely to be strongly dependent on temperature. Here we have assumed a ratio of 10−3: this is larger than the ratio for pure water ice because of the presence of solutes. The use of known liquid phase reaction mechanisms implicitly assumes that
10
on freezing solutes are excluded to the surface of the ice, which develops a layer or possibly domains of highly concentrated liquid solution. That is, the surface layer is assumed to be a true liquid with high solute concentration, not a “quasiliquid”. This ratio is not known for naturally occurring ices, which are never pure. It is expected that the volume exclusion factor depends on total ionic strength as well as temperature.
15
However, the nature of the surface of real-world ices is not known. This is a major model uncertainty. For instance, if the ratio is very low, such as is shown in the right panel of Table 3, we will need to revisit the relationship between surface volume layer and chemical concentration in this layer. If the thickness of “QLL” is very thin, it is unlikely that ions, such as NO−3, will be solvated in this super-saturated solution in the
20
quasi-liquid layer. In that case, some fraction of the ions will likely be excluded as crystals and we will need to estimate the saturation concentration for that temperature in the “QLL”.
The volume exclusion factor also affects the liquid phase pH. Aqueous phase HONO concentrations in the snowpack are very sensitive to acidity of the “QLL” (Fig. 6). It is
25
assumed that ions are efficiently excluded on freezing, so the ratio of quasi-liquid layer ion concentration to melted snow ion concentration inversely tracks the “QLL” volume
ACPD
8, 9731–9759, 2008 1-D air-snowpack modeling of atmospheric nitrous acidWei Liao and D. Tan
Title Page Abstract Introduction Conclusions References Tables Figures ◭ ◮ ◭ ◮ Back Close
Full Screen / Esc
Printer-friendly Version Interactive Discussion
ratio. If we can apply the assumption to H+, the pH of the “QLL” is likely to be signif-icantly lower than that of the melted snow. In the other words, the volume exclusion factor can influence the pH and further determine the ion distribution. However, how the H+ concentrations change on exclusion is not entirely clear because of possible buffer species in the “QLL”. For example, the CO2 concentration at the South Pole is
5
about 374 ppmv (http://cdiac.ornl.gov/trends/co2/sio-spl.htm). [HCO−3] is inferred to be 3.6×10⁻⁵M in snow according to Henry’s Law and the acid-base kinetics of carbonate ions. The melted snow H+ concentration is 1.2×10⁻⁵M (Dibb, personal communica-tion). HCO−3 together with other ions could buffer the change of H+. HCO−3 is also an acid volatile (as are acids such as HCl) and the freezing process and
temperature-10
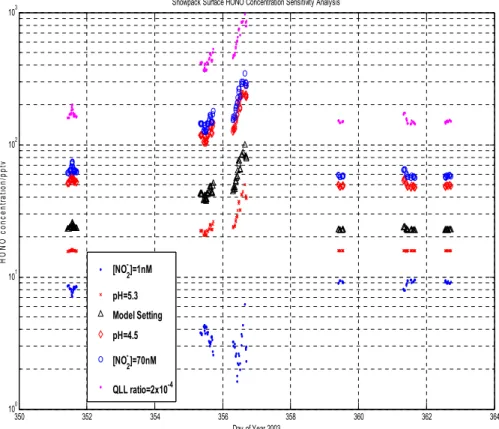
driven fluctuations in the “QLL” thickness may force acid species with significant vapor pressures into the gas phase. In the “standard case” model run, it is supposed that the “QLL” pH remain constant at 5 and the “extra” H+ is bound by other weak-acid anions or stays in the ice matrix. In contrast, NO−
2 and NO −
3 stay within the surface layer com-pletely. Figure 7 shows the sensitivity of snow surface HONO concentrations to the
15
model parameters. It is clear that the model results are quite sensitive to the volume exclusion factor and the pH and nitrite concentration in the surface layer. It also implies that the snowpack can be a HONO sink if snowpack nitrite concentrations are low.
It should also be kept in mind that the use of Henry’s Law for gas-liquid partitioning coefficients is really only relevant to ideal solutions, which under the volume
concen-20
tration effect of the “QLL” is not likely. How to correct for nonideality in the “QLL” is not clear, however, as the actual solute concentrations and the partitioning at low temper-atures is not known. Other reactions can happen, for example, NO−
2 and HONO can be oxidized by molecular oxygen to nitrate ions at a much faster rate (Takenaka et al., 1992, 1996). However, the importance of these reactions remains unexplored.
ACPD
8, 9731–9759, 2008 1-D air-snowpack modeling of atmospheric nitrous acidWei Liao and D. Tan
Title Page Abstract Introduction Conclusions References Tables Figures ◭ ◮ ◭ ◮ Back Close
Full Screen / Esc
Printer-friendly Version Interactive Discussion
3.3 Conclusion and discussion
The model presented here provides an integrated physicochemical treatment of HONO production from the snowpack. The 1-D model incorporates interstitial transport, inter-phase transfer and the main chemical sources and sinks inside the snowpack. The observed HONO emission from the snowpack is triggered mainly by the equilibrium
5
between “QLL” nitrite and firn air HONO deep below the snow surface. The high con-centration of HONO in the firn air is subsequently transported above the snowpack by diffusion and windpumping.
HONO is not the only photochemically important molecule thought to be produced from snowpack: others include NOx, formaldehyde and other light carbonyls, and
pos-10
sibly peroxides. The model can be readily extended to include these other species. There are, however, a number of issues to address in order to improve the model. The lack of many observational constraints, such as surface relief, snowpack concentration profiles, snow porosity and permeability, etc., forced many assumptions and parame-terizations. There are also many uncertainties involving the nature of the “QLL” and the
15
chemistry therein. This paper pinpoints the directions for both the observational goals of future field measurements as well as laboratory studies of real-world ices.
There are sufficient uncertainties in the model to preclude high precision in the re-sults; the hope here is to identify and to the extent possible quantify the sensitivities to the important uncertainties (Table 3). The critical sensitivities of the model involve the
20
volume exclusion factor, in particular its magnitude and dependence on temperature and solute concentration, as this determines the snow-phase chemical concentrations and, in conjunction with ion speciation, the pH. We emphasize that the assumptions that the “QLL” is a true liquid and that aqueous-phase reaction mechanisms are rel-evant require validation. Laboratory work addressing questions involving the surface
25
layer of impure ices is greatly needed at this point. Gas-liquid partitioning data for nonideal solutions at temperatures relevant to polar conditions are also required.
ACPD
8, 9731–9759, 2008 1-D air-snowpack modeling of atmospheric nitrous acidWei Liao and D. Tan
Title Page Abstract Introduction Conclusions References Tables Figures ◭ ◮ ◭ ◮ Back Close
Full Screen / Esc
Printer-friendly Version Interactive Discussion
field. For a better understanding of the role that the snowpack plays in polar and alpine photochemistry it is recommended that vertical profiles of snow permeability and porosity; actinic flux; and chemical precursor concentrations be measured in future field campaigns. Measurement of the total concentration of solvated species, ions as well as uncharged species, is important for estimating the “QLL” species concentrations.
5
Solute speciation may also be important in determining the pH of the surface layer. The vertical distribution of HONO and other species emitted to the firn air is most sensitive to windpumping. More attention should be paid in future field studies to the surface relief and its orientation with respect to wind direction.
Acknowledgements. This paper would not have been possible without the assistance of many
10
individuals. We would like to acknowledge Jack Dibb from University of New Hemisphere, who provided us with much unpublished data and constructive suggestions; Gao Chen from National Aeronautics and Space Administration (NASA), who merges the ANTCI 2003 data and provide his gas phase model results as a reference; Detlev Helmig from University of Colorado and William Neff from National Oceanic & Atmospheric Administration (NOAA), who
15
provided meteorology data and analysis; Julia Lee-Taylor and Sasha Madronich from National Center for Atmospheric Research (NCAR), who not only shared their actinic flux model codes but also took the time to explain the concept to us; Kenjiro Toyota from York University, whose AGU presentation inspired us to incorporate the windpumping model component; Tao Zeng from Georgia Institute of Technology, who patiently help us through the model building; and two
20
anonymous reviewers for their helpful comments. Funding for this project was received from the National Science Foundation award ATM 0230246.
References
Anderson, P. S. and Neff, W. D.: Boundary layer physics over snow and ice, Atmos. Chem. Phys. Discuss., 7, 7625–7677, 2007,
25
http://www.atmos-chem-phys-discuss.net/7/7625/2007/.
Bartels-Rausch, T. and Donaldson, D. J.: HONO and NO2 evolution from irradiated nitrate-doped ice and frozen nitrate solutions, Atmos. Chem. Phys. Discuss., 6, 10 713–10 731, 2006.
ACPD
8, 9731–9759, 2008 1-D air-snowpack modeling of atmospheric nitrous acidWei Liao and D. Tan
Title Page Abstract Introduction Conclusions References Tables Figures ◭ ◮ ◭ ◮ Back Close
Full Screen / Esc
Printer-friendly Version Interactive Discussion Beine, H. J., Amoroso, A., Esposito, G., Sparapani, R., Ianniello, A., Georgiadis, T., Nardino,
M., Bonasoni, P., Cristofanelli, P., and Domine, F.: Deposition of atmospheric nitrous acid on alkaline snow surfaces, Geophys. Res. Lett., 32, L10808, doi:10.1029/2005GL022589, 2005.
Boxe, C. S.: Nitrate photochemistry and interrelated chemical phenomena in ice: influence of
5
the quasi-liquid layer (QLL), Ph.D. thesis, California Institute of Technology, 2005.
Burley, J. D. and Johnston, H. S.: Ionic mechanisms for heterogeneous stratospheric reactions and ultraviolet photo absorption cross-sections for NO+2, HNO3, and NO−
3 in sulfuric-acid,
Geophys. Res. Lett., 19, 1359–1362, 1992.
Chu, L. and Anastasio, C.: Quantum yields of hydroxyl radical and nitrogen dioxide from the
10
photolysis of nitrate on ice, J. Phys. Chem. A , 107, 9594–9602, 2003.
Jones, A. E., Wolff, E. W., Ames, D., Bauguitte, S. J.-B., Clemitshaw, K. C., Fleming, Z., Mills, G. P., Saiz-Lopez, A., Salmon, R. A., Sturges, W. T., and Worton, D. R.: The multi-seasonal NOy budget in coastal Antarctica and its link with surface snow and ice core nitrate: results from the CHABLIS campaign, Atmos. Chem. Phys. Discuss., 7, 4127–4163, 2007,
15
http://www.atmos-chem-phys-discuss.net/7/4127/2007/.
Cunningham, J. and Waddington, E. D.: Air flow and dry deposition of non-sea salt sulfate in polar firn: paleoclimatic implications, Atmos. Environ., 27A, 2943–2956, 1993.
Davis, D. D., Eisele, F., Chen, G., Crawford, J., Huey, G., Tanner, D., Slusher, D., Mauldin, L., Oncley, S., Lenschow, D., Semmer, S., Shetter, R., Lefer, B., Arimoto, R., Hogan, A.,
20
Grube, P., Lazzara, M., Bandy, A., Thornton, D., Berresheim, H., Bingemer, H., Hutterli, M., McConnell, J., Bales, R., Dibb, J., Buhr, M., Park, J., McMurry, P., Swanson, A., Meinardi, S., and Blake, D.: An overview of ISCAT 2000, Atmos. Environ., 38, 5363–5373, 2004.
Dibb, J. E., Arsenault, M., Peterson, M. C., and Honrath, R. E.: Fast nitrogen oxide photochem-istry in Summit, Greenland snow, Atmos. Environ., 36, 2501–2511, 2002.
25
Dibb, J. E., Huey, L. G., Slusher, D. L., and Tanner, D. J.: Soluble reactive nitrogen oxides at South Pole during ISCAT 2000, Atmos. Environ., 38, 5399–5409, 2004.
Domine, F. and Shepson, P. B.: Air-snow interactions and atmospheric chemistry, Science, 297, 1506–1510, 2002.
Domine, F., Albert, M., Huthwelker, T., Jacobi, H.-W., Kokhanovsky, A. A., Lehning, M., Picard,
30
G., and Simpson, W. R.: Snow physics as relevant to snow photochemistry, Atmos. Chem. Phys., 8, 171–208, 2008,
ACPD
8, 9731–9759, 2008 1-D air-snowpack modeling of atmospheric nitrous acidWei Liao and D. Tan
Title Page Abstract Introduction Conclusions References Tables Figures ◭ ◮ ◭ ◮ Back Close
Full Screen / Esc
Printer-friendly Version Interactive Discussion Dubowski, Y., Colussi, A. J., and Hoffmann, M. R.: Nitrogen dioxide release in the 302 nm
band photolysis of spray-frozen aqueous nitrate solutions. Atmospheric implications, J. Phys. Chem. A, 105, 4928–4932, 2001.
Ervens, B., George, C., Williams, J. E., Buxton, G. V., Salmon, G. A., Bydder, M., Wilkinson, F., Denener, F., Mirabel, P., and Herrmann, H.: CAPRAM 2.4 (MODAC mechanism): An
5
extended and condensed tropospheric aqueous phase mechanism and its application, J. Geophys. Res., 108, 4426, doi:10.1029/2002JD002202, 2003.
Grenfell, T. C. and Perovich, D. K.: Radiation absorption coefficients of polycrystalline ice from 400 to 1400 nm, J. Geophys. Res., 86, 7447–7450, 1981.
Helmig, D., Johnson, B., Oltmans, S. J., Neff, W., Eisele, F., and Davis, D. D.: Elevated Ozone
10
in the Boundary-Layer at South Pole, Atmos. Environ., 42, 2788–2803, 2008.
Herrmann, H., Buxton, G., Salmon, A., Mirabel, P., George, C., Lelieveld, J., and Denteneer, F.: Model development for tropospheric aerosol and cloud chemistry (MODAC), Final report, No. ENV4-CT97-0388, 2000.
Honrath, R. E., Peterson, M. C., Guo, S., Dibb, J. E., Shepson, P. B., and Campbell, B.:
Evi-15
dence of NOxproduction within or upon ice particles in the Greenland snow pack, Geophys. Res. Lett., 26, 695–698, 1999.
Honrath, R. E., Peterson, M. C., Dziobak, M. P., Dibb, J. E., Arsenault, M. A., and Green, S. A.: Release of NOx from sunlight-irradiated midlatitude snow, Geophys. Res. Lett., 27, 2237–2240, 2000.
20
Honrath, R. E., Lu, Y., Peterson, M. C., Dibb, J. E., Arsenault, M. A., Cullen, N. J., and Steffen, K.: Vertical fluxes of NOx , HONO, and HNO3above the snowpack at Summit, Greenland, Atmos. Environ., 36, 2629–2640, 2002.
Hutterli, M. A., Rothlisberger, R., and Bales, R. C.: Atmosphere-to-snow-to-firn transfer studies of HCHO at Summit, Greenland, Geophys. Res. Lett., 26, 1691–1694, 1999.
25
Jacobi, H. W., Bales, R. C., Honrath, R. E., Peterson, M. C., Dibb., J. E., Swanson, A. L., and Albert., M. R.: Reactive trace gases measured in the interstitial air of surface snow at Summit, Greenland, Atmos. Environ., 38, 1687–1697, 2004.
Joseph, J. H., Wiscombe, W. J., and Weinman, J. A.: Delta-Eddington approximation for radia-tive flux-transfer, J. Atmos. Sci., 33, 2452–2459, 1976.
30
Lee-Taylor, J. and Madronich, S.: Calculation of actinic fluxes with a coupled atmosphere-snow radiative transfer model, J. Geophys. Res.-Atmos., 107, 4796, doi:10.1029/2002JD002084, 2002.
ACPD
8, 9731–9759, 2008 1-D air-snowpack modeling of atmospheric nitrous acidWei Liao and D. Tan
Title Page Abstract Introduction Conclusions References Tables Figures ◭ ◮ ◭ ◮ Back Close
Full Screen / Esc
Printer-friendly Version Interactive Discussion Li, S. M.: Equilibrium of particle nitrite with gas phase HONO: Tropospheric measurements in
the high Arctic during polar sunrise, J. Geophys. Res., 99, 25 469–25 478, 1994.
Liao, W., Case, A. T., Mastromarino, J., Tan, D., and Dibb, J. E.: Observations of HONO by laser-induced fluorescence at the South Pole during ANTCI 2003, Geophys. Res. Lett., 33, L09810, doi:10.1029/2005GL025470, 2006.
5
Madronich, S. and Flocke, S.: The role of solar radiation in atmospheric chemistry, in: Hand-book of Environmental Chemistry, edited by: Boule, P., Springer, Heidelberg, 1–26, 1998. McConnell, J. R., Bales, R. C., Stewart, R. W., Thompson., A. M., Albert, M. R., and Ramos,
R.: Physically based modeling of atmosphere-to-snow-to-firn transfer of H2O2at South Pole, J. Geophys. Res., 103(D9), 10 561–10 570, 1998.
10
Michalowski, B. A., Francisco, J. S., Li, S. M., Barrie, L. A., Bottenheim, J. W., and Shepson, P. B.: A computer model study of multiphase chemistry in the Arctic boundary layer during polar sunrise, J. Geophys. Res.-Atmos., 105, 15 131–15 145, 2000.
Neuweiler, I., Attinger, S., and Kinzelbach, W.: Macrodispersion in a radially diverging flow field with finite Peclet numbers 1. Pertubation theory approach, Water Resour. Res., 37, 481–493,
15
2001.
Perovich, D. K. and Govoni, J. W.: Absorption coefficients of ice from 250 to 400 nm, Geophys. Res. Lett., 18, 1233–1235, 1991.
Reid, R. C., Prausnitz, J. M., and Poling, B. E.: The properties of gases and liquids, McGraw-Hill, New York, 1987.
20
Sander, S. P., Friedl, R. R., Golden, D. M., Kurylo, M. J., Moortgat, G. K., Wine, P. H., Rav-ishankara, A. R., Kolb, C. E., Molina, M. J., Finlayson-Pitts, B. J., Huie, R. E., and Orkin, V. L.: Chemical Kinetics and Photochemical Data for Use in Atmospheric Studies, Eval. 15, National Aeronautics and Space Administration, Jet Propulsion Laboratory, and California Institute of Technology, Pasadena, CA, 2006.
25
Schwartz, S. E.: Mass transport considerations pertinent to aqueous phase reactions of gases in liquid water clouds, in: Chemistry of Multiphase Atmospheric Systems, edited by: Jaeschke, W., NATO ASI Series, Vol. 6, Springer, Berlin, 415–471, 1986.
Sportisse, B. and Djouad, R.: Some aspects of multi-time scale issues for the numerical mod-eling of atmospheric chemistry, Atmospheric Modmod-eling, Series: The IMA Volumes in
Mathe-30
matics and its Applications, 130, Springer, New York, 39–59, 2000.
Takenaka, N., Uede A., and Maeda., Y.: Acceleration of the rate of nitrite oxidation by freezing in aqueous solution, Nature, 358, 736–738, 1992.
ACPD
8, 9731–9759, 2008 1-D air-snowpack modeling of atmospheric nitrous acidWei Liao and D. Tan
Title Page Abstract Introduction Conclusions References Tables Figures ◭ ◮ ◭ ◮ Back Close
Full Screen / Esc
Printer-friendly Version Interactive Discussion Takenaka, N., Uede A., Daimon, T., Bandow, H., Dohmaru, T., and Maeda, Y.: Acceleration
mechanism of chemical reaction by freezing: The reaction of nitrous acid with dissolved oxygen, J. Phys. Chem., 100, 13 874–13 884,1996.
Toon, O. B., Mckay, C. P., Ackerman, T. P., and Santhanam, K.: Rapid calculation of radia-tive heating rates and photodissociation rates in inhomogeneous multiple-scattering
atmo-5
spheres, J. Geophys. Res.-Atmos., 94, 16 287–16 301, 1898.
Toyota, K. and McConnell, J. C.: One-dimensional modeling of air-snowpack interactions and bromine activation in the springtime Arctic air, oral presentation at 2005 AGU Fall Meeting, abstract #A13F-07, San Francisco, CA, USA, 5–9 December, 2005.
Waddington, E. D., Cunningham, J., and Harder, S. L.: The effects of snow ventilation on
10
chemical concentrations, in: Chemical Exchange Between the Atmosphere and Polar Snow, edited by: Wolff, E. W. and Bales, R. C., NATO ASI Series I, Global Environmental Change, Vol. 43, Springer Verlag, Berlin, 403–451, 1996.
Waldner, P. A., Schneebeli., M., Schultze-Zimmermann, U., and Fluhler, H.: Effect of snow structure on water flow and solute transport, Hydrol. Process., 18, 1271–1290, 2004.
15
Warneck, P. and Wurzinger, C.: Product quantum yields for the 305-nm photodecomposition of NO−
3 in aqueous-solution, J. Phys. Chem., 92, 6278–6283, 1998.
Warren, S. G., Brandt, R. E., and Hinton, R. O’. R: Effect of surface roughness on bidirectional reflectance of Antarctic snow, J. Geophys. Res., 103, 25 789–25 807, 1998.
Yang, J., Honrath, R. E., Peterson, M. C., Dibb, J. E., Sumner, A. L., Shepson, P. B., Frey, M.,
20
Jacobi, H.-W., Swanson, A., and Blake, N.: Impact of snow pack photochemistry on HOx levels at Summit, Greenland, Atmos. Environ., 36, 2523–2534, 2002.
Zellner, R., Exner, M., and Herrmann, H.: Absolute OH quantum yields in the laser photolysis of nitrate, nitrite and dissolved H2O2at 308 and 351 nm in the temperature-range 278–353 K, J. Atmos. Chem., 10, 411–425, 1990.
25
Zhou, X., Beine, H. J., Honrath, R. E., Fuentes, J. D., Simpson, W., Shepson, P. B., and Bottenheim, J. W.: Snow pack photochemical production of HONO: A major source of OH in the Arctic boundary layer in springtime, Geophys. Res. Lett., 28, 4087–4090, 2001.
ACPD
8, 9731–9759, 2008 1-D air-snowpack modeling of atmospheric nitrous acidWei Liao and D. Tan
Title Page Abstract Introduction Conclusions References Tables Figures ◭ ◮ ◭ ◮ Back Close
Full Screen / Esc
Printer-friendly Version Interactive Discussion
Table 1. Summary of measured HONO at Polar Regions.
Time and Place HONO(pptv) Height Reference
2–4 July 1999 Summit 10 75 cm Dibb et al. (2002)
27–28 June 2000 Summit 15 2 m Honrath et al. (2002)
April 1992 Alert 5–10 5 m Li Shao-Meng (1994)
April 2000 noon Alert 10 5 m Zhou et al. (2001)
27 December 2000 South Pole 25 10 m Dibb et al. (2004)
27 December 2000 South Pole 5–71, average 30, median 33 85 cm Dibb et al. (2004) December 2003 South Pole median 7.2±2.3 10 m Liao et al. (2006)
ACPD
8, 9731–9759, 2008 1-D air-snowpack modeling of atmospheric nitrous acidWei Liao and D. Tan
Title Page Abstract Introduction Conclusions References Tables Figures ◭ ◮ ◭ ◮ Back Close
Full Screen / Esc
Printer-friendly Version Interactive Discussion
Table 2. Dimensions of typical of summertime sastrugi at South Pole.
Feature Height, m Length, m Width, m Weighting Function, %
1 0.25 15.0 4.0 0.9 2 0.20 5.4 1.8 5.3 3 0.10 8.0 1.2 5.4 4 0.25 4.0 2.0 6.5 5 0.23 2.2 1.3 18.1 6 0.09 1.1 0.9 52.4 7 0.24 6.5 0.7 11.4
ACPD
8, 9731–9759, 2008 1-D air-snowpack modeling of atmospheric nitrous acidWei Liao and D. Tan
Title Page Abstract Introduction Conclusions References Tables Figures ◭ ◮ ◭ ◮ Back Close
Full Screen / Esc
Printer-friendly Version Interactive Discussion
Table 3. Sensitivity analysis of HONO concentration deep below snow surface where the
equi-librium between QLL HONO and interstitial air HONO is reached. The pH and [NO−
2] are
mea-sured melted snow minimum, median, and maximum concentrations from 1 to 18 December 2003 (Jack Dibb, personal communication). The bold numbers are the parameters used in the model.
QLL to snow volume ratio = 2×10⁻³
QLL to snow volume ratio = 2×10⁻⁴
HONO (pptv) pH HONO (pptv) pH 5.3 5 4.5 5.3 5 4.5 1 4 8 24 1 42 82 235 [NO− 2] (10 −9M) 20 84 164 470 [NO− 2] (10 −9M) 20 844 1644 4704 70 296 575 1646 70 2955 5753 16463
ACPD
8, 9731–9759, 2008 1-D air-snowpack modeling of atmospheric nitrous acidWei Liao and D. Tan
Title Page Abstract Introduction Conclusions References Tables Figures ◭ ◮ ◭ ◮ Back Close
Full Screen / Esc
Printer-friendly Version Interactive Discussion 351.5 351.6 351.7 -0.25 -0.2 -0.15 -0.1 -0.05 S n o w p a c k D e p th /m 355.4 355.5 355.6 355.7 356.4 356.5 356.6 Day of Year (2003) Windpumping Speed/m s-1 359.5 361.4 361.5 361.6 362.6 362.7 0.5 1 1.5 2 2.5 3 x 10⁻³
Fig. 1. Simulation of windpumping speed from 0 m to 0.3 m below snow on 17, 21, 22, 25, 27
ACPD
8, 9731–9759, 2008 1-D air-snowpack modeling of atmospheric nitrous acidWei Liao and D. Tan
Title Page Abstract Introduction Conclusions References Tables Figures ◭ ◮ ◭ ◮ Back Close
Full Screen / Esc
Printer-friendly Version Interactive Discussion -0.5 0 0.5 1 1.5 2 2.5 3 x 10⁻³ 0 0.5 1 1.5 v/m s-1 D e p th /m
Vertical windpumping speed vs depth
h=0.25m;λ=15m;α=0.27 h=0.2m;λ=5.4m;α=0.33 h=0.1m;λ=8m;α=0.15 h=0.25m;λ=4m;α=0.5 h=0.23m;λ=2.2m;α=0.59 h=0.09m;λ=1.1m;α=0.82 h=0.24m;λ=6.5m;α=0.11 mean
Figure 2 Simulation of wind pumping speed based on different dimensions of Fig. 2. Simulation of wind pumping speed based on different dimensions of summertime
sas-trugi at South Pole. The surface wind speed is 5.1 m/s. The smaller surface features generate stronger flows. The e folding depth for the mean speed is 10 cm.
ACPD
8, 9731–9759, 2008 1-D air-snowpack modeling of atmospheric nitrous acidWei Liao and D. Tan
Title Page Abstract Introduction Conclusions References Tables Figures ◭ ◮ ◭ ◮ Back Close
Full Screen / Esc
Printer-friendly Version Interactive Discussion 0.5 0.5 0.5 0.5 1 1 1 1 1.5 1.5 1.5 2 2 2 2.5 2.5 2.5 3 3 3 3.5 3.5 4 4 4.55
Total actinic flux/W m−2 nm−1
Wavelength (nm) Snowdepth (m) 350 400 450 500 550 600 650 0.05 0.1 0.15 0.2 0.25 0.3 0.35 0.4 0.45 σ ρ θ
Fig. 3. Simulation of actinic flux with snow depth and wavelength. Conditions are:
mass-specific scattering coefficientσscatt=22.5 m2kg−1, snow densityρ=0.3 g cm−3, solar zenith
an-gleθ=68◦
ACPD
8, 9731–9759, 2008 1-D air-snowpack modeling of atmospheric nitrous acidWei Liao and D. Tan
Title Page Abstract Introduction Conclusions References Tables Figures ◭ ◮ ◭ ◮ Back Close
Full Screen / Esc
Printer-friendly Version Interactive Discussion 351.5 351.6 351.7 -0.25 -0.2 -0.15 -0.1 -0.05 0 S n o w p a c k D e p th (m ) 355.4 355.5 355.6 355.7 356.4 356.5 356.6 [HONO] Vertical Distribution
Day of Year (2003) 359.5 361.4 361.5 361.6 362.6 362.7 20 40 60 80 100 120 140 160
Fig. 4. Simulation of vertical profile of interstitial air HONO mixing ratio (pptv) inside the
ACPD
8, 9731–9759, 2008 1-D air-snowpack modeling of atmospheric nitrous acidWei Liao and D. Tan
Title Page Abstract Introduction Conclusions References Tables Figures ◭ ◮ ◭ ◮ Back Close
Full Screen / Esc
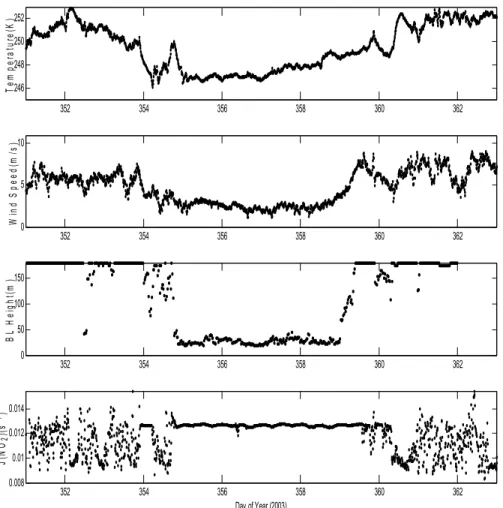
Printer-friendly Version Interactive Discussion 352 354 356 358 360 362 246 248 250 252 T e m p e ra tu re (K ) 352 354 356 358 360 362 0 5 10 W in d S p e e d (m /s ) 352 354 356 358 360 362 0 50 100 150 B L H e ig h t( m ) 352 354 356 358 360 362 0.008 0.01 0.012 0.014 J( N O2 )( s -1) Day of Year (2003)
Fig. 5. Temperature, wind speed, boundary layer height and J(NO2) from 17 to 28 December. They have the similar pattern in the sense that they decrease from 21 to 25 December when the mean boundary layer height is 26.7 m.
ACPD
8, 9731–9759, 2008 1-D air-snowpack modeling of atmospheric nitrous acidWei Liao and D. Tan
Title Page Abstract Introduction Conclusions References Tables Figures ◭ ◮ ◭ ◮ Back Close
Full Screen / Esc
Printer-friendly Version Interactive Discussion 0 1 2 3 4 5 6 0 0.1 0.2 0.3 0.4 0.5 0.6 0.7 0.8 0.9 1 pH Mole fraction H2ONO+ HONO NO 2 −
ACPD
8, 9731–9759, 2008 1-D air-snowpack modeling of atmospheric nitrous acidWei Liao and D. Tan
Title Page Abstract Introduction Conclusions References Tables Figures ◭ ◮ ◭ ◮ Back Close
Full Screen / Esc
Printer-friendly Version Interactive Discussion 350 352 354 356 358 360 362 364 100 101 102 103 Day of Year 2003 H O N O c o n c e n tr a ti o n /p p tv
Snowpack Surface HONO Concentration Sensitivity Analysis
[NO 2 -]=1nM pH=5.3 Model Setting pH=4.5 [NO 2 -]=70nM QLL ratio=2x10⁻⁴