HAL Id: hal-00298704
https://hal.archives-ouvertes.fr/hal-00298704
Submitted on 7 Jun 2006HAL is a multi-disciplinary open access
archive for the deposit and dissemination of sci-entific research documents, whether they are pub-lished or not. The documents may come from teaching and research institutions in France or abroad, or from public or private research centers.
L’archive ouverte pluridisciplinaire HAL, est destinée au dépôt et à la diffusion de documents scientifiques de niveau recherche, publiés ou non, émanant des établissements d’enseignement et de recherche français ou étrangers, des laboratoires publics ou privés.
Technical Note: Real-time updating procedure for flood
forecasting with conceptual HBV-type models
Th. Wöhling, F. Lennartz, M. Zappa
To cite this version:
Th. Wöhling, F. Lennartz, M. Zappa. Technical Note: Real-time updating procedure for flood forecasting with conceptual HBV-type models. Hydrology and Earth System Sciences Discussions, European Geosciences Union, 2006, 3 (3), pp.925-940. �hal-00298704�
HESSD
3, 925–940, 2006 Updating procedure Th. W ¨ohling et al. Title Page Abstract Introduction Conclusions References Tables Figures J I J I Back CloseFull Screen / Esc
Printer-friendly Version Interactive Discussion
EGU Hydrol. Earth Syst. Sci. Discuss., 3, 925–940, 2006
www.hydrol-earth-syst-sci-discuss.net/3/925/2006/ © Author(s) 2006. This work is licensed
under a Creative Commons License.
Hydrology and Earth System Sciences Discussions
Papers published in Hydrology and Earth System Sciences Discussions are under open-access review for the journal Hydrology and Earth System Sciences
Technical Note: Real-time updating
procedure for flood forecasting with
conceptual HBV-type models
Th. W ¨ohling1, F. Lennartz2, and M. Zappa3
1
Lincoln Environmental Research, Ruakura Research Centre, Private Bag 3062, Hamilton, New Zealand
2
Dresden University of Technology, W ¨urzburger Str. 46, 01187 Dresden, Germany
3
Swiss Federal Institute for Forest, Snow and Landscape Research (WSL), Z ¨urcherstrasse 111, CH-8903 Birmensdorf, Switzerland
Received: 27 January 2006 – Accepted: 21 February 2006 – Published: 7 June 2006 Correspondence to: Th. W ¨ohling ([email protected])
HESSD
3, 925–940, 2006 Updating procedure Th. W ¨ohling et al. Title Page Abstract Introduction Conclusions References Tables Figures J I J I Back CloseFull Screen / Esc
Printer-friendly Version Interactive Discussion
EGU
Abstract
Flood forecasting is of increasing importance as it comes to an increasing variability in global and local climates. But rainfall-runoff models are far from being perfect. In order to achieve a better prediction for emerging flood events, the model outputs have to be continuously updated. This contribution introduces a rather simple, yet effective up-5
dating procedure for the conceptual distributed rainfall-runoff model PREVAH, whose runoff generation module relies on similar algorithms as the HBV-Model. The current conditions of the system, i.e. the contents of the upper soil reservoirs, are updated by the proposed method. The testing of the updating procedure on data from two moun-tainous catchments in Switzerland reveals a significant increase in prediction accuracy 10
with regards to peak flow.
1 Introduction
Flood forecasting has been a key issue in hydrology during the past and gains even more importance due to the current development of increasing climate variability. This issue still remains an unsolved problem in operational hydrology (Garrote and Bras, 15
1995). A great number of conceptual rainfall-runoff models have been developed but the accuracy of predicted runoff is often low. Therefore, the current model output is continuously updated to represent the current situation in the catchment.
Various updating procedures have been published (O’Connell and Clarke, 1981; WMO, 1992; Refsgaard, 1997) which are, however, mostly not suitable for short fore-20
cast periods and a steep flood hydrograph characteristic which is typical for small, quick reacting mountainous catchments. In such catchments it is the primary goal to extend the forecast lead time. This requires procedures that update the state variables that govern the runoff generation process of the used rainfall runoff model. Classical up-dating procedures – e.g. Auto Regression Moving Average approaches (Lettenmaier, 25
HESSD
3, 925–940, 2006 Updating procedure Th. W ¨ohling et al. Title Page Abstract Introduction Conclusions References Tables Figures J I J I Back CloseFull Screen / Esc
Printer-friendly Version Interactive Discussion
EGU significant loss of forecast lead time in small, quick reacting catchments. More
sophis-ticated procedures which, for example, are using Kalman filtering (Kalman, 1960) are mathematically too complex to be easily accommodated by the highly non-linear mod-els (Yang and Michelle, 2001). Therefore, we intended to develop a simple but effective updating procedure that allows for the updating of sensitive state variables that control 5
the runoff generation approach of HBV-type conceptual rainfall runoff models.
2 Methods
The proposed updating method is a tailor-made algorithm for the spatially distributed
Precipitation-Runoff-Evapotranspiration-HRU Model PREVAH (Gurtz et al., 1999). The
spatial discretization of PREVAH relies on the aggregation of gridded physiogeograph-10
ical information (gridded maps of elevation, land use, land cover and soil properties) into hydrologic response units HRUs. HRUs are clusters representing areas of the basin where similar hydrological behaviour is expected (Zappa, 2003). Hydrological similarity has been identified according to the elevation, land use, exposition and soil depth of the grid cells (Gurtz et al., 1999). Hydrological similarity in glaciated parts 15
of the basins is accounted by defining the glacier equilibrium line altitude (Klok et al., 2001). The module for soil water storage and depletion by evapotranspiration relies on the HBV-model and the Penman-Monteith equation (see details in Gurtz et al., 1999, and Zappa and Gurtz, 2003). Snow and glacier melt are calculated using a modified temperature-index approach, including potential direct clear sky solar radiation (Hock, 20
1999; Zappa et al., 2003). The runoff generation module uses concepts from the well established HBV-model (Bergstr ¨om, 1976; Lindstr ¨om et al., 1997), adapted to a spa-tially distributed application (Gurtz et al., 2003). A previous study by Zappa (2003) revealed that the upper runoff storage SUZ is the most sensitive state variable with re-gards to calculated peak runoff. Therefore SUZ is updated in the proposed procedure. 25
In this study we apply PREVAH to two Swiss basins: Verzasca (186 km2) and Linth (600 km2). The Vezasca basin is located in the southern part of Switzerland and poorly
HESSD
3, 925–940, 2006 Updating procedure Th. W ¨ohling et al. Title Page Abstract Introduction Conclusions References Tables Figures J I J I Back CloseFull Screen / Esc
Printer-friendly Version Interactive Discussion
EGU affected by human activities. Its elevation range is 490–2870 m a.s.l. Forests (30%),
shrub (25%), rocks (20%) and alpine pastures (20%) are the predominant land cover classes. Soils are rather shallow (generally <30 cm) and the plant available filed ca-pacity is below 5% volume. The discharge regime is governed by snowmelt in spring and early summer and by heavy rainfall events in fall.
5
The Linth basin is located in central Switzerland. The discharge regime up to the gauge in Mollis is heavily affected by hydropower. Water stored in two big reservoirs during spring and summer is released for production of peak electricity. Thus we can observe a distinct daily and weekly cycle in the hydrograph. The basin shows a range of elevation between 435 and 3610 m a.s.l. 20% of the basin are covered by forests. 10
The portion of rocks and bare soil areas is 34%. Large parts of the watershed are used for pasture (31%). In the highest regions there are some small glaciers which make about 4% of the total basin area. The soils are well developed in the valley (with depths >1.5 m and large plant available field capacity). In contrast, the surrounding hills are characterized by shallow soils and a reduced plant available field capacity.
15
PREVAH’s calibration procedure relies on the monitored maximisation of an accept-ability score based on nine different objective functions derived by the comparison be-tween the observed and the simulated hourly discharge (Sonderegger, 2004; Verbunt et al., 2006). The functions test the overall agreement between observation and sim-ulation and combine equations from Nash and Sutcliffe (1970), Legates and McCabe 20
(1999) and Zappa et al. (2003). Table 1 reports the results of the model calibration and verification for both basins. The hydropower management in the Linth basins is partly responsible for the obtained low values for the Nash and Sutcliffe efficiency.
3 Updating procedure
Model predictions of runoff from a catchment (Qs) often differ from the observations 25
(Qm). A simple but effective method is introduced to adapt the model state to the ob-servations from the natural system: If the difference between the simulated (PREVAH)
HESSD
3, 925–940, 2006 Updating procedure Th. W ¨ohling et al. Title Page Abstract Introduction Conclusions References Tables Figures J I J I Back CloseFull Screen / Esc
Printer-friendly Version Interactive Discussion
EGU runoff and the measured runoff, ∆Q=Qs−Qm, exceeds a certain tolerance threshold
ε, the content of the upper soil reservoir SUZ is updated by a factor F. An iterative
solution is required to determine the value ofF for the minimization of∆Q.
3.1 Solution strategy
The spatial discretization of PREVAH relies on the concept of hydrological response 5
units (Gurtz et al., 1999). The current state of the variables is calculated for each HRU in the catchment. But spatially information of the current state of the catchment are usually not available. Therefore the state variable SUZ is updated for all HRUs in equal measure.
The updating algorithm is designed for hourly time steps. Model calculations are 10
conducted sequentially for all 24 h of a simulation day within one HRU in the catchment and then sequentially for all HRUs of the catchment. Total hourly flow components and the state of the entire watershed are calculated by superposition of the flow from the individual HRUs at the end of the simulation day (Zappa, 2003). Hence, the loop structure of the PREVAH model core can be written as:
15
[Years[Months[Days[HRUs[Hours]]]]]
Due to this structure, a stepwise simultaneous assessment (updating) of hourly state variables of the catchment (e.g. soil moisture storage, snow water equivalent, intercep-tion storage, groundwater storage) is not possible. Currently, the state of the entire catchment is only accessible at daily intervals. But these are far too much for flood 20
forecasting in small, flash flood exposed catchments. The way out of the dilemma is to use a vector of updating factors F(i=1...24), where i denotes the count of the
hours of a simulation day. At the beginning of each day, an initial run without updat-ing (F[1...24]=1) is conducted. The model results are evaluated at daily intervals. If
∆Q(i=1) exceeds the tolerance criterion ε, the factor F(i=1) is calculated by Eq. (1) 25
and the calculations of the day are repeated (Fig. 1). Now the state of SUZ is multi-plied byF(1) at the time t=1 h within the loop of the HRUs. The calculations proceed
HESSD
3, 925–940, 2006 Updating procedure Th. W ¨ohling et al. Title Page Abstract Introduction Conclusions References Tables Figures J I J I Back CloseFull Screen / Esc
Printer-friendly Version Interactive Discussion
EGU as by the original PREVAH code for all coming hours of the simulation day. At the
end of the day,∆Q(i=1) is evaluated again. The procedure is repeated until ∆Q(i)<ε. Then calculations proceed to the next hour where this condition fails. TheF(i )-values
of preceding time steps are stored until the simulation of the day is completed (i=24). Then the calculations proceed to the next simulation day (Fig. 1).
5
We applied the secant method for determining iteratively the factorF(i ):
F(i )j+1= F(i)j −hQsj(i ) − Qm(i )i· h F(i )j − F(i)j−1i h Qjs(i ) − Qm(i )i·hQsj−1(i ) − Qm(i )i (1)
where, i=[1...24] is the count of hours during a simulation day, j=[1...12] is the iteration count of the updating loop. Convergence is usually achieved quickly within 3 or 4 iterations.
10
For certain (theoretical) model states, the updating of SUZ may not succeed to mini-mize the objective function by the required precision criteria. For example: if simulated runoff is over-predicted and SUZ is already empty, the content of this reservoir can not be further reduced. The best solution achieved by a maximum of 12 iterations is used in such a case and the updating proceeds to the next time step. As a side effect, this 15
approach, therefore, also damps the effect of measurement errors (extreme values). The date and hour of a proposed updating are user defined by the help of a control file which contains a record of the date and hour, the observed discharge and the control integer U which indicates either updating (U=1) or no updating (U=0). The precision criteria ε is also user defined. It is the second constraint for updating: model 20
calculations proceed without updating if U (i )=1 but ∆Q(i)≥ε applies.
4 Results and discussion
We tested the updating procedure on two well observed mountainous catchments in Switzerland. Model parameterization, calibration and verification following the
proce-HESSD
3, 925–940, 2006 Updating procedure Th. W ¨ohling et al. Title Page Abstract Introduction Conclusions References Tables Figures J I J I Back CloseFull Screen / Esc
Printer-friendly Version Interactive Discussion
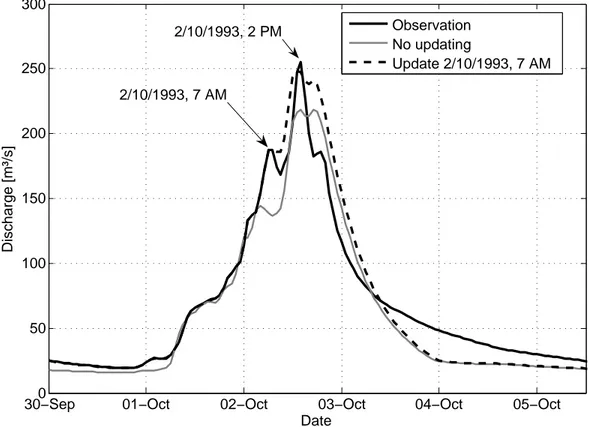
EGU dure presented in Zappa et al. (2003). Figure 2 shows the analysis of the 1993 flood
for the 186 km2 Verzasca catchment. The simulation of the event at 2 October 1993, with peak flow at 02:00 p.m. is updated by the proposed procedure (U=1) up to the time at 2 October 1993, 07:00 a.m. After that time, PREVAH predicts the discharge (U=0). The updating precision criterion was set to 5 percent (ε=0.05). The prediction 5
of the peak flow by the updated simulation run is much better (95.3% of peak flow) as compared to the peak flow prediction by the calibrated run (84.3% of peak flow).
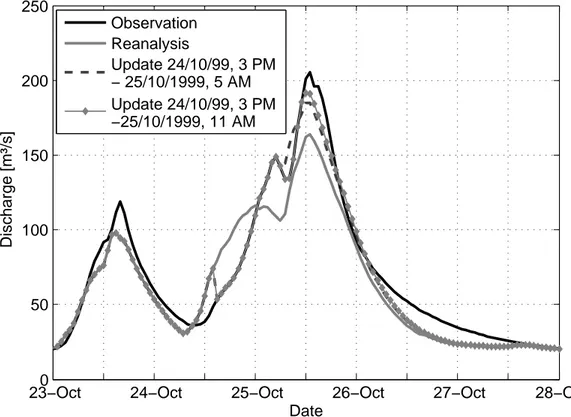
In a similar event in October 1999 (Fig. 3) the calibrated model run provides a rather large overestimation of discharge the day before the flood peak, while the peak itself is underestimated (79.8% of peak flow). By updating the model up to 6 h before the peak, 10
an improvement is obtained (simulated peak 89.8% of observed peak flow). By con-tinuing the update up to 2 h before the event a further small improvement is achieved (93.1% of peak flow).
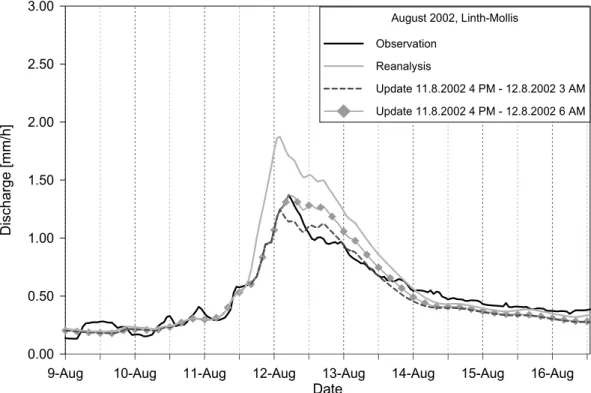
Figure 4 shows the reanalysis of the 2002 flood for the 600 km2Linth basin (gauge Mollis) in the county of Glarus. The natural discharge in this basin is rather perturbed 15
by hydropower management. PREVAH has been applied in reanalysis mode for the hindcast of this event, where the reservoir retained a large amount of water. The application of the calibrated model shows a large overestimation of the flood peak. If the updating is applied up to three hours before the peak at 12 August 2002, 06:00 a.m., then the actual peak is slightly underestimated. After the peak the hindcast simulation 20
agrees well with the observation. If the updating procedure is adopted up to the time of peak flow), then a slight overestimation is observed for the 48 h following the event.
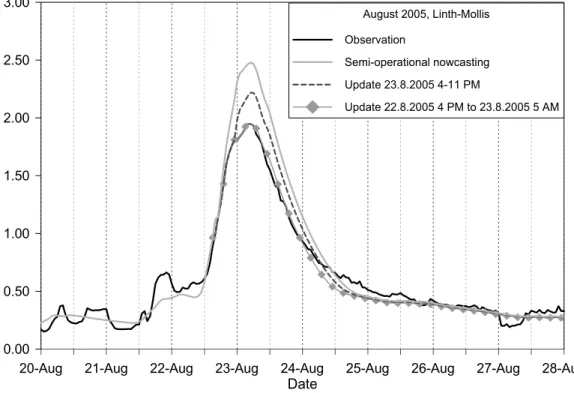
Figure 5 shows a first semi-operational application of the updating procedure. PRE-VAH is implemented since July 2005 for runoff-nowcasting for the Linth basin. In August 2005 a severe flood event occurred in Switzerland. In the Linth basin the river reached 25
a peak discharge of 1.95 mm per hour at 05:00 of 23 August. Since the operating companies do no provide so far real-time data on the water storage and release, the hydrological model, as currently implemented for discharge nowcasting, fails to esti-mate the discharge peak. Approxiesti-mately 20% of peak flow was cut-off through water
HESSD
3, 925–940, 2006 Updating procedure Th. W ¨ohling et al. Title Page Abstract Introduction Conclusions References Tables Figures J I J I Back CloseFull Screen / Esc
Printer-friendly Version Interactive Discussion
EGU storage within reservoirs.
In the event analysis we applied the updating routine as soon as the flow exceeds 1 mm per hour in the ascending phase of the flood peak. If we adopt the updating procedure up to 6 h before the peak, the error in peak estimation is reduced by 50%. If the procedure is adopted until the time of peak flow, then very good conditions for the 5
following hours, when the water level sinks, are obtained.
In such a case the updating procedure provide less support for improvement in flood control, but demonstrates its capability of improving the initial conditions of the model at every desired time step during a flood event. This capability of the procedure will find its best application once the simulations will be coupled with operational forecasts 10
from numerical weather models.
This short technical note provides an effort towards reducing uncertainty in initial conditions for operational discharge simulation with hydrological models relying on HBV-type runoff generation module (Lindst¨om et al., 1997; Zhang and Lindstr¨om, 1997; Uhlenbrook and Leibundgut, 2002; Gurtz et al., 1999). The procedure is particularly 15
efficient if the model underestimate runoff generation at the beginning of a flood event. In operational use we suggest to adopt the procedure automatically at every time step as soon as the observed discharge exceeds a basin specific critical level, in order to provide valid starting values for extrapolation for the next hours by mean precipitation and temperature forecasts.
20
Acknowledgements. The work of Th. W ¨ohling and F. Lennartz on the updating procedure was
sponsored by the European Community whereas the work of M. Zappa on runoff nowcasting within the Linth basin has been financed by the Prevention Foundation of the Cantonal Public Building Insurance Companies (Switzerland).
References
25
Bergstr ¨om, S.: Development and Application of a Conceptual Runoff Model for Scandinavian Catchments, Bulletin Series A, No. 52, University of Lund, 1976.
HESSD
3, 925–940, 2006 Updating procedure Th. W ¨ohling et al. Title Page Abstract Introduction Conclusions References Tables Figures J I J I Back CloseFull Screen / Esc
Printer-friendly Version Interactive Discussion
EGU
Dyck, S. and Peschke, G.: Grundlagen der Hydrologie, (in German), 3rd Ed., Verlag fuer Bauwesen, Berlin, Germany, ISBN: 3345005867, 1995.
Garrote, I. and Bras, R. J.: A distributed model for real-time flood forcasting using digital eleva-tion models, J. Hydrol., 167, 279–306, 1995.
Gurtz, J., Baltensweiler, A., and Lang, H.: Spatially distributed hydrotope-based modelling
5
of evapotranspiration and runoff in mountainous basins, Hydrol. Process., 13, 2751–2768, 1999.
Gurtz, J., Zappa, M., Jasper, K., Lang, H., Verbunt, M., Badoux, A., and Vitvar, T.: A compar-ative study in modelling runoff and its components in two mountainous catchments, Hydrol. Process., 17, 297–311, 2003.
10
Hock, R. : Distributed temperature-index ice- and snowmelt model including potential direct solar radiation, J. Glaciol., 45, 101–111, 1999.
Kalman, R. E.: A new approach to linear filtering and prediction problems, Journal of Basic Engineering, 82 (Series D), ISSN 0021-9223, pp. 35–45, 1960.
Klok, E. J., Jasper, K., Roelofsma, K. P., Badoux, A., and Gurtz, J.: Distributed hydrological
15
modelling of a glaciated Alpine river basin, Hydrol. Sci. J., 46, 553–570, 2001.
Legates, D. R. and McCabe, G. J.: Evaluating the use of “Goodness-of-Fit” measures in hydro-logic and hydroclimatic model validation, Water Resour. Res., 35, 233–241, 1999.
Lettenmaier, D. P. and Wood, E. F.: Hydrologic Forecasting, Chapter 26 in: Handbook of Hy-drology, edited by: Maidment, D. R., McGraw-Hill, New York, USA, 1993.
20
Lindstr ¨om, G., Johansson, B., Persson, M., Gardelin, M., and Bergstr ¨om, S.: Development and test of the distributed HBV-96 hydrological model, J. Hydrol., 201, 272–288, 1997.
Nash, J. E. and Sutcliffe, J. V.: River flow forecasting through conceptual models (1), a discus-sion of principles, J. Hydrol., 10, 282–290, 1970.
O’Connell, P. E. and Clarke, R. T.: Adaptive hydrological forecasting – a review, Hydrological
25
Scienes Bulletin, 26 (2), ISSN 0303-6936 pp. 179–205, 1981.
Refsgaard, J. C.: Validation and Intercomparison of Different Updating Procedures for Real-Time Forecasting, Nordic Hydrology, 28, ISSN 0029-1277, pp. 65–84, 1997.
Sonderegger C.: Rainfall/Runoff Modelling of a Sub-Satchment of the Yangtze in China, Diploma Thesis at the ETH and University Z ¨urich; 103 p., 2004.
30
Uhlenbrook, S. and Leibundgut, C.: Process-oriented catchment modelling and multiple-response validation, Hydrol. Process., 16, 423–440, 2002.
HESSD
3, 925–940, 2006 Updating procedure Th. W ¨ohling et al. Title Page Abstract Introduction Conclusions References Tables Figures J I J I Back CloseFull Screen / Esc
Printer-friendly Version Interactive Discussion
EGU
Approach for Different Catchments in Upper Rhine Basin, J. Hydrol., NNN, in press, doi:10.1016/j.jhydrol.2005.09.036, 2006.
WMO: Simulated real-time intercomparison of hydrological models, No. 779, World Meteoro-logical Organization, ISBN: 92-63-10779-3, 1992.
Yang, X. and Michelle, C.: Flood forecasting with a watershed model: a new method of
param-5
eter updating, Hydrol. Sci., 45(4), 537–547, 2001.
Zappa, M.: Multiple-response verification of a distributed hydrological model at different spatial scales In Institute for Atmospheric and Climate Science, Dissertation No. 14895, ETH Z ¨urich, 2003.
Zappa, M. and Gurtz, J.: Simulation of soil moisture and evapotranspiration in a soil profile
10
during the 1999 MAP-Riviera Campaign, Hydrol. Earth Syst. Sci., 7, 903–919, 2003. Zappa, M., Pos, F., Strasser, U., Warmerdam, P., and Gurtz, J.: Seasonal water balance of
an Alpine catchment as evaluated by different methods for spatially distributed snowmelt modelling, Nordic Hydrology, 34, 179–202, 2003.
Zhang, X. N. and Lindstrom, G.: Development of an automatic calibration scheme for the HBV
15
HESSD
3, 925–940, 2006 Updating procedure Th. W ¨ohling et al. Title Page Abstract Introduction Conclusions References Tables Figures J I J I Back CloseFull Screen / Esc
Printer-friendly Version Interactive Discussion
EGU
Table 1. Model calibration and verification. NSE is the agreement after Nash and Sutcliffe
(1970). LOG(NSE) is the logarithmic formulation of NSE (Zappa et al., 2003). VOL is error in discharge volumes between simulation and observation.
Basin Run Period NSE LOG(NSE) VOL1 EVENTS2 Verzasca Calibration 1991–1996 0.826 0.875 0.3 14 Verzasca Verification 1997–2004 0.829 0.895 –0.6% 14 Linth Calibration 1991–1995 0.655 0.640 –1.6% 8 Linth Verification 1996–2003 0.654 0.629 –3.1% 18
1
Values below 0 indicate that the model underestimate the observed discharge.
2
For each basin the total of events is equal to the double of the considered years: the top 28 events between 1991 and 2004 for the Verzasca basins and the top 26 events between 1991 and 2003 for the Linth basin. Two events are considered as independent if there are more than 72 h between the peaks.
HESSD
3, 925–940, 2006 Updating procedure Th. W ¨ohling et al. Title Page Abstract Introduction Conclusions References Tables Figures J I J I Back CloseFull Screen / Esc
Printer-friendly Version Interactive Discussion
EGU
HESSD
3, 925–940, 2006 Updating procedure Th. W ¨ohling et al. Title Page Abstract Introduction Conclusions References Tables Figures J I J I Back CloseFull Screen / Esc
Printer-friendly Version Interactive Discussion
EGU 30−Sep0 01−Oct 02−Oct 03−Oct 04−Oct 05−Oct
50 100 150 200 250 300 Date Discharge [m³/s] Observation No updating Update 2/10/1993, 7 AM 2/10/1993, 7 AM 2/10/1993, 2 PM
Fig. 2. Comparison of measured and simulated discharge (Verzasca catchment): 1) the
HESSD
3, 925–940, 2006 Updating procedure Th. W ¨ohling et al. Title Page Abstract Introduction Conclusions References Tables Figures J I J I Back CloseFull Screen / Esc
Printer-friendly Version Interactive Discussion
EGU
23−Oct0 24−Oct 25−Oct 26−Oct 27−Oct 28−Oct
50 100 150 200 250 Date Discharge [m³/s] Observation Reanalysis Update 24/10/99, 3 PM − 25/10/1999, 5 AM Update 24/10/99, 3 PM −25/10/1999, 11 AM
Fig. 3. Comparison of measured discharge and discharge reanalysis with PREVAH for the
HESSD
3, 925–940, 2006 Updating procedure Th. W ¨ohling et al. Title Page Abstract Introduction Conclusions References Tables Figures J I J I Back CloseFull Screen / Esc
Printer-friendly Version Interactive Discussion
EGU
9-Aug 10-Aug 11-Aug 12-Aug 13-Aug 14-Aug 15-Aug 16-Aug
Date 0.00 0.50 1.00 1.50 2.00 2.50 3.00 Disch arge [mm/h] August 2002, Linth-Mollis Observation Reanalysis Update 11.8.2002 4 PM - 12.8.2002 3 AM Update 11.8.2002 4 PM - 12.8.2002 6 AM
Figure 4: Comparison of measured discharge and discharge nowcasting with PREVAH for the perturbed Linth basin.
Fig. 4. Comparison of measured discharge and discharge nowcasting with PREVAH for the
HESSD
3, 925–940, 2006 Updating procedure Th. W ¨ohling et al. Title Page Abstract Introduction Conclusions References Tables Figures J I J I Back CloseFull Screen / Esc
Printer-friendly Version Interactive Discussion
EGU
20-Aug 21-Aug 22-Aug 23-Aug 24-Aug 25-Aug 26-Aug 27-Aug 28-Aug
Date 0.00 0.50 1.00 1.50 2.00 2.50 3.00 Dischar ge [mm/h] August 2005, Linth-Mollis Observation Semi-operational nowcasting Update 23.8.2005 4-11 PM Update 22.8.2005 4 PM to 23.8.2005 5 AM
Figure 5: Comparison of measured discharge and discharge reanalysis with PREVAH for the perturbed Linth basin.
Fig. 5. Comparison of measured discharge and discharge reanalysis with PREVAH for the