HAL Id: hal-00474342
https://hal.archives-ouvertes.fr/hal-00474342
Submitted on 19 Apr 2010
HAL is a multi-disciplinary open access
archive for the deposit and dissemination of sci-entific research documents, whether they are pub-lished or not. The documents may come from teaching and research institutions in France or abroad, or from public or private research centers.
L’archive ouverte pluridisciplinaire HAL, est destinée au dépôt et à la diffusion de documents scientifiques de niveau recherche, publiés ou non, émanant des établissements d’enseignement et de recherche français ou étrangers, des laboratoires publics ou privés.
estuarine conditions
S. Pasquaud, V. David, Jérémy Lobry, Michel Girardin, B. Sautour, Pierre
Elie
To cite this version:
S. Pasquaud, V. David, Jérémy Lobry, Michel Girardin, B. Sautour, et al.. Exploitation of trophic resources by fish under stressful estuarine conditions. Marine Ecology Progress Series, Inter Research, 2010, 400, p. 207 - p. 219. �hal-00474342�
Exploitation of trophic resources by fish under stressful estuarine
1conditions
23
Stéphanie Pasquaud1*, Valérie David2, Jérémy Lobry1, Michel Girardin1, 4
Benoît Sautour3, Pierre Elie1 5
6
1 Cemagref, Estuarine Ecosystems and Diadromous Fish Research Unit, 50 avenue de Verdun F-33612 7
Cestas Cedex, France 8
2 UMR LIENSs 6250 CNRS/Université de La Rochelle, Institut du Littoral et de l’Environnement, 2 rue 9
Olympes de Gouges, F-17000 La Rochelle, France 10
3 UMR 5805 EPOC – OASU, Université de Bordeaux 1, 2 Rue du Professeur Jolyet, F-33120 Arcachon, 11
France 12
ABSTRACT
1314
Despite the high complexity and variability of estuaries, these ecosystems are very 15
productive and play an important role in fish feeding. This paper constitutes a preliminary 16
investigation to test how fish optimize the use of the available trophic resources, by studying 17
trophic preference variability and feeding strategies of some pelagic and demersal fish in the 18
Gironde estuary (southwest France). Fish and their prey were collected approximately every 19
two months from July 2003 to June 2004 in the upstream area of the saline estuary. Stomach 20
content analyses were realized to describe the variability of fish feeding according to their 21
size and the time of year. Intra- and interspecific food niche overlap was evaluated using 22
Schoener’s index and a cross-calculation method was used to highlight the general fish trends 23
in predation strategy. Stomach content results showed interspecific and intraspecific 24
variability in fish feeding, which can be explained by their different or evolutionary 25
ecomorphology. Their diets are composed mainly of zooplankton and hyperbenthic 26
crustaceans with temporal variations in the consumed taxa. Optimization of the available 27
trophic resource use, a key element in estuarine resilience, is thus possible due to the temporal 28
adaptation of this structural trophic web. However, in spite of their temporal adaptation 29
capacity, most fish species exhibited a specialist feeding strategy. This result was not 30
expected. Since zooplankton and hyperbenthic crustaceans exhibit a low specific richness in 31
estuaries, especially in the high turbidity of the Gironde estuary; the loss of one of these 32
species could affect the fish trophic web structure and hence the resilience of the system. 33
34
Keywords: Pelagic and demersal fish - Stomach contents - Diet composition - Feeding 35
strategy - Prey characteristics - Estuarine ecosystem - Gironde estuary 36
INTRODUCTION 37
38
Estuaries are particular ecosystems, where the abiotic environment is especially 39
characterized by fast and high spatio-temporal fluctuations in physico-chemical characteristics 40
(e.g. oxygen, temperature, salinity) in both water column and bed sediment dynamics 41
(McLusky & Elliott 2004). This high environmental variability leads to a high spatio-42
temporal heterogeneity of the biological communities (McLusky & Elliott 2004, David et al. 43
2005), with a low diversity of all components yet often with high abundances of adapted 44
species (Mc Lusky & Elliott 2004). Thus, this strong biological variability is related to the 45
ability of the estuarine biota to cope with natural stress, a key element in estuarine resilience 46
(Elliott & Quintino 2007). 47
In addition, estuaries are generally exposed to high degrees of anthropogenic pressures 48
which can modify their ecological status. Recent works underline the similarity between the 49
features of organisms and assemblages in estuaries and anthropogenically-stressed areas and 50
hence the difficulty of distinguishing natural from human-induced stress in estuaries 51
("Estuarine quality paradox", Elliott & Quintino 2007, Dauvin & Ruellet 2009). 52
Because of these particularities, monitoring and assessing the biodiversity and 53
ecological status of marine ecosystems require a substantial knowledge and a comprehensive 54
understanding of properties across the entire biological system, in particular its structure (e.g. 55
species composition) and functional properties (e.g. ecosystem processes, Hooper et al. 2005, 56
de Jonge et al. 2006). Studying interactions between the biological compartments of an 57
ecosystem, especially trophic relationships, provides a good picture of the biological 58
community structure and is an essential step to understanding how an aquatic system 59
functions (e.g. Elliott & Hemingway 2002, Livingston 2002, Pasquaud et al. 2007, Pasquaud 60
et al. 2008). 61
Topological approaches in trophic models are used to better understand estuarine 62
ecological structure and functioning (e.g. Baird & Ulanowicz 1993, Wolff et al. 2000, Lin et 63
al. 2007, Lobry et al. 2008). Most authors (in particular Lobry et al., 2008) suggest that 64
estuarine communities have to optimize available trophic resources to successfully cope with 65
stressful conditions This suggests that (1) a temporal adaptation of the trophic web would be 66
observed, (2) most estuarine species would be opportunists. This paper constitutes a 67
preliminary investigation to test both these assumptions by analysing the food preferences and 68
the feeding strategies of the main fish species of the Gironde estuary. 69
The first objective was thus to describe the trophic relationship variability according to 70
fish size and time of year of the main Gironde estuarine demersal and pelagic fish species 71
using stomach content analysis, which appears to be the most reliable method to determine 72
fish feeding (Pasquaud et al. 2007). The second objective was to analyze the dynamics of the 73
fish feeding preferences using characteristics of their diet and of their prey population 74
(abundance in the environment, mean weight). 75
MATERIALS AND METHODS
76Study area
77The Gironde estuary (Lat. 45°20′N, Long. 0°45′W, Fig. 1) is located in South West 78
France and opens onto the Bay of Biscay. Its surface area is approximately 625 km² at high 79
tide. It is 76 km long between the ocean and the Bec d’Ambès, where the Dordogne and 80
Garonne rivers meet and which generally constitutes the upstream salinity limit. The 81
watershed covers 81,000 km² and the mean annual rate of freshwater discharge is around 760 82
m3 s-1. These characteristics make it the biggest estuary in France and the largest in Western 83
Europe (Salomon 2002). The tidal range is 4.5 m at the mouth of the estuary and over 5 m at 84
Bordeaux. The Gironde is one of the most turbid estuaries in Europe (Sautour & Castel 1995). 85
River systems carry annually between 1.5 and 3x10⁶ t of suspended particulate matter (SPM, 86
David et al. 2005) to the estuary, with a fairly permanent maximum turbidity zone (SPM 87
about 1 g L-1 at the surface and 10 g L-1 near the bed, (Sottolichio 1999)). As a consequence, 88
primary production in the Gironde is reduced (10 gC m-2 y-1, Irigoien & Castel 1997) and the 89
food web base consists, for the most part, of a varied nutritional pool containing a high 90
proportion of detritus (Irigoien & Castel 1995). 91
The climate of the region is temperate under oceanic influence. Typically, water 92
temperature variability is moderate (between 2°C in January and 26°C in August) and 93
monthly rainfall fluctuates between 50 mm in summer and 100 mm in winter (Tank et al. 94
2002). During the sampling period (from July 2003 to June 2004) the water temperature 95
oscillated between 9.78°C in February and 25.42°C in July in the study area. The river flow 96
remained very low from July to December 2003, in spite of a few strong freshwater inputs in 97
December. The first half of 2004 was relatively dry, characterized only by episodes of 98
flooding in January and April-May (unpublished data). Because of these hydrological 99
conditions, a very strong marine intrusion was observed during summer 2003, with maximum 100
salinity values in September (average salinity 11.43 in the sampling area) and low salinities 101
were recorded in February (0.08), April (0.41) and June (3.48). 102
103
Fish samplings
104To analyze temporal feeding variability, fish were collected approximately every two 105
months from July 2003 to June 2004 in the upper and middle area of the Gironde estuarine 106
haline part (Table 1; Fig. 1). Specimens were caught once per sampled month at five stations 107
(Fig. 1) using an otter trawl (4 m opening and a cod-end with a mesh size of 8 mm). Trawling 108
was restricted to daylight at high tide in order to standardize the samplings, and only when the 109
tidal coefficient was below 75 (trawling above coefficient 80 in this system is not reliable). 110
Haul duration was limited to 15 minutes to optimize the analysis of the stomach contents by 111
minimizing regurgitation and feeding under abnormal conditions in the trawl (Pasquaud et al. 112
2007). All the sampled fish were identified, counted, measured (total length) and weighed. 113
Fish smaller than 200 mm long were immediately placed on dry ice in order to stop the 114
digestion processes. The digestive tract of the largest specimens was conserved on dry ice. 115
The samples were stored at –18°C in the lab. Using this protocol, all the analyses could be 116
carried out on fresh material, after defrosting, thus facilitating handling and also the 117
identification of the fish species and their prey. 118
119
Stomach content analyses
120The fish species analyzed were selected because they were considered typical of the 121
estuarine ichtyofauna both in terms of occurrence and of functional guilds, i.e. ecological and 122
feeding categories (see Lobry et al. 2003 for details; Table 1). Prey sampled in the system for 123
which data were available (cf. “prey data” paragraph) were zooplankton and hyperbenthos. 124
We thus focused on their fish predator species. 125
The stomach contents of 538 individuals from the eight fish species caught in the 126
sampling area were analyzed (Table 1). A minimum of five specimens per taxa and per 127
sampled month, with food items in their stomachs, were selected for analysis (minimum 128
required to obtain a diet picture). Two size ranges were distinguished for Pomatoschistus 129
minutus (small size < 40mm; large size ≥ 40 mm) and Argyrosomus regius (two age classes) 130
to test ontogenic changes in feeding. All the items in the stomachs were examined under a 131
binocular microscope, identified to the highest possible taxonomic level, counted and 132
weighed (dry weight, to nearest 10-4 g). Dietary analysis is traditionally assessed by 133
occurrence (i.e. the percentage of non-empty stomachs where a certain prey item occurred), 134
numerical and volumetric/gravimetric methods (see Hynes 1950, Hyslop 1980 for more 135
details). Each of these measures provides different insight into predator feeding habits (Cortès 136
1997). The numerical percentage of the prey (%N) is well adapted to our objective as it 137
describes feeding behavior (Macdonald & Green 1983). This was calculated for each item 138
consumed by a fish species per month. 139
The mean weight (W in g) of each prey was also estimated from these stomach 140
content analyses (average of the dry weights of each item consumed by a predator species per 141 month). 142 143
Prey data
144Sampling data for shrimps and zooplankton from the same estuarine area and the same 145
months as the fish sampling data were used to characterize prey populations in the 146
environment (Table 1). 147
Shrimps were collected from four transects, established since 1991 for monitoring the 148
smaller components of the estuarine fauna around the Blayais nuclear power plant on a 149
monthly basis (Lobry et al. 2006). Each transect consists of three sites, one close to each bank 150
and one in the main channel of the estuary (Fig. 1). At each site, sampling was carried out 151
simultaneously near the surface and near the bottom, with the water surface sampled using 152
two pushnets located on both sides of the boat (section 4 x 1 m, stretched mesh of 1mm in the 153
cod-end) and the bottom sampled using a dragnet with a 2.0 x 1.2 m frame, kept at 0.2 m 154
above the bed by runners. The net meshes are identical to those used for surface samplings. 155
Sampling was carried out in daytime, between the halfway stage of the flood tide and high 156
tide slack. Each tow lasted about 7 minutes. All the samples collected were preserved in 10% 157
formaldehyde, before being identified and counted at the laboratory. 158
Zooplankton was collected along the study area every 3 units of salinity using a 159
standard 200 µm WP-2net for zooplankton and a 500 µm bongo net, which is better adapted 160
to mysid and amphipod sampling. Vertical hauls were carried out at each station for each net. 161
The catch was preserved in 5% seawater/formalin before being identified and counted at the 162
laboratory. 163
Abundance of the different prey categories was calculated for each month, and 164
expressed as the number of individuals per m3 of filtered water at the sampling site. 165
166
Data analyses
167In order to determine whether the consumption of the different prey varied with time 168
or predator size, permutation tests based on inertia analysis (Chessel et al. 2004) with a 0.05 169
significance level were performed on matrices of the diet composition per each fish predator 170
using the relative abundance (%N) of the prey items. 171
Intra- and interspecific food niche overlap was evaluated using Schoener’s index (SI), 172 defined as 173 − − =
∑
= n i yi xi xy N N SI 1 5 . 0 1 174Where Nxi is the relative abundance of prey category i in the stomach content of species x and 175
Nyi the same relative abundance in the species y (Hurlbert 1978). According to Wallace
176
(1981) and Wallace & Ramsay (1983), overlap values > 0.6 should be considered as 177
biologically significant. 178
The general trends in predation strategy for each species (or size group) and each 179
sampled month were studied using the cross-calculation method described by Azémar et al. 180
(2007). This method allows us to test if a predator diet can be determined by prey 181
characteristics (e.g. abundance or mean weight/size) in the environment. It consists of (1) 182
ranking the prey i of each fish of a predator group (species or size class) as a function of 183
relative abundance (N) in the stomach contents (Ni-ranks; e.g. for E. encrasicolus, stomach 184
content 1: NArcartia = rank1; stomach content 9: NM.slabberi = rank1, Ncirripeds = rank2, NArcartia = 185
rank3), and (2) ranking these same prey according to their abundance (Ab-ranks) and their 186
mean weight (W -ranks) in the environment (e.g. in July, AbArcartia = rank1, AbM.slabberi = 187
rank2, Abcirripeds = rank3). As only prey that appeared in the stomachs contents are considered,
188
predator feeding strategy is assessed within the context of its trophic niche. Moreover, the 189
non-sampled prey in this study (e.g. nauplius crustacean stage) were excluded from the 190
analysis. Next, (3) the frequencies (i.e. number of occurrences observed from all the stomach 191
contents) of each combination Ni-ranks X Abi-ranks and Ni-ranks X IBi-ranks were 192
calculated for each prey of a predator group. Finally, (4) the shape of the distribution was 193
tested using a Spearman rank test at P<0.05. If these frequencies increased or decreased as a 194
function of the prey characteristic ranking (Ab or W ) the predation was considered to be 195
selective according to prey abundance (Ab) or mean weight (W ); otherwise the predation was 196
unselective with regard to the prey characteristic considered (Ab or W ). 197
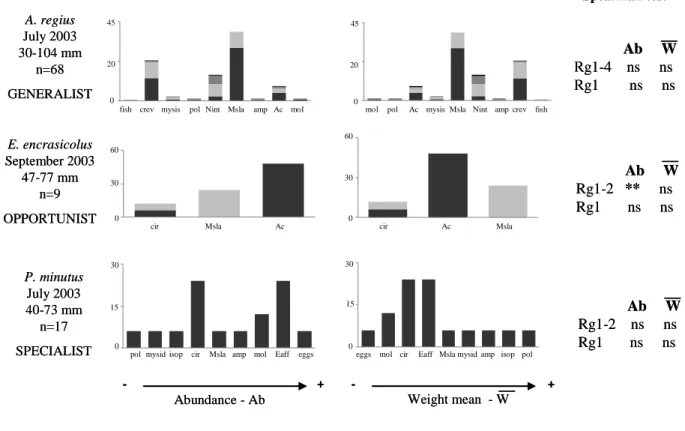
Three different types of predation strategy were determined: (1) generalist, when the 198
Spearman correlation coefficient was not significant for either abundances or mean weights, 199
(2) opportunistic, when frequencies increased significantly with abundances, and (3) 200
specialist, when the highest frequencies were concentrated around a narrow mean weight (Fig. 201 2). 202 203
RESULTS
204 205Interspecific feeding variability
206Fish species showed different feeding ecology and strategy (Fig. 2; Tables 2 & 3). 207
Small marine pelagic fish Sprattus sprattus and Engraulis encrasicolus based their diet on 208
mesozooplankton, feeding mainly on the nauplius stage of crustaceans and on copepods of the 209
genus Acartia. However, their trophic niches did not overlap (SI < 0.6) and their predation 210
strategy was different: E. encrasicolus was an opportunist, i.e. among its food spectrum, this 211
species mainly consumed the most abundant prey in the system (e.g. Acartia in September), 212
whereas S. sprattus was a specialist, focusing on prey of a specific weight (size) range (e.g. 213
selection of cirriped larvae in September, not the most abundant prey). 214
Small estuarine resident species Pomatoschistus minutus and Pomatoschistus microps 215
also consumed a high quantity of mesozooplankton, but their diet varied from that of S. 216
sprattus and E. encrasicolus due to a high consumption of hyperbenthos, essentially mysid 217
Mesopodopsis slabberi and amphipods Gammarus spp (no overlap; SI < 0.6). The two species 218
of Pomatoschistus were seldom present together in the area studied and if they were, they 219
tended to show a trophic niche overlap (February, SI > 0.8). Both were characterized by 220
specialist feeding, essentially on the largest zooplankton (the copepod Eurytemora affinis) and 221
the smallest hyperbenthos (mysids M. slabberi and N. integer). 222
Finally, the feeding of marine demersal fish (e.g. Dicentrarchus labrax, Dicentrarchus 223
punctatus, Argyrosomus regius and Merlangius merlangus) was mainly characterized by 224
hyperbenthic prey such as the mysids M. slabberi and Neomysis integer, the amphipods 225
Gammarus spp. and the shrimps Palaemon spp. 226
The two species of Dicentrarchus did not have a trophic niche overlap and presented different 227
predation strategies, specialist for D. labrax, opportunistic for D. punctatus. In contrast to 228
Dicentrarchus spp., the trophic niches of A. regius and M. merlangus did sometimes overlap, 229
either together or with P. minutus. M. merlangus is a specialist predator, whereas A. regius 230
was able to feed on either a wide range of prey (generalist) or a narrow range of prey 231
(specialist). 232
233
Temporal feeding variability
234Except for P. microps, all fish species showed a significant temporal feeding 235
variability (p-values of the permutation tests < 0.05): 236
- E. encrasicolus consumed a large quantity of mollusk eggs (40%) and nauplius larvae (44%) 237
in July, whereas it ate mostly the copepods Acartia (94%) in September and E. affinis (88%) 238
in November. Its feeding strategy was opportunistic whatever the season. 239
- P. microps based its feeding essentially on eggs (indeterminate and mollusk eggs, 240
respectively 40 and 24 %) in July and on E. affinis in November (55%), February (94%) and 241
April (62%). However, this species showed no significant temporal feeding variability (p-242
value = 0.301). It was a specialist, focusing on prey from a specific weight (size) range 243
whatever the considered month. 244
- The feeding of P. minutus consisted of mollusk eggs (39%) and the mysid M. slaberri (22%) 245
in July, almost exclusively M. slabberi (60% for small individuals and 79% for large 246
individuals) in September, M. slaberri (37%) and Gammarus (21%) in November, mainly E. 247
affinis (84% for the small individuals and 82% for the large individuals) in February, and 248
finally Gammarus (82 or 64%) and N. integer (18 or 28%) in June. Both size classes of P. 249
minutus had specialist strategy, except in November when the numerous prey in their stomach 250
were the most abundant in the system (opportunism). 251
- Concerning the 2003 cohort of A. regius, the diet was dominated numerically by M. slabberi 252
(78%) in July, by the shrimps Palaemon in September (54%) and November (64%) and by N. 253
integer and Gammarus in April (respectively 44% and 28%) and June (31% and 59%). A. 254
regius oscillated between a generalist and a specialist feeding strategy. 255
- D. labrax fed essentially on the Amphipods Gammarus (24%) and the shrimps Palaemon 256
(32%) in February and on Gammarus (57%) and N. integer (14%) in April. 257
- The most abundant prey consumed by M. merlangus were M. slabberi (88%) in September 258
and Palaemon (50%) in November. D. labrax and M. merlangus always showed a specialist 259
feeding strategy. 260
261
Intraspecific feeding variability
262Intra-specific feeding variability according to fish size was tested for P. minutus and 263
A. regius. No significant difference was observed between the diets of the two size groups for 264
P. minutus (p-values > 0.05) contrary to A. regius, e.g. only small specimens feeding on small 265
zooplankton. Moreover, whatever its size, P. minutus presented a specialist strategy whereas 266
A. regius exhibited generalist predation when small and specialist when large. 267
DISCUSSION
268Sample representativeness
269This study is based on analyses on the one hand of fish stomach contents and on the 270
other hand of hyperbenthic invertebrate samples, all from the same estuarine area, i.e. the 271
upstream part of the saline Gironde estuary. 272
As in the saline areas of other European estuaries (Mees et al. 1995, Mc Lusky & 273
Elliott 2004), hyperbenthic invertebrate samples are characterized by a low specific diversity 274
and high densities, features which vary significantly over time. In previous investigations, 275
temporal variability has been linked to fluctuations in environmental factors (David et al. 276
2005, Lobry et al. 2006). In addition, the specific compositions observed in 2003 (Lobry et al. 277
2006, David 2006) were similar to those observed in other Gironde estuary studies (e.g. 278
Castel 1981, Sorbe 1981, Mees et al. 1995): the copepods consisted predominantly of E. 279
affinis in the spring and Acartia spp. in summer; the suprabenthos consisted of N. integer in 280
the spring and M. slaberri and Gammarus spp. in summer, which was similar to other 281
European estuaries (Mees et al. 1993, Soetaert & van Rijswik 1993, Mouny et al. 2000, 282
Mouny & Dauvin 2002). The study area was also representative for zooplankton and estuarine 283
suprabenthos, which were fairly homogenous (David, 2006). Thus the samples collected give 284
a good picture of hyperbenthic prey availability in the brackish part of the estuary for the 285
pelagic and demersal fish selected, i.e. those feeding mainly on these communities. 286
For some fish species chosen, few specimens were collected and/or had a non-empty 287
stomach content, e.g. Sprattus sprattus, Dicentrarchus punctatus. Moreover, these samples 288
were sometimes collected from only one particular trawl, i.e. concerned only a small part of 289
the study area. However, for various reasons these data have been taken into consideration in 290
this study: 291
- These species showed a low intra-group feeding variability, which can be explained by the 292
characteristic of consumed hyperbenthic communities, i.e. few species, high densities. The 293
statistical minimum of 5 individuals would therefore appear sufficient to define the diet of 294
these species. 295
- In the brackish part of the Gironde estuary, there was no significant spatial variability in the 296
prey communities either in composition or density (David et al. 2005, David 2006). Whatever 297
the location of the fish samplings, analysis of their stomach contents was representative of the 298
feeding strategy in the area studied. 299
- The choice of these species allowed us to make strategy comparisons between fish 300
exhibiting ecological and feeding similarities, e.g. S. sprattus and Engraulis encrasicolus, D. 301
punctatus and Dicentrarchus labrax, and provided assumptions on the structuring 302
mechanisms of fish communities in an estuarine environment. 303
304
Inter- and intraspecific fish feeding variability
305Fish stomach content analyses provide more than just a snapshot of what and how 306
much an individual has ingested at a given moment: they give essential information to help 307
understand species feeding requirements and strategies. 308
Investigation of the diet compositions of the eight main pelagic and demersal fish 309
species during the study period in the Gironde estuary enables us to show an interspecific 310
feeding variability. Despite the differences in taxa, geographical distribution and 311
environmental conditions, similar feeding requirements have been observed in other estuarine 312
or marine systems: small pelagic fish, S. sprattus and E. encrasicolus, are zooplanktivores 313
(e.g. Plounevez & Champalbert 1999, Maes & Ollevier 2002), demersal fish, represented by 314
Argyrosomus regius, D. labrax, D. punctatus and Merlangius merlangus, consume 315
hyperbenthos (Moore & Moore 1976, Ktari et al. 1978, Cabral & Ohmert 2001, Laffaille et al. 316
2001) and Pomatoschistus minutus and P. microps eat both mesozooplankton and 317
hyperbenthic prey (Salgado et al. 2004, Leitão et al. 2006). This interspecific feeding 318
variability could be linked to different body structures, i.e. ecotrophomorphology or 319
ecomophology (Wootton 1990). Morphological characteristics (e.g. position, shape and size 320
of the mouth, shape and ability to protrude the jaw, body form and size) determine position in 321
the water column, locomotive abilities and the size of prey intake (e.g. Schafer et al. 2002). 322
This study highlights the fact that species which have ecological and trophic 323
similarities (e.g. S. sprattus and E. encrasicolus or D. labrax and D. punctatus) do not 324
necessarily show diet overlap. Moreover, they present different feeding strategies. For 325
example, the small pelagic fish S. sprattus is a specialist, whereas E. encrasicolus shows 326
opportunistic predation strategies, and the demersal fish D. labrax is a specialist whereas D. 327
punctatus is an opportunist. This feeding strategy variability could narrow diet overlap, 328
minimize interspecific competition and allow the co-occurrence of these species (Oscoz et al. 329
2006). 330
For species presenting ecological and morphological similarities and the same feeding 331
strategies: 332
- either there is no feeding niche overlap. These cases occur when the species considered do 333
not belong to the same size class, e.g. P. minutus and P. microps in November and February, 334
A. regius and M. merlangus in September. Salgado et al. (2004) have already highlighted a 335
decrease in feeding overlap between these two Pomatoschistus species due to an increased 336
difference in length. 337
- or there is a feeding overlap when the resource is not limited, e.g. P. minutus and P. microps 338
in February, A. regius and M. merlangus in November, the time of year when the environment 339
is very poor in species numbers, but those that are present remain abundant, thus limiting any 340
feeding competition. 341
Feeding variability according to size was tested only for P. minutus and A. regius, and 342
not for any other species, either because too few samples per species were available or 343
because their size distribution was too uniform. No significant feeding variation was observed 344
between the two size classes of P. minutus (small size < 40mm; large size ≥ 40 mm). For this 345
species, a dietary shift has already been highlighted for individuals with a total length greater 346
than 50 mm, with a progressive disappearance of copepods and a considerable increase in 347
larger prey (Hamerlynck & Cattrijsse 1994, Salgado et al. 2004). This size range (≥ 50 mm) 348
has not been differentiated in this study because of the small number of specimens. A 349
variation in feeding according to fish length was observed for A. regius but also for M. 350
merlangus with their growth in time. Their diets varied, with larger fish showing an increased 351
consumption of larger prey. Body size effects on feeding shifts have already been identified 352
for these predators (Quéro & Vayne 1987, Pederson 1999, Cabral & Ohmert 2001) as well as 353
for S. sprattus (Arrhenius 1996, Casini et al. 2004), E. encrasicolus (Conway et al. 1998) and 354
D. labrax (Kennedy & Fitzmaurice 1972, Labourg & Stequert 1973). Diet variations 355
according to fish size have already been explained by the evolution in morphology, especially 356
by the increase in predator gape width and swimming speed with the increase in predator size 357
(e.g. Garrison & Link 2000a, Pasquaud et al. 2004). The relative body-size of the component 358
species has often been identified as a major determinant of food web structure (Warren & 359
Lawton 1987). Garrison & Link (2000b) suggest that different size classes within a species 360
may therefore be considered functionally as different species in terms of trophic dynamics. 361
These diet changes are particularly marked when different ontogenetic stages are considered 362
(e.g. Garrison & Link 2000a, Woodward & Hildrew 2002) but these have not been 363
highlighted in this work. 364
The study of feeding strategies according to fish size reveals different behaviors for A. regius 365
(generalist/specialist) and P. minutus (specialist/opportunist). Marshall & Elliott (1996), who 366
studied the feeding ecology of the main fish species recorded in the Humber estuary (United 367
Kingdom), also emphasized specialization by the largest specimens for some species and an 368
increase in niche breadth with size for other species. 369
370
Temporal feeding variability
371In relation to the naturally variable environmental conditions, estuarine biological 372
communities exhibit distinctive temporal patterns at both low (David et al. 2005, David et al. 373
2006) and high trophic levels (see, for instance, Elliott & Hemingway 2002, Lobry et al. 374
2006), suggesting that the resilience of estuarine ecosystems is linked to the temporal trophic 375
structure and perhaps to fish species’ ability to adapt their diet according to available prey in 376
the environment. 377
As in other estuarine systems (e.g. Hajisamae et al. 2003, Hampel et al. 2005, West et 378
al. 2006, Reum & Essington 2008), the present work emphasizes a temporal variability in 379
estuarine fish diets and thus in trophic topology. The use of the cross-calculation method 380
enabled us to identify how fish exploit the trophic resources according to time. As a result, 381
most species were identified as specialist, whatever the month being considered. This study 382
therefore invalidates the common hypothesis that estuarine fish are generally opportunists 383
(e.g. Moore & Moore 1976, Cabral & Ohmert 2001, Laffaille et al. 2001, Baldó & Drake 384
2002, Elliott & Hemingway 2002). Only a minority of the pelagic and demersal fish 385
community in the Gironde estuary - characterized by the marine juveniles E. encrasicolus and 386
D. punctatus and by resident species P. minutus - were found to feed on the predominant 387
abundant prey which differed from month to month. 388
This difference in conclusions, specialist vs opportunist, can be explained by the 389
precision of the method used for this study, as it enabled us to test whether, among all the 390
prey that can be the most abundant in the system, a particular weight (size) range is selected. 391
In the estuarine context where specific diversities are low and densities are high, the use of 392
this method to draw conclusions about fish feeding strategy would seem particularly 393
appropriate. 394
It is interesting to note that this study reveals the specialist feeding strategy of P. 395
microps and P. minutus, always described as opportunistic fish in the literature (e.g. Pilh 396
1985, Pasquaud et al. 2004, Leitão et al. 2006). Nevertheless, the dietary analysis for both size 397
and time emphasizes the capacity of P. minutus to adapt its feeding strategy according to prey 398
availability. We can assume that the other resident species P. microps is able to adapt too. 399
This study highlights the specialist feeding strategy of the S. sprattus, M. merlangus 400
and D. labrax species, whatever the month considered. This strategy had already been shown 401
for S. sprattus, which may have a major impact on the zooplankton community (Brooks & 402
Dodson 1965, Rudstam et al. 1994, Casini et al. 2004). Thus, a decrease in the abundance of 403
these three marine juvenile species or their absence from the system could be linked to a 404
decrease in/disappearance of their preferential prey, associated with an increase in 405
competition pressure (prey availability). For S. sprattus, a decrease in its zooplanktonic prey 406
as well as trophic competition pressure from E. encrasicolus could explain its departure from 407
the study area in November. The temporal segregation of M. merlangus and D. labrax, 408
species that show feeding similarities, could also support this hypothesis. An ability to avoid 409
niche overlap by spatio-temporal segregation has already been shown for these two species in 410
relation to other fish species (Bromley et al. 1997, Cabral & Ohmert 2001). These results 411
suggest a structuring of the fish communities according to prey-predator relationships. 412
However, as suggested by the prey abundances, shrimps are probably not limited in 413
winter. The absence of M. merlangus and A. regius - also specialist but trending towards 414
generalist - in February could be correlated with the environmental conditions, especially low 415
salinities and low water temperatures (Quéro & Vayne 1987, Pasquaud 2006). These 416
observations suggest that the fish assemblages in that brackish part of the estuary are 417
structured more by abiotic factors than by trophic relationships during this period of the year. 418
In other studies (e.g. Costa & Elliott 1991, Thiel et al. 1995, Kupschus & Tremain 2001, 419
Harrison & Whitfield 2006, Lobry et al. 2006) this estuarine fish community structuring has 420
also been related to environmental variables, especially temperature and salinity, which 421
depend on temporal variations in water flow (Lobry et al. 2006). 422
The estuarine fish communities are structured in time both by environmental 423
conditions and trophic relationships (Marshall & Elliott 1996, Kimmerer 2002) but we can 424
hypothesize that these structuring factors do not take effect on the same spatial scales as 425
suggested by Martino & Able (2003): “large-scale patterns in the structure of estuarine fish 426
assemblage are primarily a result of individual species’ responses to dominate environmental 427
gradients, as well as ontogenetic migrations, whereas smaller-scale patterns appear to be the 428
result of habitat associations that are most likely driven by foraging, competition, and/or 429
predator avoidance”. This remark confirms theoretical views on community structure which 430
maintain that physiological tolerances to environmental factors set up the community 431
framework, while biotic interactions refine species distribution patterns within this structure 432
(Weinstein et al. 1980, Menge & Olson 1990) and underlines the need to consider the spatial 433
feeding variability which was not studied in this work. 434
435
CONCLUSIONS
436Analysis of fish stomach contents gave a picture of the temporal patterns of the 437
Gironde estuary fish food web, describing interspecific and intraspecific trophic relationships 438
and the dynamics of the food web structure. Comparisons of the relative abundance of prey in 439
the stomach contents, numerical abundance of these prey in the environment and mean 440
weight, appear particularly relevant for studying fish feeding strategy in estuaries and 441
assessing the trophic functions provided by this system for these species. 442
This study highlights a strong trophic dynamism and suggests a resource partitioning 443
dependent on predator/prey size (according to predator/prey life cycle), prey availability and 444
predator presence (according to predator life cycle and environmental conditions). 445
Optimization of available trophic resource use, a key element in estuarine resilience (Elliott & 446
Quintino 2007), is possible due to the temporal adaptation of this structural trophic web. This 447
trophic dynamism could play a major role in the stability/resilience of this ecosystem (cf. 448
Link 2002), as suggested by recent statements in the biodiversity-stability debate (see for 449
instance Navarrete & Berlow 2006, Elliott & Quintino 2007). 450
In spite of their adaptation capacity, most fish species exhibited a specialist feeding 451
strategy. In the Gironde estuary there are few invertebrate species. We can imagine that the 452
loss of one species will affect the fish trophic web structure and hence the resilience of the 453
system. Comparative spatial studies are envisaged, i.e. intra-system studies, or comparisons 454
with other estuaries or marine systems, to examine whether our conclusions can be 455
generalized, to give a better understanding of the mechanisms of prey-predator structuring 456
and to ascertain the degree of marine fish species dependence on estuarine systems. 457
This study has enabled us to go beyond the structural aspects of biological 458
communities and access functional aspects, in accordance with some recent recommendations 459
by de Jonge et al. (2006) and Elliott & Quintino (2007) concerning the implementation of 460
monitoring programs in estuarine areas. In addition, this approach provides the data needed to 461
develop and/or validate trophic models (i.e. Lobry et al. 2008) in order to identify keystone 462
species (Libralato et al. 2006) and predict the evolution of these systems. 463
Acknowledgements. We would like to thank B. Ballion, R. Le Barh, J.-F. Bigot, F. Daverat, 465
M. Lepage and everyone who took part in sampling surveys. This investigation was supported 466
by the French Institute of Agricultural and Environmental Engineering Research (Cemagref), 467
the Regional Council of Aquitaine and the Ecology and Economics of the Garonne basin 468
programme. 469
LITERATURE CITED 470
Arrhenius F (1996) Diet composition and food selectivity of O-group herring (Clupea 471
harengus L) and sprat (Sprattus sprattus L) in the northern Baltic Sea. ICES J Mar Sci 472
53:701-712 473
Azémar F, Boulêtreau S, Lionard M, Muylaert K, Vyverman W, Meire P, Tackx M (2007) 474
Looking for general trends in trophic interactions among estuarine micro- and 475
mesozooplankton. J Plankton Res 29:135-147 476
Baird D, Ulanowicz RE (1993) Comparative-Study on the Trophic Structure, Cycling and 477
Ecosystem Properties of 4 Tidal Estuaries. Mar Ecol Prog Ser 99:221-237 478
Baldó F, Drake P (2002) A multivariate approach to the feeding habits of small fishes in the 479
Guadalquivir Estuary. J Fish Biol 61:21-32 480
Bromley PJ, Watson T, Hislop JRG (1997) Diel feeding patterns and the development of food 481
webs in pelagic 0-group cod (Gadus morhua L.), haddock (Melanogrammus aeglefinus L.), 482
whiting (Merlangius merlangus L.), saithe (Pollachius virens L.), and Norway pout 483
(Trisopterus esmarkii Nilsson) in the northern North Sea. ICES J Mar Sci 54:846-853 484
Brooks JL, Dodson SI (1965) Predation, body size and composition of plankton. Science 485
150:28-35 486
Cabral HN, Ohmert B (2001) Diet of juvenile meagre, Argyrosomus regius, within the Tagus 487
estuary. Cah Biol Mar 42:289-293 488
Casini M, Cardinale M, Arrhenius F (2004) Feeding preferences of herring (Clupea harengus) 489
and sprat (Sprattus sprattus) in the southern Baltic Sea. ICES J Mar Sci 61:1267-1277 490
Castel J (1981) Aspects de l'étude écologique du plancton de l'estuaire de la Gironde. Oceanis 491
6:535-577 492
Chessel D, Dufour A-B, J. T (2004) The ade4 package - I : One-table methods, R News. In, 493
Vol 4, p 5-10 494
Conway DVP, Coombs SH, Smith C (1998) Feeding of anchovy Engraulis encrasicolus 495
larvae in the northwestern Adriatic Sea in response to changing hydrobiological conditions. 496
Mar Ecol Prog Ser 175:35-49 497
Cortès E (1997) A critical review of methods of studying fish feeding based on analysis of 498
stomach contents: application to elasmobranch fishes. Can J Fish Aquat Sci 54:726-738 499
Costa MJ, Elliott M (1991) Fish usage and feeding in two industrialised estuaries - the Tagus, 500
Portugal, and the Forth, Scotland. In: Elliott M, Ducrotoy JP (eds) Estuaries and coasts : 501
spatial and temporal intercomparisons. Olsen and Olsen, Fredensborg, Denmark, p 289-297 502
Dauvin JC, Ruellet T (2009) The estuarine quality paradox: Is it possible to define an 503
ecological quality status for specific modified and naturally stressed estuarine ecosystems? 504
Mar Poll Bull 59:38-47 505
David V (2006) Variabilité spatio-temporelle du zooplancton dans l'estuaire de la Gironde et 506
implications au sein du réseau trophique planctonique. PhD Thesis, Université de Bordeaux I 507
David V, Sautour B, Chardy P, Leconte M (2005) Long-term changes of the zooplankton 508
variability in a turbid environment: The Gironde estuary (France). Estuarine Coastal and Shelf 509
Science 64:171-184 510
David V, Sautour B, Galois R, Chardy P (2006) The paradox high zooplankton biomass-low 511
vegetal particulate organic matter in high turbidity zones: What way for energy transfer? J 512
Exp Mar Biol Ecol 333:202-218 513
de Jonge VN, Elliott M, Brauer VS (2006) Marine monitoring: Its shortcomings and 514
mismatch with the EU water framework directive's objectives. Mar Poll Bull 53:5-19 515
Elliott M, Hemingway K (eds) (2002) Fishes in Estuaries, Vol. Blackwells, London 516
Elliott M, Quintino V (2007) The Estuarine Quality Paradox, Environmental Homeostasis and 517
the difficulty of detecting anthropogenic stress in naturally stressed areas. Mar Poll Bull 518
54:640-645 519
Garrison LP, Link JS (2000a) Dietary guild structure of the fish community in the Northeast 520
United States continental shelf ecosystem. Mar Ecol Prog Ser 202:231-240 521
Garrison LP, Link JS (2000b) Fishing effects on spatial distribution and trophic guild 522
structure of the fish community in the Georges Bank region. ICES J Mar Sci 57:723-730 523
Hajisamae S, Chou LM, Ibrahim S (2003) Feeding habits and trophic organization of the fish 524
community in shallow waters of an impacted tropical habitat. Estuar Coast Shelf Sci 58:89-98 525
Hamerlynck O, Cattrijsse A (1994) The food of Pomaroschistus minutus (Pisces, Gobiidae) in 526
Belgian coastal waters, and a comparison with the food of its potential competitor P. lozanoi. 527
J Fish Biol 44:753-771 528
Hampel H, Cattrijsse A, Elliott M (2005) Feeding habits of young predatory fishes in marsh 529
creeks situated along the salinity gradient of the Schelde estuary, Belgium and The 530
Netherlands. Helgoland Marine Research 59:151-162 531
Harrison TD, Whitfield AK (2006) Temperature and salinity as primary determinants 532
influencing the biogeography of fishes in South African estuaries. Estuarine Coastal and Shelf 533
Science 66:335-345 534
Hooper DU, Chapin FS, Ewel JJ, Hector A, Inchausti P, Lavorel S, Lawton JH, Lodge DM, 535
Loreau M, Naeem S, Schmid B, Setala H, Symstad AJ, Vandermeer J, Wardle DA (2005) 536
Effects of biodiversity on ecosystem functioning: A consensus of current knowledge. Ecol 537
Monogr 75:3-35 538
Hurlbert ST (1978) The measurement of niche overlap and some relatives. Ecology 59:67-77 539
Hynes HBN (1950) The food of freshwater sticklebacks (Gasterosteus aculeatus and 540
Pygosteus pungitius) with a review of methods used in studies of the food of fishes. J Anim 541
Ecol 19:36-58 542
Hyslop EJ (1980) Stomach contents analysis - a review of methods and their application. J 543
Fish Biol 17:411-429 544
Irigoien X, Castel J (1995) Feeding Rates and Productivity of the Copepod Acartia bifilosa in 545
a Highly Turbid Estuary - the Gironde (Sw France). Hydrobiologia 311:115-125 546
Kennedy M, Fitzmaurice P (1972) The biology of the bass, Dicentrarchus labrax, in Irish 547
waters. J mar biol Ass UK 52:557-597 548
Kimmerer WJ (2002) Effects of freshwater flow on abundance of estuarine organisms: 549
physical effects or trophic linkages? Mar Ecol Prog Ser 243:39-55 550
Ktari MH, Bouain A, Quignard JP (1978) Régime alimentaire des loups (Poissons, 551
Téléostéens, Serranidae) Dicentrarchus labrax (Linné, 1778) et Dicentrarchus punctatus 552
(Bloch, 1892) des côtes tunisiennes. Bulletin de l'Institut National Scientifique et Technique 553
d'Océanographie Pêches Salammbô 5:5-15 554
Kupschus S, Tremain D (2001) Associations between fish assemblages and environmental 555
factors in nearshore habitats of a subtropical estuary. J Fish Biol 58:1383-1403 556
Labourg PJ, Stequert B (1973) Régime alimentaire du bar Dicentrarchus labrax L. des 557
réservoirs à poissons de la région d'Arcachon. Bull Ecol 4:187-194 558
Laffaille P, Lefeuvre J-C, Schricke M-T, Feunteun E (2001) Feeding ecology of 0-group sea 559
bass, Dicentrarchus labrax, in salt marshes of Mont Saint Michel Bay (France). Estuaries 560
24:116-125 561
Leitão R, Martinho E, Neto JM, Cabral H, Marques JC, Pardal MA (2006) Feeding ecology, 562
population structure and distribution of Pomatoschistus microps (Kroyer, 1838) and 563
Pomatoschistus minutus (Pallas, 1770) in a temperate estuary, Portugal. Estuarine Coastal and 564
Shelf Science 66:231-239 565
Libralato S, Christensen V, Pauly D (2006) A method for identifying keystone species in food 566
web models. Ecol Modelling 195:153-171 567
Lin H, Shao K, Jan R, Hsieh H, Chen C, Hsieh L, Hsiao Y (2007) A trophic model for the 568
Danshuei River Estuary, a hypoxic estuary in northern Taiwan. Mar Poll Bull 54:1789-1800 569
Link J (2002) Does food web theory work for marine ecosystems? Mar Ecol Prog Ser 230:1-9 570
Livingston RJ (2002) Trophic organization in coastal systems, Vol. CRC Press 571
Lobry J, David V, Pasquaud S, Lepage M, Sautour B, Rochard E (2008) Diversity and 572
stability of an estuarine trophic network. Mar Ecol Prog Ser 358:13-25 573
Lobry J, Lepage M, Rochard E (2006) From seasonal patterns to a reference situation in an 574
estuarine environment: Example of the small fish and shrimp fauna of the Gironde estuary 575
(SW France). Estuarine Coastal and Shelf Science 70:239-250 576
Lobry J, Mourand L, Rochard E, Elie P (2003) Structure of the Gironde estuarine fish 577
assemblages: a comparison of European estuaries perspective. Aquat Living Resour 16:47-58 578
Macdonald JS, Green RH (1983) Redundancy of variables used to describe importance of 579
prey species in fish diets. Can J Fish Aquat Sci 40:635-637 580
Maes J, Ollevier F (2002) Size structure and feeding dynamics in estuarine clupeoid fish 581
schools: field evidence for the school trap hypothesis. Aquat Living Resour 15:211-216 582
Marshall S, Elliott M (1996) The structure of the fish assemblage in the Humber estuary, 583
United Kingdom. Plublicaciones Especiales Instituto Espanol de Oceanografia 21:231-242 584
Martino EJ, Able KW (2003) Fish assemblages across the marine to low salinity transition 585
zone of a temperate estuary. Estuarine Coastal and Shelf Science 56:969-987 586
Mc Lusky DS, Elliott M (2004) The Estuarine Ecosystem: ecology, threats and management, 587
Vol. Oxford University Press, Oxford 588
Mees J, Fockedey N, Hamerlynck O (1995) Comparative study of the hyperbenthos of three 589
European estuaries. Hydrobiologia 311:153-174 590
Menge BA, Olson AM (1990) Role of scale and environmental factors in regulation of 591
community structure. Trends in Ecology & Evolution 5:52-57 592
Moore JW, Moore IA (1976) The basis of food selection in some estuarine fishes. Eels, 593
Anguilla anguilla (L.), whiting, Merlangius merlangus (L.), sprat, Sprattus sprattus (L.) and 594
stickleback, Gasterosteus aculeatus (L.). J Fish Biol 9:375-390 595
Mouny P, Dauvin JC (2002) Environmental control of mesozooplankton community structure 596
in the seine estuary (English Channel). Oceanol Acta 25:13-22 597
Mouny P, Dauvin JC, Zouhiri S (2000) Benthic Boundary Layer fauna from the Seine Estuary 598
(eastern English Channel, France): spatial distribution and seasonal changes. J mar biol Ass 599
UK 80:959-968 600
Navarrete SA, Berlow EL (2006) Variable interaction strengths stabilize marine community 601
pattern. Ecol Lett 9:526-536 602
Oscoz J, Leunda PM, Miranda R, Escala MC (2006) Summer feeding relationships of the co-603
occurring Phoxinus phoxinus and Gobio lozanoi (Cyprinidae) in an Iberian river. Folia Zool 604
55:418-432 605
Pasquaud S (2006) Les relations trophiques : éléments de structuration des peuplements 606
ichtyologiques en milieu estuarien - Application à l'estuaire de la Gironde. These de doctorat, 607
Université de Bordeaux 1 608
Pasquaud S, Elie P, Jeantet C, Billy I, Martinez P, Girardin M (2008) A preliminary 609
investigation of the fish food web in the Gironde estuary, France, using dietary and stable 610
isotope analyses. Estuar Coast Shelf Sci 78:267-279 611
Pasquaud S, Girardin M, Elie P (2004) Diet of gobies of the genus Pomatoschistus (P. 612
microps and P. minutus), in the Gironde estuary (France). Cybium 28:99-106 613
Pasquaud S, Lobry J, Elie P (2007) Facing the necessity of describing estuarine ecosystems: a 614
review of food web ecology study techniques. Hydrobiologia 588:159-172 615
Pederson J (1999) Diet comparison between pelagic and demersal whiting in the North Sea. J 616
Fish Biol 63:197-212 617
Pilh L (1985) Food selection and consumption of mobile epibenthic fauna in shallow marine 618
areas. Mar Ecol Prog Ser 22:169-179 619
Plounevez S, Champalbert G (1999) Feeding behaviour and trophic environment of Engraulis 620
encrasicolus (L.) in the Bay of Biscay. Estuarine Coastal and Shelf Science 49:177-191 621
Quéro J-C, Vayne J-J (1987) Le maigre, Argyrosomus regius (Asso, 1801) (Pisces, 622
Perciformes, Sciaenidae) du Golfe de Gascogne et des eaux plus septentrionnales. Revue des 623
travaux de l'Institut de Pêches Maritimes 49:35-66 624
Reum JCP, Essington TE (2008) Seasonal variation in guild structure of the Puget Sound 625
demersal fish community. Estuaries and Coasts 31:790-801 626
Rudstam LG, Aneer G, Hildén M (1994) Top-down control in the pelagic Baltic ecosystems. 627
Dana 10:105-129 628
Salgado JP, Cabral HN, Costa MJ (2004) Feeding ecology of the gobies Pomatoschistus 629
minutus (Pallas, 1770) and Pomatoschistus microps (Kroyer, 1838) in the upper Tagus 630
estuary, Portugal. Sci Mar 68:425-434 631
Salomon J-N (2002) L'inondation dans la basse vallée de la Garonne et l'estuaire de la 632
Gironde lors de la "tempête du siècle" (27-28 décembre 1999). Géomorphologie : relief, 633
processus, environnement 2:127-134 634
Sautour B, Castel J (1995) Comparative spring distribution of zooplankton in three macrotidal 635
European estuaries. Hydrobiologia 311:139-151 636
Schafer LN, Platell ME, Valesini FJ, Potter IC (2002) Comparisons between the influence of 637
habitat type, season and body size on the dietary compositions of fish species in nearshore 638
marine waters. Journal of Experimental Marine Biology and Ecology 278:67-92 639
Soetaert K, Van Rijswijk P (1993) Spatial and temporal patterns of the zooplankton in the 640
Westerschelde estuary. Marine ecology process series 97:47-59 641
Sorbe J-C (1981) La macrofaune vagile de l'estuaire de la Gironde : distribution et migration 642
des espèces, modes de reproduction et régimes alimentaires. Océanis 6:579-562 643
Sottolichio A (1999) Modélisation de la dynamique des structures turbides (bouchon vaseux 644
et crème de vase) dans l'estuaire de la Gironde. Thèse de doctorat, Université de Bordeaux I 645
Tank A, Wijngaard JB, Konnen GP, Bohm R, Demaree G, Gocheva A, Mileta M, Pashiardis 646
S, Hejkrlik L, Kern-Hansen C, Heino R, Bessemoulin P, Muller-Westermeir G, Tzanakou M, 647
Szalai S, Palsdottir T, Fitzgerald D, Rubin S, Capaldo M, Maugeri M, Leitass A, Bukantis A, 648
Aberfeld R, Van Engelen AFV, Forland E, Mietus M, Coelho F, Mares C, Razuvaev V, 649
Nieplova E, Cegnar T, Lopez JA, Dahlstrom B, Moberg A, Kirchhofer W, Ceylan A, 650
Pachaliuk O, Alexander LV, Petrovic P (2002) Daily dataset of 20th-century surface air 651
temperature and precipitation series for the European Climate Assessment. International 652
Journal of Climatology 22:1441-1453 653
Thiel R, Sepulveda A, Kafemann R, Nellen W (1995) Environmental-Factors as Forces 654
Structuring the Fish Community of the Elbe Estuary. J Fish Biol 46:47-69 655
Wallace H, Ramsay JS (1983) Reliability in measuring diet overlap. Can J Fish Aquat Sci 656
40:347-351 657
Wallace RK (1981) An assessment of Diet-Overlap Indexes. Trans Am Fish Soc 110:72-76 658
Warren PH, Lawton JH (1987) Invertebrate Predator-Prey Body Size Relationships - an 659
Explanation for Upper-Triangular Food Webs and Patterns in Food Web Structure. Oecologia 660
74:231-235 661
Weinstein MP, Weiss SL, Walters MF (1980) Multiple determinants of community structure 662
in shallow marsh habitats, Cape Fear River Estuary, North Caraolina, USA. Mar Biol 58:227-663
243 664
West JB, Bowen GJ, Cerling TE, Ehleringer JR (2006) Stable isotopes as one of nature's 665
ecological recorders. Trends Ecol Evol 21:408-414 666
Wolff M, Koch V, Isaac V (2000) A Trophic Flow Model of the Caeté Mangrove Estuary 667
(North Brazil) with Considerations for the Sustainable Use of its Resources. Estuar Coast 668
Shelf Sci 50:789-803 669
Woodward G, Hildrew AG (2002) Body-size determinants of niche overlap and intraguild 670
predation within a complex food web. Journal of Animal Ecology 71:1063-1074 671
Wootton RJ (1990) Ecology of Teleost Fishes., Vol. Chapman & Hall, London 672
Captions 673
674
Fig. 1. Location of sampling stations – stars: fish, circles: shrimps (lines represent the four 675
transects) - in the Gironde estuary. 676
677
Fig. 2. Examples of the cumulated frequencies of the relative abundance (N) ranks (Y axis) 678
versus prey abundances (Ab) or mean weights (W ) in the environment for each predation 679
strategy: Argyrosomus regius in July 2003 for generalist species (i.e. Spearman correlation 680
coefficients were not significant for Ab and W ), Engraulis encrasicolus in September 2003 681
for opportunistic species (i.e. frequencies significantly increased with Ab), Pomatoschistus 682
minutus in July 2003 for specialist species (i.e. the highest frequencies were concentrated 683
around a narrow W value). Prey abbreviations: cir: cirriped larvae, mol: mollusc larvae, pol: 684
polychaete larvae, Ac: Acartia spp., Eaff: Eurytemora affinis, mysis: mysis larvae, Nint: 685
Neomysis integer, Msla: Mesopodopsis slabberi, mysid: other mysids, crev: shrimps, amp: 686
amphipods essentially Gammarus spp., isop: isopods. Rg1, Rg2, Rg3 are the first, second and 687
third N-ranks; n is the number of stomach contents used to calculate frequencies. Significant 688
positive correlations between N-rank frequencies and an increase/decrease in the prey 689
characteristic frequencies are shown on the right. Spearman rank correlation was applied to 690
each of the cumulative series of the positive %N ranks, from the first and total N-rank; (** 691
significant trend). 692
Fig. 2 E. encrasicolus September 2003 47-77 mm n=9 OPPORTUNIST P. minutus July 2003 40-73 mm n=17 SPECIALIST
Abundance - Ab Weight mean - W
- + - + A. regius July 2003 30-104 mm n=68 GENERALIST 0 5 10 cir Msla Ac 0 5 10 cir Ac Msla 0 2,5 5
poly mysid isop cir Msla amp mol Eaff eggs 0 2,5 5
eggs mol cir Eaff Msla mysid amp isop poly 0
35 70
fish shr mysis pol Nint Msla amp Ac mol
0 35 70
mol pol Ac mysis Msla Nint amp shr fish
fish crev mysis pol Nint Msla amp Ac mol mol pol Ac mysisMsla Nint ampcrev fish
cir Msla Ac cir Ac Msla
eggs Eaff mysid
pol isop cir Msla amp mol eggs mol cir Eaff Mslamysidamp isop pol
Ab W Rg1-2 ** ns Rg1 ns ns Ab W Rg1-2 ns ns Rg1 ns ns Spearman test Ab W Rg1-4 ns ns Rg1 ns ns 45 0 20 45 0 20 0 60 30 0 60 30 0 30 15 0 30 15 E. encrasicolus September 2003 47-77 mm n=9 OPPORTUNIST P. minutus July 2003 40-73 mm n=17 SPECIALIST
Abundance - Ab Weight mean - W
- + - + A. regius July 2003 30-104 mm n=68 GENERALIST 0 5 10 cir Msla Ac 0 5 10 cir Ac Msla 0 2,5 5
poly mysid isop cir Msla amp mol Eaff eggs 0 2,5 5
eggs mol cir Eaff Msla mysid amp isop poly 0
35 70
fish shr mysis pol Nint Msla amp Ac mol
0 35 70
mol pol Ac mysis Msla Nint amp shr fish
fish crev mysis pol Nint Msla amp Ac mol mol pol Ac mysisMsla Nint ampcrev fish
cir Msla Ac cir Ac Msla
eggs Eaff mysid
pol isop cir Msla amp mol eggs mol cir Eaff Mslamysidamp isop pol
Ab W Rg1-2 ** ns Rg1 ns ns Ab W Rg1-2 ns ns Rg1 ns ns Spearman test Ab W Rg1-4 ns ns Rg1 ns ns 45 0 20 45 0 20 0 60 30 0 60 30 0 30 15 0 30 15
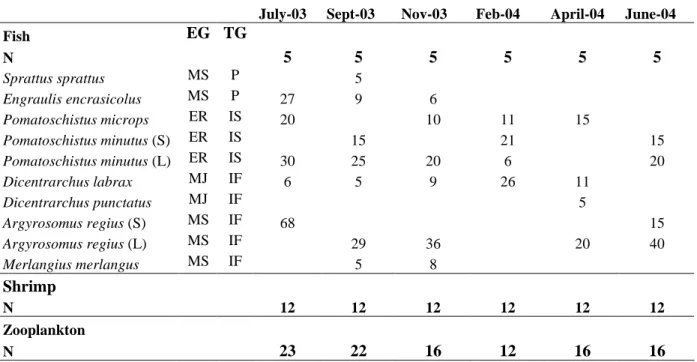
Table 1. Functional guilds (EG: Ecological guild; TG: Trophic guild) and number of fish used for stomach content analyses for each sampled month; N: number of sampled stations for fish, shrimp and zooplankton. ER: Truly estuarine resident fish, MS: Marine seasonal migrant fish, MJ: Marine juvenile migrant fish, P: Planktivore, IS: Invertebrate feeder, IF: Invertebrate and fish feeder.
July-03 Sept-03 Nov-03 Feb-04 April-04 June-04
Fish EG TG N 5 5 5 5 5 5 Sprattus sprattus MS P 5 Engraulis encrasicolus MS P 27 9 6 Pomatoschistus microps ER IS 20 10 11 15 Pomatoschistus minutus (S) ER IS 15 21 15 Pomatoschistus minutus (L) ER IS 30 25 20 6 20 Dicentrarchus labrax MJ IF 6 5 9 26 11 Dicentrarchus punctatus MJ IF 5 Argyrosomus regius (S) MS IF 68 15 Argyrosomus regius (L) MS IF 29 36 20 40 Merlangius merlangus MS IF 5 8 Shrimp N 12 12 12 12 12 12 Zooplankton N 23 22 16 12 16 16
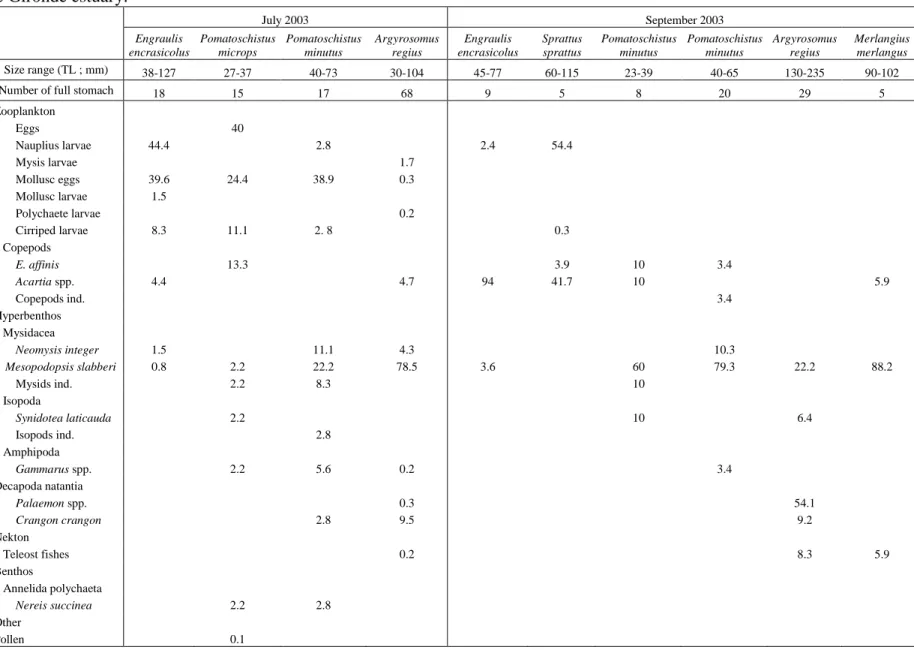
Table 2. Relative abundance diet composition (%N) of the main pelagic and demersal fish according to size and time in the upstream area of the saline Gironde estuary.
July 2003 September 2003 Engraulis encrasicolus Pomatoschistus microps Pomatoschistus minutus Argyrosomus regius Engraulis encrasicolus Sprattus sprattus Pomatoschistus minutus Pomatoschistus minutus Argyrosomus regius Merlangius merlangus Size range (TL ; mm) 38-127 27-37 40-73 30-104 45-77 60-115 23-39 40-65 130-235 90-102
Number of full stomach 18 15 17 68 9 5 8 20 29 5
Zooplankton Eggs 40 Nauplius larvae 44.4 2.8 2.4 54.4 Mysis larvae 1.7 Mollusc eggs 39.6 24.4 38.9 0.3 Mollusc larvae 1.5 Polychaete larvae 0.2 Cirriped larvae 8.3 11.1 2. 8 0.3 Copepods E. affinis 13.3 3.9 10 3.4 Acartia spp. 4.4 4.7 94 41.7 10 5.9 Copepods ind. 3.4 Hyperbenthos Mysidacea Neomysis integer 1.5 11.1 4.3 10.3 Mesopodopsis slabberi 0.8 2.2 22.2 78.5 3.6 60 79.3 22.2 88.2 Mysids ind. 2.2 8.3 10 Isopoda Synidotea laticauda 2.2 10 6.4 Isopods ind. 2.8 Amphipoda Gammarus spp. 2.2 5.6 0.2 3.4 Decapoda natantia Palaemon spp. 0.3 54.1 Crangon crangon 2.8 9.5 9.2 Nekton Teleost fishes 0.2 8.3 5.9 Benthos Annelida polychaeta Nereis succinea 2.2 2.8 Other
November 2003 February 2004 Engraulis encrasicolus Pomatoschistus microps Pomatoschistus minutus Argyrosomus regius Merlangius merlangus Pomatoschistus microps Pomatoschistus minutus Pomatoschistus minutus Dicentrarchus labrax Size range (TL ; mm) 42-62 27-38 41-65 130-249 114-150 26-50 26-38 41-60 80-447
Number of full stomach 6 9 11 36 6 11 21 5 21
Zooplankton Eggs 38.5 4.2 1.4 15.4 Copepods Eurytemora affinis 88.3 55.1 94 84.2 82.3 7.4 Acartia 7.4 Copepods ind. 1. 3 13.7 Hyperbenthos Mysidacea Neomysis integer 5.3 5.4 Mesopodopsis slabberi 3.2 36.8 10 10 0.6 0.2 Schystomysis spp. 1 Mysids ind. 1.7 1.3 15.8 2.7 0.8 Isopoda Synidotea laticauda 15.8 3.6 Amphipoda Gammarus spp. 21.5 1.8 10 1.2 0.4 2.3 24.4 Amphipods ind. 2.16 Decapoda natantia Palaemon spp. 64.5 50 31.6 Crangon crangon 10 18.2 6.1 Nekton Teleost fishes 5.3 1 10 Epibenthos Isopoda Cyathura carinata 1.3 Sphaeroma serratum 3.5 Amphipoda Corophium volutator 2.6 19.8 Decapoda brachyura Pachygrapsus marmoratus 1.5 Rhithropanopeus harrisii 0.8 Crabs ind. 0.8 Annelida polychaeta Nereis spp. 0.8
April 2004 June 2004 Pomatoschistus microps Dicentrarchus labrax Dicentrarchus punctatus Argyrosomus regius Pomatoschistus minutus Pomatoschistus minutus Argyrosomus regius Argyrosomus regius Size range (TL ; mm) 33-39 83-140 92-135 125-260 21-39 40-55 30-52 118-263
Number of full stomach 11 8 5 20 11 19 14 38
Zooplankton Eggs 0.8 Mysis larvae 2.7 0. 7 Copepods Eurytemora affinis 62.2 18.9 Acartia spp. 8.2 Copepods ind. 7.1 Ichtyoplankton 20.3 Hyperbenthos Mysidacea Neomysis integer 5.4 14.3 17.6 44.1 17.6 28 36.5 31.4 Mesopodopsis slabberi 69.4 4.1 8. 2 0.3 Mysids ind. 5.4 1.4 0.13 Isopoda Synidotea laticauda 7.1 2.3 2.7 0.5 Sphaeroma serratum 4.5 Amphipoda Gammarus spp. 18.9 57.1 8.2 27.6 82.3 64 9.5 59.2 Corophium volutator 3.4 Bathyporeia spp. 1.2 Amphipods ind. 8 Decapoda natantia Palaemon spp. 6.9 0.5 Crangon crangon 7.1 10.3 5,1 Nekton Teleost fishes 7.1 1.6 Benthos Annelida polychaeta Nereis succinea 1.2 0.4