HAL Id: hal-02083020
https://hal.umontpellier.fr/hal-02083020
Submitted on 28 Mar 2019
HAL is a multi-disciplinary open access
archive for the deposit and dissemination of
sci-entific research documents, whether they are
pub-lished or not. The documents may come from
teaching and research institutions in France or
abroad, or from public or private research centers.
L’archive ouverte pluridisciplinaire HAL, est
destinée au dépôt et à la diffusion de documents
scientifiques de niveau recherche, publiés ou non,
émanant des établissements d’enseignement et de
recherche français ou étrangers, des laboratoires
publics ou privés.
Sea and paleoceanographic implications
Shunsuke Kurokawa, Ryuji Tada, Kenji Matsuzaki, Tomohisa Irino, Johanna
Lofi
To cite this version:
Shunsuke Kurokawa, Ryuji Tada, Kenji Matsuzaki, Tomohisa Irino, Johanna Lofi. Cyclostratigraphy
of the Late Miocene to Pliocene sediments at IODP sites U1425 and U1430 in the Japan Sea and
paleoceanographic implications. Progress in Earth and Planetary Science, Springer/Japan Geoscience
Union, 2019, 6 (1), pp.2. �10.1186/s40645-018-0250-1�. �hal-02083020�
R E S E A R C H A R T I C L E
Open Access
Cyclostratigraphy of the Late Miocene to
Pliocene sediments at IODP sites U1425
and U1430 in the Japan Sea and
paleoceanographic implications
Shunsuke Kurokawa
1, Ryuji Tada
1, Kenji M. Matsuzaki
1,2*, Tomohisa Irino
3and Lofi Johanna
4Abstract
High-resolution studies of sedimentary sequences have reconstructed paleoceanographic changes in the Atlantic and southern and equatorial Pacific Oceans during the Late Miocene and Pliocene, but comparable analyses are lacking for the North Pacific Ocean. However, continuous samples of hemipelagic sequences covering this time interval were obtained at Integrated Ocean Drilling Program sites U1425 and U1430 in the Japan Sea during expedition 346. Because the paleoceanography of the Japan Sea was sensitive to glacio-eustatic sea-level changes, changes in the sediment record are manifested as cyclic lithological changes. By using a gamma ray attenuation (GRA) density, which reflects biogenic silica content, as an indicator of sea-level changes, we developed an
independent orbitally tuned chronology at each site to construct high-resolution, high-precision age models for the time span of 11.8 to 1.45 Ma. First, the 405-kyr-filtered GRA profile at each site was tuned to 405-kyr-filtered orbital eccentricity. Then, using the 405-kyr-tuned age model, the 100-kyr-filtered GRA profile was tuned to short-eccentricity cycles to adjust the 405-kyr-tuned age models. We used the resulting age models to revise the time intervals of previously published lithological units and paleoceanographic stages for the Japan Sea. Our profiles based on physical properties are a good match to the oxygen isotope record, except for 6.6–3.6 Ma, a time interval with small-amplitude fluctuations in the oxygen isotope record.
Keywords: IODP, Japan Sea, U1425, U1430, Pliocene, Late Miocene, Orbital tuning, Sea level Introduction
The Late Miocene to Pliocene time encompassed the ex-pansion and stabilization of the East Antarctic ice sheet, the onset of northern hemisphere glaciation and the in-tensification of the Asian Monsoon system (e.g., Zachos et al. 2001; De Vleeschouwer et al. 2017, Tada et al.
2016; Betzler et al. 2018; Clift 2017; Holbourn et al.
2018). Paleoceanographic changes during this period have been reconstructed at high resolution on the basis of deep-sea sediments mainly from the Atlantic and southern and equatorial Pacific oceans (e.g., Bell et al.
2014, 2015; Westerhold et al. 2005; Holbourn et al.
2005,2007, 2013a, 2013b,2018; Drury et al.2016). This research has shown that changes in Miocene and Plio-cene climate and oceanography were closely associated with orbital-scale changes in ice volume and the carbon cycle (Holbourn et al. 2013a, 2013b, 2018; Drury et al.
2016). However, there are few continuous, long-term sedimentary sequences of this age suitable for high-resolution analyses from the northwest Pacific Ocean because the calcium carbonate compensation depth was shallow in the area at that time (e.g., Berger
1967; Berger et al. 1982). For that reason, paleoceano-graphic conditions of the Pacific Ocean during this period are not well understood.
The Japan Sea has been a semi-enclosed marginal sea since at least the Early Miocene (Iijima and Tada1990). Its connection to the Pacific Ocean through relatively
* Correspondence:[email protected]
1
Department of Earth and Planetary Science, Graduate School of Science, The University of Tokyo, 7-3-1 Hongo, Bunkyo-ku, Tokyo 113-0033, Japan 2Present Address Atmosphere and Ocean Research Institute, The University of Tokyo, 5-1-5 Kashiwanoha, Kashiwa, Chiba 277-8564, Japan
Full list of author information is available at the end of the article
© The Author(s). 2019 Open Access This article is distributed under the terms of the Creative Commons Attribution 4.0 International License (http://creativecommons.org/licenses/by/4.0/), which permits unrestricted use, distribution, and reproduction in any medium, provided you give appropriate credit to the original author(s) and the source, provide a link to the Creative Commons license, and indicate if changes were made.
shallow straits has made the Japan Sea sensitive to glacio-eustatic sea-level changes, which are manifested as cyclic lithological changes in its sedimentary records (Tada1994). Therefore, it appears feasible to construct a high-resolution and high-precision age model by the use of cyclostratigraphy based on lithological variations, as inferred from gamma ray data, in hemipelagic sediments from the Japan Sea.
In this study, we constructed an orbitally tuned age model for the hemipelagic sediments of the Japan Sea during the period 11.8–1.45 Ma, reconstructed temporal changes in the physical properties of cores, and com-pared them with global and regional benthic oxygen iso-tope records. We utilized core data from Integrated Ocean Drilling Program (IODP) sites U1425 and U1430 in the central and south-central Japan Sea, recovered during expedition 346 (Tada et al. 2015b, 2015c). We used a revised version of the stratigraphic record derived from the cores at each site (Irino et al.2018) combined
with both shipboard and newly published biostrati-graphic data (Kamikuri et al. 2017) to construct high-resolution, high-precision age models at the two sites.
Physical properties measured at high resolution during the cruise were utilized to correlate the sediment records between holes and between coring sites. These physical properties were also used to support orbital tuning be-cause sedimentary cycles were clearly evident in the high-resolution record (e.g., Lourens et al.2005; Tian et al.2008).
Oceanographic and geological setting
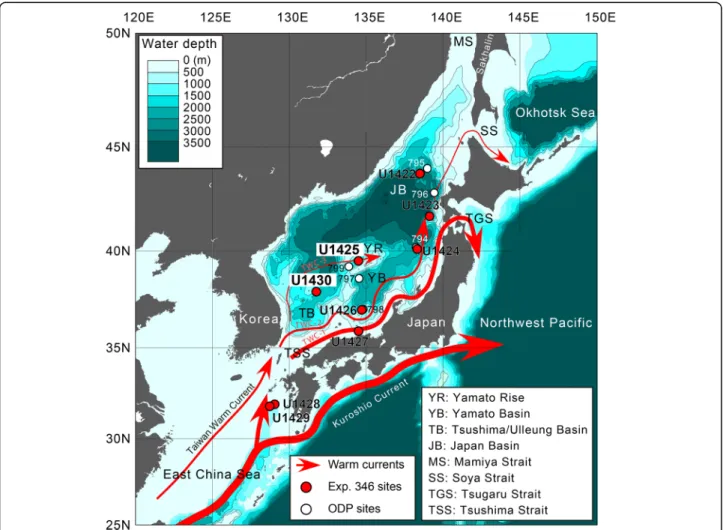
The Japan Sea, with an area exceeding 106km2 and a mean depth of 1667 m, is connected to neighboring seas and the Pacific Ocean through narrow and shallow straits (Fig. 1). The Tsushima Warm Current (TWC), the only current flowing into the sea, controls its oceanographic conditions (Gamo et al.2014). The TWC
Fig. 1 A bathymetric map of the Japan Sea modified from Tada et al. (2015b,2015c). Red circles show the locations of the studied sites U1425 and U1430 drilled during IODP exp. 346 and white circles indicate the drilling sites during ODP leg. 127/128. Warm currents flowed into the Japan Sea are also shown as red arrows. FBTWC, SBTWC, and TBTWC indicate the first, second, and third branch of the Tsushima warm current (TWC), respectively
splits into three branches as it enters the Japan Sea (Hase et al.1999). The first branch originates in the east-ern channel of Tsushima Strait and flows along the west coast of Honshu Island. The second branch originates in the western channel of Tsushima Strait and flows ini-tially along the southern Korean Peninsula, then along the shelf edge to the west of and generally parallel to the first branch. However, this branch is also strongly influ-enced by eddies generated by baroclinic instability (Hase et al. 1999). The third branch originates in the western channel of Tshushima Strait, flows northward along the Korean Peninsula, and then turns to the east around 36° N and forms the Subpolar Front (Kim and Yoon1999). In the northwestern Japan Sea, cooling and freezing caused by the winter monsoon increases the subsurface water density (Talley et al. 2003), which forms the deep Japan Sea Proper Water, characterized by its high dis-solved oxygen content (Gamo et al. 1986). However, oceanographic conditions have been significantly dif-ferent in the past, and the sediments of the Japan Sea give evidence of the basin’s strong sensitivity to re-gional and global climatic and oceanographic changes (Tada 1994).
The Japan Sea first opened approximately 28 Ma, and the deposition of hemipelagic sediments began around 20 Ma (Tamaki et al. 1992; Tada 1994). In their revised lithostratigraphy of Japan Sea hemipelagic sediments ob-tained during Ocean Drilling Program (ODP) leg 127, Tada and Iijima (1992) divided the middle Miocene to Holocene sedimentary sequence into six lithological units. Of these, unit 4 (15.5–10.5 Ma) is composed of gray, highly siliceous rocks and has two subdivisions. Subunit 4B (15.5–14 Ma) is composed of claystone with occasional parallel laminations and flattened horizontal burrows, and subunit 4A (14–10.5 Ma) consists of alter-nating decimeter-scale layers of dark chert and light claystone, the claystone being more strongly bioturbated than the chert. Unit 3 (10.5–6 Ma) is characterized by al-ternating decimeter-scale layers of non-bioturbated dark diatomaceous silty clay and bioturbated light silty clay. Unit 2 (6–2.5 Ma) is composed of heavily bioturbated, homogeneous greenish diatom ooze and diatomaceous clay. Unit 1 (2.5–0 Ma) is composed of alternating centi-meter- to centi-meter-scale layers of dark and light clay to silty clay that are biosiliceous or biocalcareous to various degrees (Tada and Iijima1992; Tada1994).
Tada (1994) reconstructed the circulation of the paleo-Japan Sea from oceanographic information (sur-face and bottom water conditions, calcium carbonate compensation depth, surface productivity, channel pos-ition, and sill depth) and divided the evolution of the Japan Sea into five stages corresponding to the depos-ition of the five uppermost lithological units of Tada and Iijima (1992). During stages 2 and 3 (15.5–6.5 Ma),
which correspond to the deposition of units 4 and 3, re-spectively, the surface water was predominantly cool and the deep water fluctuated between suboxic and anoxic (Tada 1991, 1994). Tada (1991) interpreted cyclic meter-scale lithological changes and apparently annual parallel laminations in the Onnagawa Formation in northeastern Honshu (equivalent to subunit 4A) to argue that terrigenous input fluctuated periodically due to orbitally driven sea-level oscillations. During stage 4 (6.5–2.5 Ma), corresponding to the deposition of unit 2, cold and oxic surface water flowed into the Japan Sea from the north and formed deep water. The consequent upwelling resulted in higher productivity in the surface water and greater deposition of biogenic silica. Stage 5 (2.5–0 Ma), corresponding to the deposition of unit 1, was characterized by large and frequent oscillations of oceanographic conditions. During interglacial sea-level highstands, the TWC was strong and resulted in the production of deep water within the Japan Sea, such that the bottom water became hyperoxic. During glacial low-stands, the Japan Sea became isolated and the TWC was restricted, leading to density stratification beneath the low-salinity surface water and the development of euxi-nic bottom water (Tada1994).
Methods/Experimental
Sites and materials
IODP site U1425 (39°29.44′ N, 134°26.55′ E, water depth 1909 m) is on a terrace in a northeast-southwes-t-oriented graben in the middle of Yamato Bank, and site U1430 (37°54.16′ N, 131°32.25′ E, water depth 1072 m) is about 300 km to the southwest on the southern upper slope of the eastern South Korean Plateau (Tada et al.
2015a,2015c) (Fig.1). The location of site U1425 is now under the influence of the third branch of the TWC at the Subpolar Front, and site U1430 is slightly south of the Subpolar Front (Hase et al. 1999). Miocene sedi-ments were recovered at these two sites during exped-ition 346 (Tada et al.2015b,2015c).
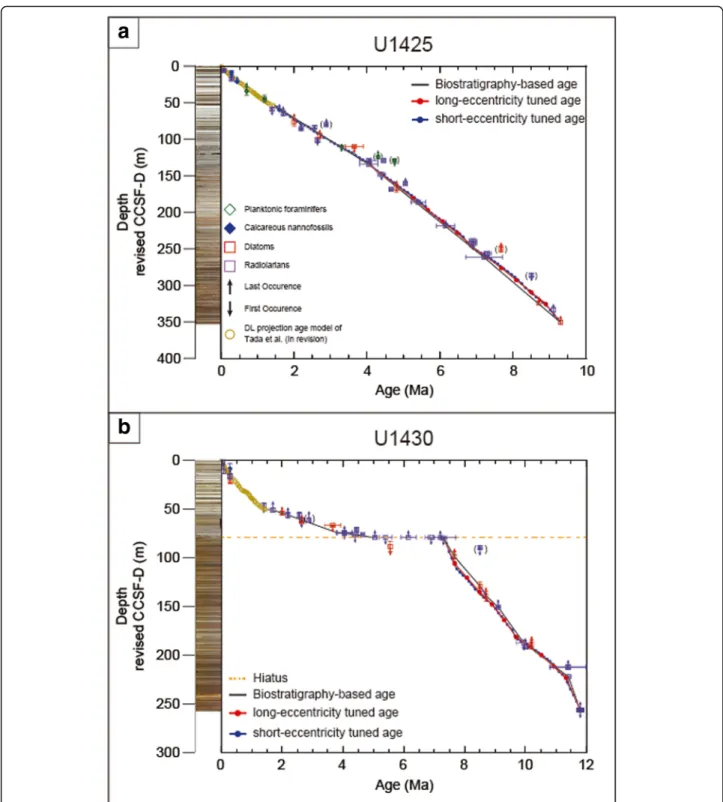
The sedimentary sequence at site U1425 covers the time interval from the Late Miocene to the Holocene (Fig.2a) without any obvious hiatus and is dominated by clay, silty clay, diatomaceous ooze, and siliceous clays-tone (Tada et al. 2015b). The sequence has been divided into three lithological units (units I to III) on the basis of sediment composition, in particular, the abundance of biosiliceous material (Tada et al. 2015a). At site U1430, the sedimentary sequence extends from the middle Mio-cene to the HoloMio-cene (Fig.2b) and has been divided into lithological units I to IV (Tada et al. 2015c). Between 7 Ma and approximately 4.5–5 Ma, sedimentation was ex-tremely slow or absent at this site (Tada et al. 2015c; Kamikuri et al.2017).
Method
Correlation with logging data
Continuous sedimentary records are required to apply cyclostratigraphy to sedimentary sequences. IODP ex-pedition 346 drilled two or more holes at sites U1425
and U1430, from which a continuous Miocene–Pliocene stratigraphic record, or splice, was assembled for each site. During the expedition, the cores at each site were stratigraphically correlated onboard using physical prop-erties such as natural gamma radiation (NGR), gamma
Fig. 2 Age-depth plot of sites U1425 and U1430. Biostratigraphic age control points are shown as symbols. Symbols with parentheses are biostratigraphic datums that are considered as less reliable. Detail explanation is given in the text. 405- and 100-kyr correlation points are also shown (red and blue circles). a U1425, b U1430
ray attenuation (GRA), and color reflectance (Tada et al.
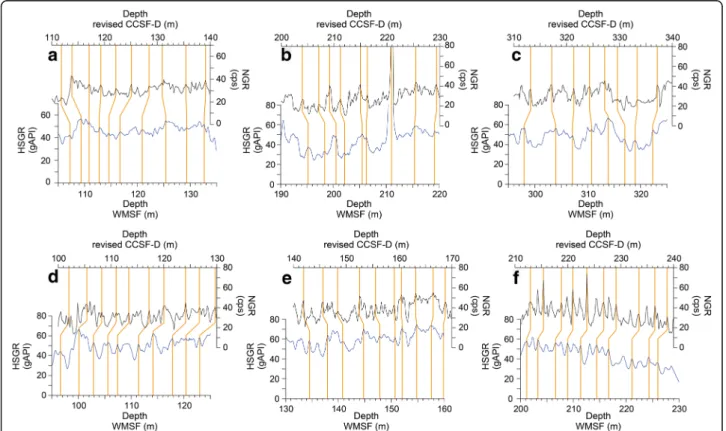
2015b,2015c). On the shore, core photographs were ex-amined to identify small faults and disturbances that could not have been identified in the physical property profiles. The initial splice was revised on the basis of several new tie points within core intervals correspond-ing to lithological units I and III to correct miscorrela-tions and avoid intervals containing sponge plugs and other discontinuities (detailed in Irino et al. 2018). This study adopted the revised splices, in which the updated core composite depth below sea floor (CCSF-D) is re-ferred to as the revised CCSF-D in this paper, and all core depths referred to hereafter are revised CCSF-D depths. The revised CCSF-D for site U1425 is CCSF-D patched rev20170309 in Irino et al. (2018), and the re-vised CCSF-D for site U1430 is CCSF-D patched rev20160113 in Irino et al. (2018). To check the validity of these revised splices, we correlated the revised com-posite NGR data with the hostile standard gamma ray (HSGR) logging data from sites U1425 and U1430. Downhole logs are unaffected by core expansion because they were acquired in situ, and their records are per-fectly continuous with depth. For this reason, core-log integration helps in identifying miscorrelations that may be present (e.g., deMenocal et al.1992; Lofi et al.2016).
In our comparison of the revised NGR splices and the downhole HSGR logs (acquired in hole B at each site), we found strong correlations at the meter scale (Fig. 3). This confirms the validity of the revised splice as there were no significant core gaps deeper than ~ 80 m at sites U1425 and U1430. Correlation points between NGR and HSGR at sites U1425 and U1430 are listed in Tables 1 and 2. Correlation points occur every ~ 5 m in the record from both sites. This resolution ensured that no orbital eccentricity cycles were missing.
It should be noted that gamma ray attenuation by the steel hole casing precluded such a comparison in the upper ~ 80 m at both sites. However, three holes were drilled in this depth range at both sites, such that the re-vised splices were considered reliable despite the lack of core-log integration.
Chronology
To produce an orbitally tuned age model, we used the shipboard biostratigraphic data described in Tada et al. (2015b,2015c) for sites U1425 and U1430 and additional radiolarian datums from Kamikuri et al. (2017).
The biostratigraphic age model for site U1425 ex-tended from 9.3 Ma, the oldest age constraint within the
Fig. 3 Correlation between compoSite NGR (black) and HSGR (blue) by downhole logging. Orange lines show the correlation points. Core-log correlation for site U1425: a 110–140 m, b 200–230 m, and c 310–340 m revised CCSF-D. Core-log correlation for site U1430: d 100–130 m, e 140–170 m, and f 210–240 m revised CCSF-D. All correlation points at both sites are listed in Tables1and 2
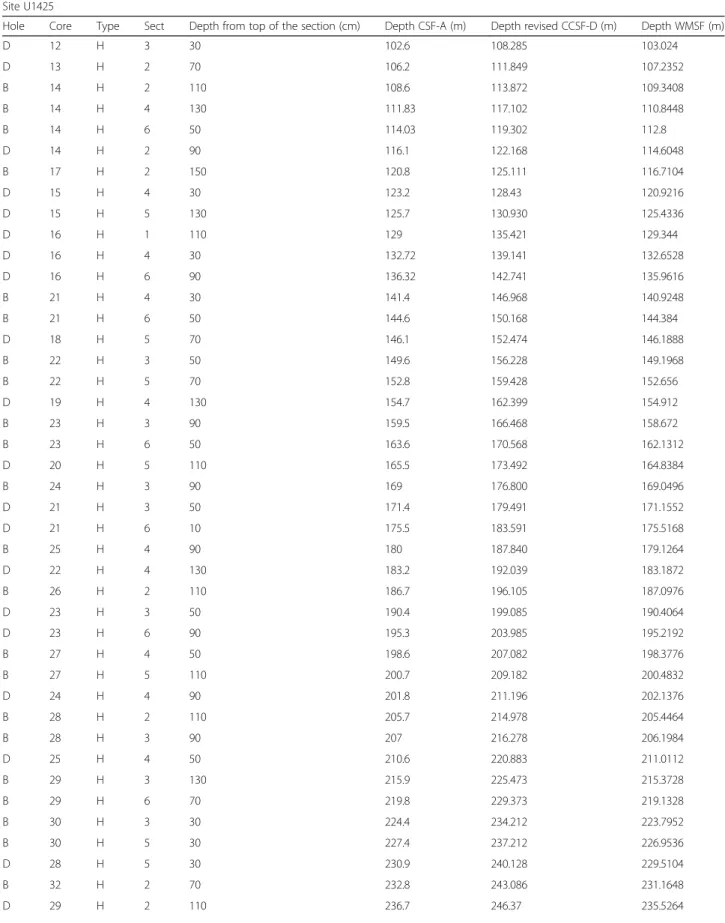
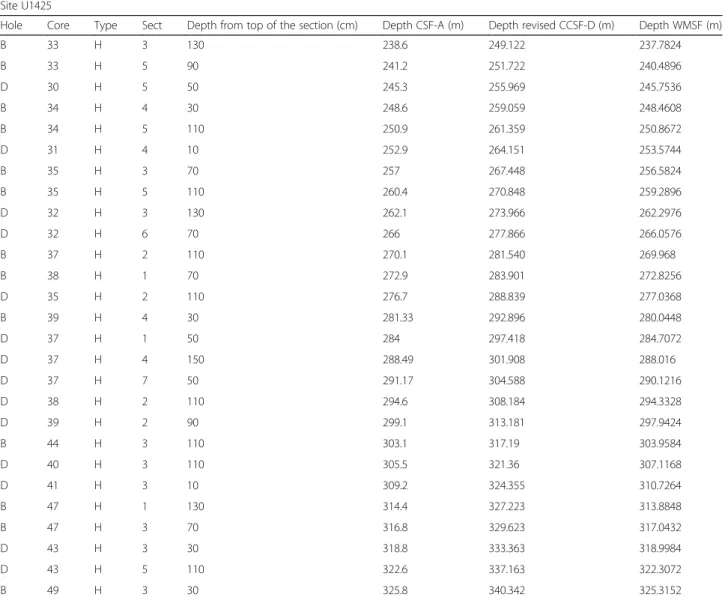
Table 1 Correlation points between revised composite core depth below seafloor (revised CCSF-D) and wireline log matched depth below sea floor (WMSF) at site U1425
Site U1425
Hole Core Type Sect Depth from top of the section (cm) Depth CSF-A (m) Depth revised CCSF-D (m) Depth WMSF (m)
D 12 H 3 30 102.6 108.285 103.024 D 13 H 2 70 106.2 111.849 107.2352 B 14 H 2 110 108.6 113.872 109.3408 B 14 H 4 130 111.83 117.102 110.8448 B 14 H 6 50 114.03 119.302 112.8 D 14 H 2 90 116.1 122.168 114.6048 B 17 H 2 150 120.8 125.111 116.7104 D 15 H 4 30 123.2 128.43 120.9216 D 15 H 5 130 125.7 130.930 125.4336 D 16 H 1 110 129 135.421 129.344 D 16 H 4 30 132.72 139.141 132.6528 D 16 H 6 90 136.32 142.741 135.9616 B 21 H 4 30 141.4 146.968 140.9248 B 21 H 6 50 144.6 150.168 144.384 D 18 H 5 70 146.1 152.474 146.1888 B 22 H 3 50 149.6 156.228 149.1968 B 22 H 5 70 152.8 159.428 152.656 D 19 H 4 130 154.7 162.399 154.912 B 23 H 3 90 159.5 166.468 158.672 B 23 H 6 50 163.6 170.568 162.1312 D 20 H 5 110 165.5 173.492 164.8384 B 24 H 3 90 169 176.800 169.0496 D 21 H 3 50 171.4 179.491 171.1552 D 21 H 6 10 175.5 183.591 175.5168 B 25 H 4 90 180 187.840 179.1264 D 22 H 4 130 183.2 192.039 183.1872 B 26 H 2 110 186.7 196.105 187.0976 D 23 H 3 50 190.4 199.085 190.4064 D 23 H 6 90 195.3 203.985 195.2192 B 27 H 4 50 198.6 207.082 198.3776 B 27 H 5 110 200.7 209.182 200.4832 D 24 H 4 90 201.8 211.196 202.1376 B 28 H 2 110 205.7 214.978 205.4464 B 28 H 3 90 207 216.278 206.1984 D 25 H 4 50 210.6 220.883 211.0112 B 29 H 3 130 215.9 225.473 215.3728 B 29 H 6 70 219.8 229.373 219.1328 B 30 H 3 30 224.4 234.212 223.7952 B 30 H 5 30 227.4 237.212 226.9536 D 28 H 5 30 230.9 240.128 229.5104 B 32 H 2 70 232.8 243.086 231.1648 D 29 H 2 110 236.7 246.37 235.5264
splice, to 1.45 Ma, the end of the orbitally tuned cyclos-tratigraphic age model for site U1425 (Tada et al.2018). All biostratigraphic datums used are plotted in Fig. 2
and listed in Additional file 1. The following datums were discarded. The last occurrence (LO) and first oc-currence (FO) of the planktonic foraminifer Globorota-lia ikebei were determined by its rare occurrence in only one sample, and its presence was attributed to reworking (Tada et al. 2015b). The LO of the diatom Thalassiosira schraderi had a relatively large age uncer-tainty and was not used (Tada et al. 2015b). The LO of the radiolarian Hexacontium parviakitaensis in the Japan Sea was estimated as 2.87–2.90 Ma by Kamikuri et al. (2017), who placed this datum at 86.99 m, whereas the trend from our estimated sedimentation rates sug-gested that the LO of H. parviakitaensis should be at 81.01 m, and we could not rule out reworking. Finally,
the FO of the radiolarian Cycladophora sphaeris (=Cycladophora sakaii in Kamikuri et al. 2004, 2007) has age uncertainties of ~ 0.5 Myr between the eastern North Pacific, western North Pacific, and the Bering Sea (Kamikuri et al.2004,2007).
The biostratigraphic age model for site U1430 ex-tended from 11.8 to 1.45 Ma (Fig.2b). The LO of Hexa-contium parviakitaensis was excluded for consistency with site U1425. The linear sedimentation rates (LSR) for the stratigraphic interval corresponding to 5 to ~ 1.45 Ma were too low (~ 1 cm/kyr) to detect meaningful orbital-scale changes in GRA, and the radiolarian da-tums and the occurrence of a glauconite layer suggest a hiatus during the time interval from 7 to 5 Ma (Kami-kuri et al.2017; Matsuzaki et al.2018; Tada et al.2015c). For this reason, we conducted an orbital tuning only for 11.8 to 7.3 Ma.
Table 1 Correlation points between revised composite core depth below seafloor (revised CCSF-D) and wireline log matched depth below sea floor (WMSF) at site U1425 (Continued)
Site U1425
Hole Core Type Sect Depth from top of the section (cm) Depth CSF-A (m) Depth revised CCSF-D (m) Depth WMSF (m)
B 33 H 3 130 238.6 249.122 237.7824 B 33 H 5 90 241.2 251.722 240.4896 D 30 H 5 50 245.3 255.969 245.7536 B 34 H 4 30 248.6 259.059 248.4608 B 34 H 5 110 250.9 261.359 250.8672 D 31 H 4 10 252.9 264.151 253.5744 B 35 H 3 70 257 267.448 256.5824 B 35 H 5 110 260.4 270.848 259.2896 D 32 H 3 130 262.1 273.966 262.2976 D 32 H 6 70 266 277.866 266.0576 B 37 H 2 110 270.1 281.540 269.968 B 38 H 1 70 272.9 283.901 272.8256 D 35 H 2 110 276.7 288.839 277.0368 B 39 H 4 30 281.33 292.896 280.0448 D 37 H 1 50 284 297.418 284.7072 D 37 H 4 150 288.49 301.908 288.016 D 37 H 7 50 291.17 304.588 290.1216 D 38 H 2 110 294.6 308.184 294.3328 D 39 H 2 90 299.1 313.181 297.9424 B 44 H 3 110 303.1 317.19 303.9584 D 40 H 3 110 305.5 321.36 307.1168 D 41 H 3 10 309.2 324.355 310.7264 B 47 H 1 130 314.4 327.223 313.8848 B 47 H 3 70 316.8 329.623 317.0432 D 43 H 3 30 318.8 333.363 318.9984 D 43 H 5 110 322.6 337.163 322.3072 B 49 H 3 30 325.8 340.342 325.3152
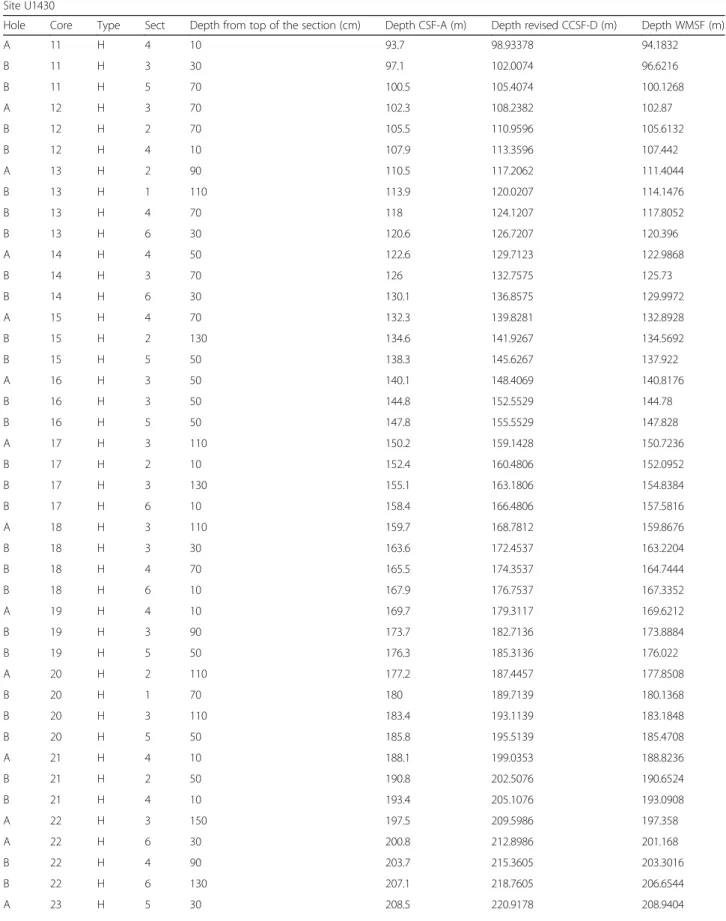
Table 2 Correlation points between revised composite core depth below seafloor (revised CCSF-D) and wireline log matched depth below sea floor (WMSF) at site U1430
Site U1430
Hole Core Type Sect Depth from top of the section (cm) Depth CSF-A (m) Depth revised CCSF-D (m) Depth WMSF (m)
A 11 H 4 10 93.7 98.93378 94.1832 B 11 H 3 30 97.1 102.0074 96.6216 B 11 H 5 70 100.5 105.4074 100.1268 A 12 H 3 70 102.3 108.2382 102.87 B 12 H 2 70 105.5 110.9596 105.6132 B 12 H 4 10 107.9 113.3596 107.442 A 13 H 2 90 110.5 117.2062 111.4044 B 13 H 1 110 113.9 120.0207 114.1476 B 13 H 4 70 118 124.1207 117.8052 B 13 H 6 30 120.6 126.7207 120.396 A 14 H 4 50 122.6 129.7123 122.9868 B 14 H 3 70 126 132.7575 125.73 B 14 H 6 30 130.1 136.8575 129.9972 A 15 H 4 70 132.3 139.8281 132.8928 B 15 H 2 130 134.6 141.9267 134.5692 B 15 H 5 50 138.3 145.6267 137.922 A 16 H 3 50 140.1 148.4069 140.8176 B 16 H 3 50 144.8 152.5529 144.78 B 16 H 5 50 147.8 155.5529 147.828 A 17 H 3 110 150.2 159.1428 150.7236 B 17 H 2 10 152.4 160.4806 152.0952 B 17 H 3 130 155.1 163.1806 154.8384 B 17 H 6 10 158.4 166.4806 157.5816 A 18 H 3 110 159.7 168.7812 159.8676 B 18 H 3 30 163.6 172.4537 163.2204 B 18 H 4 70 165.5 174.3537 164.7444 B 18 H 6 10 167.9 176.7537 167.3352 A 19 H 4 10 169.7 179.3117 169.6212 B 19 H 3 90 173.7 182.7136 173.8884 B 19 H 5 50 176.3 185.3136 176.022 A 20 H 2 110 177.2 187.4457 177.8508 B 20 H 1 70 180 189.7139 180.1368 B 20 H 3 110 183.4 193.1139 183.1848 B 20 H 5 50 185.8 195.5139 185.4708 A 21 H 4 10 188.1 199.0353 188.8236 B 21 H 2 50 190.8 202.5076 190.6524 B 21 H 4 10 193.4 205.1076 193.0908 A 22 H 3 150 197.5 209.5986 197.358 A 22 H 6 30 200.8 212.8986 201.168 B 22 H 4 90 203.7 215.3605 203.3016 B 22 H 6 130 207.1 218.7605 206.6544 A 23 H 5 30 208.5 220.9178 208.9404
Cyclostratigraphy
Quaternary sediments in the Japan Sea contain alternat-ing dark- and light-colored layers that were synchron-ously deposited on the millennial scale, providing a tool for high-resolution correlation (Tada et al.2018). An age model for the upper part of unit I (1.45–0 Ma) was established at site U1424 by Tada et al. (2018) by correl-ating the onboard GRA record of Tada et al. (2015b,
2015c) (regarded as a proxy of sea level) with the LR04 oxygen isotope (δ18
O) sequence of Lisiecki and Raymo (2005), which allows ages of each of the dark layers at site U1424 to be extended to other sites. The orbitally tuned age model proposed here thus applies to the sedi-mentary sequence older than 1.45 Ma.
The Japan Sea sediments are composed of biosiliceous clay to silty clay (Tada et al. 2015b, 2015c). In biosilic-eous sediments, GRA reflects the ratio of detritus to dia-toms and decreases as diatom content increases because diatom frustules have high internal porosity (Tada and Iijima1983). Diatom abundance is strongly linked to sea level because the surface productivity of the Japan Sea is controlled by the influx of nutrients through Tsushima Strait, which in turn has been modulated by glacio-eu-static sea-level changes (Tada et al.2018). GRA likewise increases as the input of detritus increases. During sea-level lowstands, for instance, more terrigenous sedi-ment should reach the study sites in the Japan Sea as the exposed area of the paleo-Japanese islands increases and the distance from the shoreline decreases, and the con-sequent increase in the mass accumulation rate of de-tritus (Tada 1991) results in higher GRA values. Thus, GRA can be used as a sea-level proxy.
To use GRA as a proxy, noise was first removed from the composite onboard GRA data (Tada et al. 2015b,
2015c). GRA values below the specific gravity of sea-water (1.02 g cm− 3) were discarded, as were data corre-sponding to tephra and cracked intervals. The filtered
GRA profiles for sites U1425 and U1430 are presented in Additional file 2. We next performed a spectral ana-lysis of the filtered GRA data to assess their fit to our tuned biostratigraphic age model using REDFIT software (Schulz and Mudelsee2002). We generated Gaussian-fil-tered GRA time-series for both sites and assessed their correlation with temporal variations of Earth’s orbital pa-rameters, including long-eccentricity cycles (405 kyr) and short-eccentricity cycles (100 kyr) calculated by Las-kar et al. (2004). For the Gaussian band-pass filtering, we used AnalySeries 2.0.8 software (Paillard et al. 1996) to sample evenly spaced data points from unevenly spaced original data. Band-pass filters were centered at 0.0025 kyr−1(0.0005 kyr−1bandwidth) and at 0.01 kyr−1 (0.003 kyr−1 bandwidth) to extract 405- and 100-kyr cy-cles, respectively. Tuning assumed no phase lag between GRA variability and orbital parameters, because the re-sponse time of an ice sheet is not known in this time interval (Holbourn et al.2007).
To further improve our orbitally tuned age model, we tuned the GRA data from site U1425 to the oxygen iso-tope record, which is sensitive to sea-level fluctuation. The site U1425 record was chosen for its continuity and for its wide range of variability, which aided the tuning process. We tuned these data to the LR04 oxygen iso-tope record of Lisiecki and Raymo (2005) for 5.3–1.4 Ma
and the benthic oxygen isotope record of Holbourn et al. (2018) from ODP site 1146 in the South China Sea for 10–5.2 Ma.
Results: orbital tuning
A critical part of orbital tuning is the choice of the initial tie point. For site U1425, we used the dark layer no. 21– 2 projection tie points of Tada et al. (2018), which are at 1.45 Ma at 54.79-m-core depth. These have an error margin of about 4 kyr, inherited from the LR04 age model used as a tuning target. This error is negligible
Table 2 Correlation points between revised composite core depth below seafloor (revised CCSF-D) and wireline log matched depth below sea floor (WMSF) at site U1430 (Continued)
Site U1430
Hole Core Type Sect Depth from top of the section (cm) Depth CSF-A (m) Depth revised CCSF-D (m) Depth WMSF (m)
B 23 H 3 70 211.5 223.5968 211.3788 B 23 H 5 90 214.7 226.7968 214.4268 A 24 H 4 10 216.3 229.1107 216.7128 B 24 H 3 130 221.6 233.4764 221.1324 B 24 H 5 130 224.6 236.4764 224.3328 A 25 H 4 50 226.2 238.7943 226.0092 A 25 H 5 130 228.5 241.0943 228.6 B 25 H 4 110 232.4 244.2598 231.8004 A 26 H 2 50 232.7 246.2652 233.7816 B 26 H 3 70 238.3 250.4556 237.8964
for our purposes, and for site U1425, we assumed that the proposed depth-age model has no lag. It was more difficult to define the age model for site U1430 because of the presence of the hiatus. Following Kamikuri et al. (2017), we assumed that the hiatus ended at the FO of the radiolarian Lychnocanoma parallelipes, at 80.057 m (Irino et al. 2018). The FO of L. parallelipes is 7.2–7.4 Ma (Kamikuri et al. 2017); therefore, we assumed that the FO of this species is at 7.3 ± 0.1 Ma. This implies that the proposed depth-age model for site U1430 has an error margin of 0.1 Myr.
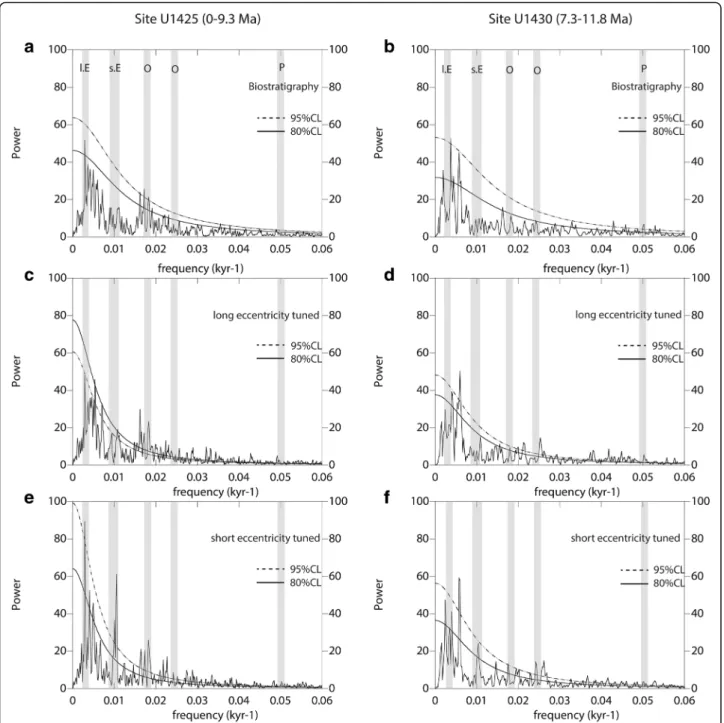
The results of our spectral analysis show that the GRA data at both sites have a characteristic cyclicity that can be correlated with orbital cycles. At site U1425, peaks around 0.0025 and 0.01 that are significant above the 80% confidence level correspond to the long and short-eccentricity cycles, respectively, and peaks around 0.024 may be attributable to obliquity cycles (Fig.4a). At site U1430, the power spectrum also shows a clear peak at 0.0025, a peak at 0.0057 that corresponds to the long obliquity cycle (174 kyr), and peaks around 0.024 that correspond to the 41-kyr obliquity cycle, although a short-eccentricity peak is absent (Fig. 4b). In sum, the GRA data displayed orbital signals at both sites, which we used to construct orbitally tuned age models.
We constructed an age model for each site in two steps. First, 405-kyr-filtered GRA profiles from our bio-stratigraphic age model were tuned to the long (405 kyr) eccentricity cycle. Because this cycle has a stable period-icity over the last 250 Myr, it is well suited for cyclostra-tigraphy (Hinnov 2000; Laskar et al. 2004; Hinnov and Hilgen2012). Second, we tuned the resulting GRA pro-files to the short-eccentricity cycle by correlating eccen-tricity minima with 100-kyr-filtered GRA maxima under the assumption that sea-level lowstands occur during ec-centricity minima that increase the influx of detritus to the Japan Sea and thus raise GRA values, as explained previously.
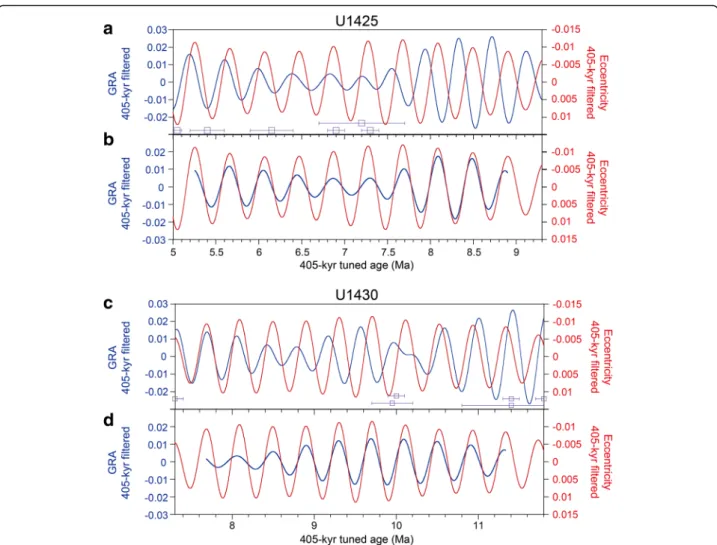
The 405-kyr eccentricity cycle is relatively weak in benthic oxygen isotope records younger than about 5 Ma (Zachos et al. 2001; de Boer et al. 2014), although both 405-kyr and 100-kyr eccentricity cycles are clear in benthic carbon and oxygen isotope records from the Oligocene and Miocene (Pälike et al. 2006; Liebrand et al.2011, 2016,2017; Holbourn et al.2013a,2013b; Bed-dow et al. 2016). Accordingly, we did not use the 405-kyr eccentricity cycle as a tuning target after 5.0 Ma at site U1425. The plot of 405-kyr-filtered GRA records based on the biostratigraphic age model and the long-eccentricity cycle from 9.3 to 5 Ma at site U1425 shows that the two records are nearly a half-wavelength out of phase (Fig. 5a). We tuned the GRA maxima to the nearest eccentricity minima to yield the result shown in Fig. 5b. There are 10 correlated cycles in this time
interval. The mismatch in amplitudes between the GRA signals and eccentricity from 6.2 to 7.5 Ma (Fig. 5b) means that amplitude modulation of GRA by the long-eccentricity cycle is not established for the 9.3–5 Ma interval.
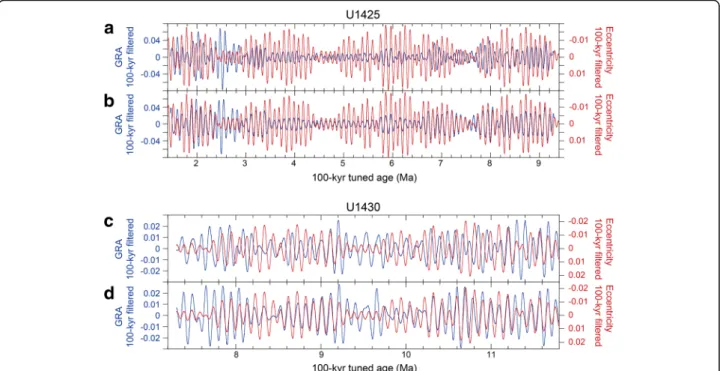
Using an age model based on the long-eccentricity-tuned age model for 9.3–5 Ma and the biostratigraphic model for 5–1.45 Ma, we conducted short-eccentricity tuning to correlate the GRA record and the short-eccen-tricity (100 kyr) cycle. Both GRA and eccenshort-eccen-tricity were fil-tered with a 100-kyr filter using Gaussian band-pass filtering (see the “Method” section), and GRA maxima
were correlated with eccentricity minima (Fig. 6a and b). The amplitudes of the two records were well matched ex-cept from 6.6 to 3.6 Ma, when the overall amplitude of GRA was small regardless of eccentricity (Fig. 6b). The depths and ages of the 405- and 100-kyr correlation points for site U1425 are listed in Tables3 and4and plotted in Fig. 2a, which shows that orbitally tuned correlation points are consistent with the biological datums.
We applied the same procedure to build an orbitally tuned age model for the 11.8–7.3 Ma interval at site U1430, first correlating the 405-kyr-filtered GRA max-ima with long-eccentricity minmax-ima (Fig. 5c and d), then refining the age model by correlating peaks in the 100-kyr-filtered GRA and short-eccentricity records (Fig. 6c and d). The 405-kyr and 100-kyr correlation points are listed in Tables 3 and 4 and plotted against depth in Fig.2b.
We checked the validity of the tuned results by com-paring their power spectra to the power spectra of the biostratigraphic age models (Fig. 4a and f). At site U1425, GRA peaks after short-eccentricity tuning be-came stronger at 405, 100, and 41 kyr and exceeded the 95% confidence level, although other peaks were little changed (Fig.4c and e). At site U1430, cycles of long ec-centricity and obliquity were stronger after orbital tun-ing (Fig. 4b and d). Thus, we are confident that our two-step orbital tuning improved the accuracy of the age models at both sites because the orbital signals of the GRA power spectra were stronger across all orbital peaks (Fig. 4). In addition, we tuned the GRA record to the oxygen isotope record at site U1425 to check the validity of our assumption that GRA is sensitive to sea-level changes and to check the validity of the orbital tuning results. The results, given in Additional files 3,4,
5,6,7,8,9,10,11,12, and13, indicate that our orbitally tuned age model is consistent with the δ18O-tuned age model with a lag no greater than 40 kyr, or less than half of an eccentricity cycle.
Although the GRA power spectra before orbital tuning had peaks attributable to obliquity and precession, we did not conduct tuning with respect to obliquity or pre-cession because the obliquity and prepre-cession cycles have
relatively high uncertainties owing to effects of tidal dis-sipation and changes in dynamical ellipticity, and be-cause GRA amplitudes were too small during some time intervals.
Discussion
Comparison of physical properties with sea-level change
After adjusting our GRA records on the basis of our short-eccentricity-tuned age model, we compared them
to a previously published sea-level record. Miller et al. (2005) compiled two high-resolution benthic oxygen iso-tope records covering the last 9 Myr from ODP site 846 in the equatorial Pacific (Shackleton et al. 1995) and ODP site 982 in the northern North Atlantic (Hodell et al.2001) and converted them to a record of eustatic sea level, using a calibration ratio of 0.1‰/10 m. In this rec-ord, sea-level fluctuations over glacial-interglacial cycles were roughly 40 m before ~ 6 Ma, gradually increased to
Fig. 4 Spectral analysis results of the GRA time-series GRA. Gray shades indicate the orbital signals. l.E = long eccentricity, s.E = short eccentricity, O = obliquity, P = precession. a U1425 biostratigraphy based age. b U1430 biostratigraphy based age. c U1425 long-eccentricity-tuned age. d U1430 long-eccentricity-tuned age. e U1425 short-eccentricity-tuned age, f U1430 short-eccentricity-tuned age
about 100 m by 1.5 Ma, then remained at that amplitude until the present (Miller et al.2005).
For this comparison, we compiled the GRA dataset from both sites, then resampled it and the sea-level rec-ord of Miller et al. (2005) at 100-kyr intervals between 9 and 1.45 Ma. The result (Fig.7) shows a fair correlation (r = 0.63) between the two datasets for this period. Be-tween 6.6 and 3.6 Ma, the GRA amplitudes were small and the estimated sea levels were mostly restricted be-tween 10 and− 20 m. These lower values of estimated sea-level changes may be reflected in the low amplitude of the GRA dataset, and the correlation between GRA and estimated sea-level amplitude was slightly stronger when we excluded the data from 6.6 to 3.6 Ma (r = 0.65).
DeVleeschouwer et al. (2017) compiled a high-resolution benthic oxygen isotope record for the entire Neogene and Quaternary from multiple drill sites in the Atlantic, eastern equatorial Pacific, and South China Sea. We used this
record to compare the variabilities of NGR and GRA at sites U1425 and U1430 with the oxygen isotope record of benthic foraminifers since 12 Ma. The GRA and NGR data were well correlated with the benthic oxygen isotope record before 8 Ma and after 3.3 Ma (Fig. 8), including the last 1.45 Ma (Tada et al.2018); however, the correlation was un-clear between 8 and 3.3 Ma, when both datasets had orbital-scale variations of small amplitude.
In the benthic oxygen isotope record of Miller et al. (1991), excursions Mi-5 to Mi-7 occurred during the time interval covered by the Japan Sea sediments exam-ined in this study. In their orbitally tuned age model based on Fe signals in South Atlantic shallow marine sediments, Westerhold et al. (2005) recognized the Mi-5 and Mi-6 events at 11.7 and 10.7–10.4 Ma, respectively. At site U1430, we recognized GRA and NGR maxima corresponding to these two events at 11.7 and 10.6 Ma, respectively (Fig. 8). The Mi-6 event is also clearly
Fig. 5 Correlation between 405-kyr-filtered GRA and 405-kyr-filtered eccentricity. a, c The 405-kyr-filtered GRA (blue) based on biostratigraphy-based age model at sites U1425 and U1430. Eccentricity is from Laskar et al. (2004) and band-pass filtered at 405-kyr (red) (negative values are uppermost). Biostratigraphic age control points (radiolarians) are shown as purple squares. b, d The 405-kyr-filtered GRA (blue) based on long-eccentricity (405-kyr)-tuned age model at sites U1425 and U1430. The 405-kyr-filtered GRA maxima are tuned to 405-kyr-filtered long-eccentricity minima
evident as a cooling step in the benthic oxygen isotope record from ODP site 1146 in the South China Sea (Hol-bourn et al.2013a). Although the age of the Mi-7 event is uncertain because the oxygen isotope signal has many small maxima between 9.6 and 9.0 Ma (Andersson and Jansen 2003; Westerhold et al. 2005), GRA and NGR maxima in the Japan Sea sediments are compatible with two candidate ages proposed by Westerhold et al. (2005), 9.4 and 8.7 Ma (Fig. 8). The close correspond-ence between physical properties and sea-level changes such as the Mi events tends to confirm the accuracy of short-eccentricity-tuned age models. In addition, our
results support the possibility that the amplitude of sea-level changes can be estimated from GRA data inde-pendent of oxygen isotope values.
Correlation between sites U1425 and U1430
Figure 8 shows the temporal variations of NGR, GRA, and LSR for the last 12 Myr at sites U1425 and U1430. The sedimentary record at site U1425 extends back to 9.3 Ma without any stratigraphic gaps, whereas the sedi-mentary record at site U1430 from 11.8 to 0 Ma is inter-rupted by a probable hiatus from ~ 7.3 to 4.5–5 Ma. Thus, comparisons of the two records are limited to the
Fig. 6 Correlation between 100-kyr-filtered GRA and 100-kyr-filtered eccentricity. a, c The 100-kyr-filtered GRA (blue) based on long-eccentricity-tuned age model at sites U1425 and U1430. Eccentricity is filtered at 100-kyr (red). b, d The 100-kyr-filtered GRA (blue) based on short-eccentricity (100-kyr)-tuned age model at sites U1425 and U1430. The 100-kyr-filtered GRA maxima are tuned to 100-kyr-filtered eccentricity minima
Table 3 405-kyr correlation points for sites U1425 and U1430
Site U1425 Site U1430
405-kyr tie point
Depth revised CCSF-D (m) Age (Ma) Depth revised CCSF-D (m) Age (Ma)
180.44 5.253 106.149 7.685 196.92 5.661 120.443 8.087 212.60 6.067 134.881 8.494 228.62 6.469 147.914 8.899 246.48 6.869 163.999 9.303 261.72 7.272 181.452 9.705 276.29 7.677 191.255 10.112 292.75 8.085 200.029 10.524 309.34 8.493 211.634 10.934 325.72 8.901 223.129 11.337
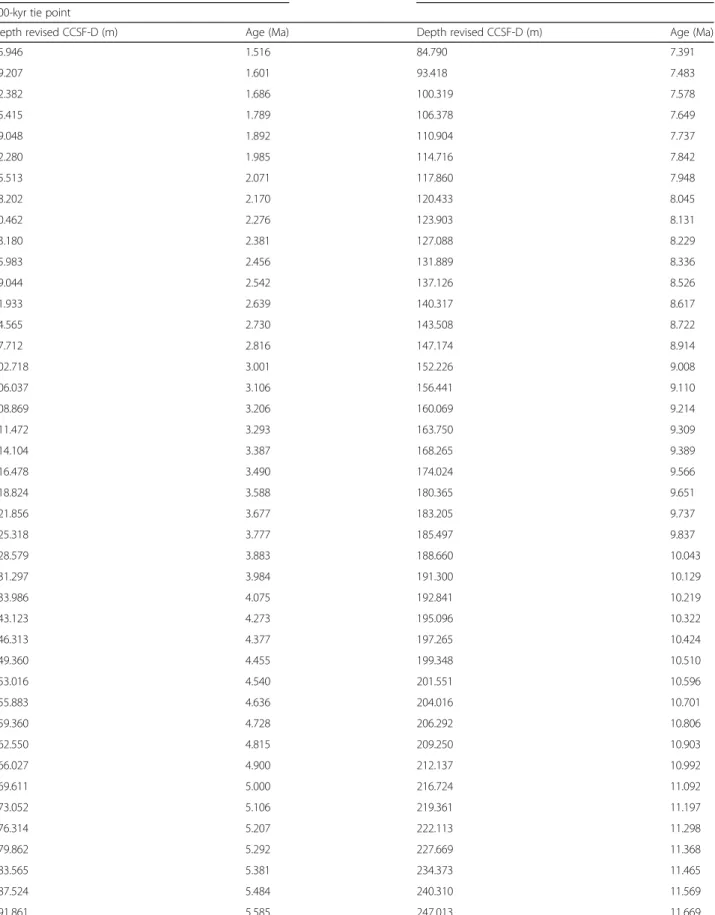
Table 4 100-kyr correlation points for sites U1425 and U1430
Site U1425 Site U1430
100-kyr tie point
Depth revised CCSF-D (m) Age (Ma) Depth revised CCSF-D (m) Age (Ma)
55.946 1.516 84.790 7.391 59.207 1.601 93.418 7.483 62.382 1.686 100.319 7.578 65.415 1.789 106.378 7.649 69.048 1.892 110.904 7.737 72.280 1.985 114.716 7.842 75.513 2.071 117.860 7.948 78.202 2.170 120.433 8.045 80.462 2.276 123.903 8.131 83.180 2.381 127.088 8.229 85.983 2.456 131.889 8.336 89.044 2.542 137.126 8.526 91.933 2.639 140.317 8.617 94.565 2.730 143.508 8.722 97.712 2.816 147.174 8.914 102.718 3.001 152.226 9.008 106.037 3.106 156.441 9.110 108.869 3.206 160.069 9.214 111.472 3.293 163.750 9.309 114.104 3.387 168.265 9.389 116.478 3.490 174.024 9.566 118.824 3.588 180.365 9.651 121.856 3.677 183.205 9.737 125.318 3.777 185.497 9.837 128.579 3.883 188.660 10.043 131.297 3.984 191.300 10.129 133.986 4.075 192.841 10.219 143.123 4.273 195.096 10.322 146.313 4.377 197.265 10.424 149.360 4.455 199.348 10.510 153.016 4.540 201.551 10.596 155.883 4.636 204.016 10.701 159.360 4.728 206.292 10.806 162.550 4.815 209.250 10.903 166.027 4.900 212.137 10.992 169.611 5.000 216.724 11.092 173.052 5.106 219.361 11.197 176.314 5.207 222.113 11.298 179.862 5.292 227.669 11.368 183.565 5.381 234.373 11.465 187.524 5.484 240.310 11.569 191.861 5.585 247.013 11.669
periods 9.3–7.3 and 5–1.5 Ma (Fig. 8). We therefore compiled NGR, GRA, and LSR time-series using the age model of Tada et al. (2018) for the uppermost part of both sites, biostratigraphic data for the 5.0–1.5 Ma
interval at site U1430, and our short-eccentricity-tuned age models (Fig.2).
In general, temporal changes in GRA and NGR were well correlated between the two sites from 3.5
Table 4 100-kyr correlation points for sites U1425 and U1430 (Continued)
Site U1425 Site U1430
100-kyr tie point
Depth revised CCSF-D (m) Age (Ma) Depth revised CCSF-D (m) Age (Ma)
197.275 5.666 253.812 11.756 201.098 5.754 204.850 5.859 208.746 5.963 212.064 6.059 215.100 6.151 219.194 6.252 222.841 6.355 226.079 6.450 229.736 6.532 233.783 6.628 241.000 6.728 245.840 6.821 249.576 6.910 252.965 7.008 256.108 7.113 258.615 7.213 261.334 7.302 264.343 7.389 267.569 7.483 270.559 7.578 274.020 7.649 277.249 7.737 280.943 7.842 284.636 7.948 288.443 8.045 292.552 8.131 297.181 8.229 303.141 8.336 307.393 8.441 311.580 8.526 315.856 8.617 319.532 8.722 323.321 8.823 327.455 8.914 333.349 9.008 339.879 9.110 345.889 9.214
to 0 Ma. From 5.3 to 3.5 Ma, GRA and NGR values were higher at site U1430 than at site U1425 (Fig.8), a differ-ence that can be explained by the fact that the sediment at site U1430 is less diatomaceous or more tuffaceous than at U1425 (Tada et al.2015b,2015c). From 9.3 to 7.3 Ma,
GRA and NGR curves at the two sites were similar. The close correspondence in physical properties suggests that paleoceanographic conditions were similar at sites U1425 and U1430.
During the hiatus interval at site U1430 from 7.3 to 5.3 Ma, there were no significant changes in phys-ical properties and LSR at site U1425 (Fig. 8) or in LSRs at ODP sites 794, 795, and 797 also located in the Japan Sea (Tada 1994). The Late Miocene hia-tuses have been reported from some on-land sec-tions in northeastern Japan (Watanabe 1994), but these correspond to the diatom datums 5D, 6A, and 6B (Akiba 1986; Yanagisawa and Akiba 1998; Tada et al. 2015a, 2015c), which range in age from 9.3 to 7.6 Ma. The hiatus at site U1430 coincides in depth with a major regional unconformity on seismic pro-files (MB3 unconformity in Horozal et al. 2017) that extends over much of the eastern South Korea plat-eau where site U1430 was drilled. The origin of this unconformity is unclear. Watanabe (1994) and Horo-zal et al. (2017) attributed it to erosion by bottom currents or a brief episode of tectonic uplift. What-ever its origin, this hiatus must reflect a local, basin-scale event because there are no drastic changes in LSRs in this time interval in other Japan Sea cores.
Fig. 7 Relationship between GRA and estimated sea level. GRA data are from sites U1425 and U1430 and resampled every 100 kyr. Sea level is converted from oxygen isotope values using a calibration ratio of 0.1‰/10 m (Miller et al.2005). Estimated sea level is also evenly sampled every 100 kyr. Regression line is applied to the all data during the last 9 Myr. Red circles are the data from 6.6 to 3.6 Ma
Fig. 8 Comparison of NGR, GRA, and LSR with composite benthic isotope curve from DeVleeschouwer et al. (2017) (purple). Vertical green lines indicate good correlation between physical properties and oxygen isotope, while yellow lines are indicated that correlation is unclear. Marine isotope stage number from Lisiecki and Raymo (2005) and Miller et al. (1991) is also shown in the top panel. Variations at site U1425 are shown as blue and U1430 as red. Lithological unit (Tada et al.2015b,2015c) and paleoceanographic condition stage number (Tada1994) are also shown and that positions are revised in this study. Parallel lamination positions are shown as blue bars at site U1425 and red bars at site U1430
Revision of lithological divisions at sites U1425 and U1430
Tada et al. (2015b, 2015c) defined a set of lithological units in Japan Sea sediments, of which the latest four (I to IV) and their subunits are represented in the sedi-ments treated in this study. The revised GRA, NGR, and logging profiles and the revised age model constructed in this study lead us to propose revisions of the bound-aries of these units and subunits.
Tada et al. (2015b,2015c) stated that unit I is charac-terized by decimeter-scale intervals of alternating light and dark sediment and that the boundary between sub-unit IA and the underlying subsub-unit IB is distinguished by a downward decrease in the frequency of these alter-nations. They placed the base of subunit IB at 50.7 m at site U1425 and at 46.9 m at Site U1430; however, this change in frequency occurs deeper, at 54.8 m at site U1425 and 50.7 m at site U1430, as shown by litho-logical observations as well as NGR and GRA data (Fig. 8). The same discrepancy is also observed at other IODP expedition 346 sites in the Japan Sea (Tada et al.
2018; Irino et al.2018). The age of the sediment at these revised boundary positions is 1.45 Ma (Tada et al.2018). The NGR and GRA profiles in subunit IA (Fig. 8) dis-play large, suborbital-scale fluctuations after 1.45 Ma that correspond to the color banding in the sediments. The base of subunit IB is defined by a downward change in sediment color and increase in diatom content (Tada et al.2015b,2015c). The increase in diatom content cor-responds to a clear decrease in NGR at 90.71 m at site U1425, ~ 1.5 m shallower than the depth specified by Tada et al. (2015b, 2015c), and 61.14 m at site U1430, the same depth specified in the original definition. The age of this boundary is 2.61 Ma according to our revised age model (Fig. 8). During deposition of unit IB, NGR and GRA fluctuated strongly, as they did in unit IA, but at a lower frequency than in unit IA.
In unit II, the boundary between subunits IIA and IIB is defined by a downward increase in diatom content, which is recorded as a downward decrease in NGR or GRA at 137.34 m at site U1425 (4.14 Ma in our age model) and 74.42 m at site U1430 (4.04 Ma in our age model). NGR data do not show a clear downward de-crease at 74.42 m at site U1430, but this probably re-flects the proximity of an NGR peak from a glauconite layer (e.g., Tada et al. 2015c) at ~ 78.8–79.7 m. The age of the boundary differs slightly between the two sites; however, the age of the upper hiatus at site U1430 is based on a biodatum, which has an error of about ± 0.1 Myr. Accordingly, the boundary positions are con-sistent between the sites.
Tada et al. (2015b, 2015c) distinguished unit III from unit II by its lower diatom content and darker sediment color, which is reflected in higher values of NGR and
GRA (Fig. 8). The boundary between units II and III (specifically, subunit IIB and subunit IIIA) is at 263.25 m at site U1425 and 84.81 m at site U1430, and its age is 7.36–7.39 Ma according to our age model (Fig. 8). Sub-unit IIIA is characterized by higher NGR and GRA values, with fluctuations of greater amplitude, than unit II reflecting the increased contrast between alternating light and dark layers.
In summary, our analysis shows that the revised lower boundaries of the lithological units of Tada et al. (2015b,
2015c) correspond to the following ages: 1.45 Ma for subunit IA, 2.61 Ma for subunit IB, 4.04–4.14 Ma for subunit IIA, and 7.36–7.39 Ma for subunit IIB.
Lithostratigraphic correlation of Japan Sea sites and refinement of paleoceanographic stages
The criteria for defining lithological units were basically the same for ODP leg 127/128 and IODP expedition 346. According to Tada and Iijima (1992), unit 1 in ODP leg 127/128 sediments is characterized by decimeter- to meter-scale alternations of dark and light silty clay to clay and is divided into subunits 1A and 1B on the basis of the frequency of dark layers and the intensity of bio-turbation. Unit 2 is composed of clayey diatom ooze and diatomaceous clay that is heavily bioturbated and mot-tled, with alternating dark and light layers and a general darkening of sediments near its base. This unit is not subdivided. Unit 3 is characterized by decimeter- to meter-scale alternating light and dark layers, the latter being faintly laminated, and by a relatively high organic carbon content.
Tada (1994) compiled the paleoceanographic data of ODP leg 127/128 and paleogeographic data on the Japa-nese islands by Iijima and Tada (1990) to reconstruct the paleoceanographic evolution of the Japan Sea. The pro-posed stages of this history correspond to the lithological units of Tada and Iijima (1992). Given that correspond-ence, paleoceanographic stages 5, 4, and 3 of Tada (1994) are shown in Fig. 8 as coeval with lithological units I, II, and III, respectively.
At sites U1425 and U1430, the boundary between units III and II is based on the increase in diatom con-tent and decrease in terrigenous concon-tent and is assigned an age of ~ 7.4 Ma. Tada (1994) described a dramatic in-crease in biogenic silica content around 8 Ma at the ODP leg 127/128 sites, which is probably correlated with this boundary. According to Tada (1994), during paleo-ceanographic stage 3, bottom water conditions fluctu-ated between anoxic and suboxic in association with eustatic sea-level changes. This history is consistent with the sporadic occurrence of parallel laminations in litho-logical subunit IIIA at sites U1425 and U1430, which suggests the suppression of bioturbation due to low oxy-gen levels (Fig.8). The difference in the ages of parallel
laminations between the two sites may reflect the pos-ition of euxinic or anoxic water masses. The presence of parallel laminations only at site U1425 in the upper part of unit IIIA signifies euxinic or anoxic conditions in the bottom water there and oxic or suboxic conditions at site U1430, whereas the presence of parallel laminations only at site U1430 in the lower part of unit IIIA (~ 9.0 Ma) may indicate the development of an oxygen mini-mum zone within the Japan Sea, because site U1430 was at the appropriate paleo-water depth. Another line of evidence that an oxygen minimum zone developed or expanded in the Japan Sea around 8 Ma is radiolarian data indicating the presence of North Pacific type deep-water species at that paleo-water depth (Matsuzaki et al.2018).
Paleoceanographic stage 4 (7.4–2.61 Ma) corresponds to lithological unit II, which is characterized by relatively low values of GRA and NGR at Site U1425. Tada (1994) suggested that during this stage, terrigenous input was diluted by diatoms due to higher productivity caused by enhanced production of deep water and consequent upwelling.
During paleoceanographic stage 5 (2.61–0 Ma), NGR and GRA fluctuated strongly at millennial to orbital scales, interpreted as the result of millennial-scale changes in the East Asian summer monsoon superim-posed on glacio-eustatic sea-level changes (Tada et al.
2018). The deposition of lithological unit I is thought to have been initiated by a drop in sea level caused by the onset of northern hemisphere glaciation (Lisiecki and Raymo2005; Tada et al.2018).
Conclusions
Long-term composite sedimentary records from IODP sites U1425 and U1430 in the Japan Sea were interpreted using cyclostratigraphy to establish high-resolution age models for the time interval between 11.8 and 1.45 Ma. We used GRA to measure detrital cycles in the sedi-ments, then tuned the GRA profiles to long (405 kyr) and short (100 kyr) eccentricity cycles. In the resulting orbitally tuned age model, NGR and GRA are strongly correlated with the estimated sea-level changes since 9 Ma. Although the changes in physical properties and benthic oxygen isotope ratios were relatively small be-fore 3 Ma, they are shown here to coincide with large-scale sea-level changes such as Mi events. Using the short-eccentricity-tuned age model, we compared the physical properties and LSRs at sites U1425 and U1430 and found that the GRA and NGR profiles are strongly correlated where they overlap, suggesting that paleoceanographic conditions were similar at the two sites, the most notable difference being in paleoceano-graphic conditions during the deposition of subunit IIIA as signified by the occurrence of parallel laminations. By
correlating the lithological units at sites U1425 and U1430 with those at the sites drilled during ODP leg 127/128, we were able to refine the timing of changes in paleoceanographic conditions on the basis of our short-eccentricity-tuned age model. As a result, we re-vise the boundary ages of paleoceanographic stages pro-posed by Tada (1994), and their timings are consistent with other records.
Additional files
Additional file 1:All biostratigraphic datums used. (XLSX 234 kb)
Additional file 2:Filtered GRA profiles for sites U1425 and U1430. (XLSX 19 kb)
Additional file 3:GRA data tuned to LR04 oxygen isotopes records of Lisiecki and Raymo (2005) : 1.4-2.5 Ma. (JPG 2.54 mb)
Additional file 4:GRA data tuned to LR04 oxygen isotopes records of Lisiecki and Raymo (2005) : 2.4-3.5 Ma. (JPG 1.99 mb)
Additional file 5:GRA data tuned to LR04 oxygen isotopes records of Lisiecki and Raymo (2005) : 3.4-4.5 Ma. (JPG 1.97 mb)
Additional file 6:GRA data tuned to LR04 oxygen isotopes records of Lisiecki and Raymo (2005) : 4.4-5.5 Ma. (JPG 1.87 mb)
Additional file 7:GRA data tuned to oxygen isotopes records of Holbourn et al. (2018) : 5.4-6.5 Ma. (JPG 1.58 mb)
Additional file 8:GRA data tuned to oxygen isotopes records of Holbourn et al. (2018) : 6.4-7.5 Ma. (JPG 1.64 mb)
Additional file 9:GRA data tuned to oxygen isotopes records of Holbourn et al. (2018) : 7.4-8.5 Ma. (JPG 2.53 mb)
Additional file 10:GRA data tuned to oxygen isotopes records of Holbourn et al. (2018) : 8.4-9.3 Ma. (JPG 1.67 mb)
Additional file 11:Tie points obtained from oxygen isotopes tuning. (XLSX 38 kb)
Additional file 12:Comparison of orbital tuning results with oxygen isotopes tuning results. (JPG 851 kb)
Additional file 13:1.45 to 9.3 Ma Oxygen isotope tuned GRA and NGR records. (JPG 2.32 kb)
Abbreviations
CCSF:Core composite depth below sea floor; FO: First occurrence; GRA: Gamma ray attenuation; HSGR: Hostile standard gamma ray; IODP: Integrated Ocean Drilling Program; LO: Last occurrence; LSR: Linear sedimentation rate; NGR: Natural gamma radiation; ODP: Ocean Drilling Program; TWC: Tsushima warm current; WMSF: Wireline log matched depth sea floor
Acknowledgements
We thank the technicians and scientists of IODP Expedition 346 for their efforts to acquire the shipboard data that were used in this work. We thank Dr. Martin Ziegler and Dr. Andrew C.G. Henderson, whose suggestions helped to greatly improve the manuscript. We also thank the Japanese shipboard scientists of Expedition 346 for constructive suggestions and comments.
Funding
This work was supported by a grant to the IODP Expedition 346 After Cruise Research Program, JAMSTEC, awarded to TR and IT, and by Japan Society for the Promotion of Science (JSPS) KAKENHI Grant Number 16H01765 awarded to TR. Work by MKM was partly financed by JSPS Research Fellowship for Young Scientist grant 16J02142.
Availability of data and materials
Authors’ contributions
All data were collected by expedition 346 scientists during the IODP expedition 346 cruise. KS conducted the orbital tuning of the GRA data and wrote a draft of the manuscript. TR proposed the topic and conceived and designed the study. MKM helped interpret the biostratigraphy, helped in revising the manuscript, and conducted the oxygen isotope tuning of the GRA data provided in the supplementary files. TI and LJ helped in the correlation of core and logging data. SK drew the figures and wrote a draft of the manuscript. All authors read and approved the final manuscript.
Authors’ information
KS is a student of TR. TR was co-chief scientist of IODP Expedition 346. IT and LJ were shipboard scientists of IODP Expedition 346. MKM was a JSPS Postdoctoral researcher under TR, now assistant professor at the University of Tokyo.
Competing interests
The authors declare that they have no competing interests.
Publisher’s Note
Springer Nature remains neutral with regard to jurisdictional claims in published maps and institutional affiliations.
Author details
1Department of Earth and Planetary Science, Graduate School of Science, The University of Tokyo, 7-3-1 Hongo, Bunkyo-ku, Tokyo 113-0033, Japan. 2Present Address Atmosphere and Ocean Research Institute, The University of Tokyo, 5-1-5 Kashiwanoha, Kashiwa, Chiba 277-8564, Japan.3Graduate School of Environmental Earth Science, Hokkaido University, Sapporo 060-0810, Japan.4Géosciences Montpellier, Université Montpellier II, Place Eugène Bataillon, 34095 Montpellier Cedex 5, France.
Received: 28 September 2017 Accepted: 12 December 2018
References
Akiba F (1986) Middle Miocene to Quaternary diatom biostratigraphy in the Nankai Trough and Japan Trench, and modified lower Miocene through Quaternary diatom zones for middle-to-high latitudes of the North Pacific. Init Rep DSDP 87:393–481.
Andersson C, Jansen E (2003) A Miocene (8–12 Ma) intermediate water benthic stable isotope record from the northeastern Atlantic, ODP Site 982. Paleoceanography 18:1013.https://doi.org/10.1029/2001PA000657. Beddow HM, Liebrand D, Sluijs A, Wade BS, Lourens LJ (2016) Global change
across the Oligocene-Miocene transition: high-resolution stable isotope records from IODP site U1334 (equatorial Pacific Ocean). Paleoceanography 31:81–97.https://doi.org/10.1002/2015PA002820.
Bell DB, Jung SJA, Kroon D, Hodell DA, Lourens LJ, Raymo ME (2015) Atlantic deep-water response to the Early Pliocene Shoaling of the Central American Seaway. Sci Rep 5:12252.https://doi.org/10.1038/srep12252.
Bell DB, Jung SJA, Kroon D, Lourens LJ, Hodell DA (2014) Local and regional trends in Plio-Pleistoceneδ18O records from benthic foraminifera. Geochem
Geophys Geosystems 15:3304–3321.https://doi.org/10.1002/2014GC005297. Berger WH (1967) Foraminiferal ooze: solution at depths. Science 156(3773):383–
385.https://doi.org/10.1126/science.156.3773.383.
Berger WH, Bonneau MC, Parker FL (1982) Foraminifera on the deep-sea floor: lysocline and dissolution rate. Oceanol Acta 5:249–258.
Betzler C, Eberli GP, Lüdmann T, Reolid J, Kroon D, Reijmer JJG, Swart PK, Wright J, Young JR, Alvarez-Zarikian C, Alonso-García M, Bialik OM, Blättler CL, Guo JA, Haffen S, Horozal S, Inoue M, Jovane L, Lanci L, Laya JC, Hui Mee AL, Nakakunim M, Nath BN, Niino K, Petruny LM, Pratiwi SD, Slagle AL, Sloss CR, Su X, Yao Z (2018) Refinement of Miocene sea level and monsoon events from the sedimentary archive of the Maldives (Indian Ocean). Prog Earth Planet Sci 5(5).https://doi.org/10.1186/s40645-018-0165-x.
Clift PD (2017) Cenozoic sedimentary records of climate-tectonic coupling in the Western Himalaya. Prog Earth Planet Sci 4(39).https://doi.org/10.1186/ s40645-017-0151-8.
de Boer B, Lourens LJ, Van De Wal RSW (2014) PerSitent 400,000-year variability of Antarctic ice volume and the carbon cycle is revealed throughout the Plio-Pleistocene. Nat Commun 5:2999.https://doi.org/10.1038/ncomms3999.
De Vleeschouwer D, Vahlenkamp M, Crucifix M, Pӓlike H (2017) Alternating Southern Northern Hemisphere climate response to astronomical forcing during the past 35 m.y. Geology 45:375–378.https://doi.org/10.1130/G38663.1.
deMenocal PB, Bristow JF, Stein R (1992) Paleoclimatic applications of downhole logs: Pliocene-Pleistocene results from hole 798B, Sea of Japan. Proc ODP Sci Results 127/128(Pt. 1):337–353.https://doi.org/10.2973/odp.proc.sr.127128-1. 143.1992College Station TX (Ocean Drilling Program).
Drury AJ, Johm CM, Shevenell AE (2016) Evaluating climatic response to external radiative forcing during the Late Miocene to Early Pliocene: new perspectives from eastern equatorial Pacific (IODP U1338) and North Atlantic (ODP 982) locations. Paleoceanography 31:167–184.https://doi.org/10.1002/ 2015PA002881.
Gamo T, Nakayama N, Takahata N, Sano Y, Zhang J, Yamazaki E, Taniyasu S, Yamashita N (2014) The Sea of Japan and its unique chemistry revealed by time-series observations over the last 30 years. Monogr Environ Earth Planets 2:1–22.https://doi.org/10.5047/meep.2014.00201.0001.
Gamo T, Nozaki Y, Sakai H, Nakai T, Tsubota H (1986) Spacial and temporal variations of water characteristics in the Japan Sea bottom layer. J Mar Res 44:781–793.https://doi.org/10.1357/002224086788401620.
Hase H, Yoon JH, Koterayama W (1999) The current structure of the Tsushima warm current along the Japanese coast. J Oceanogr 55:217–235.https://doi. org/10.1023/A:1007894030095.
Hinnov LA (2000) New perspectives on orbitally forced stratigraphy. Annu Rev 28: 419–475.https://doi.org/10.1146/annurev.earth.28.1.419.
Hinnow LA, Hilgen FJ (2012) Cyclostratigraphy and astrochronology. In: Gradstein F, Ogg J, Ogg G, Smith D (eds) A geologic time scale 2012, vol 4. Elsevier, Amsterdam, pp 63–83.
Hodell DA, Curtis JH, Sierro FJ, Raymo ME (2001) Correlation of Late Miocene to Early Pliocene sequences between the Mediterranean and North Atlantic. Paleoceanography 16:164–178.https://doi.org/10.1029/1999PA000487. Holbourn A, Kuhnt W, Clemens S, Prell W, Anderson N (2013a) Middle to Late
Miocene stepwise climate cooling: evidence from a high-resolution deep water isotope curve spanning 8 million years. Paleoceanography 28:688–699.
https://doi.org/10.1002/2013PA002538.
Holbourn A, Kuhnt W, Frank M, Haley BA (2013b) Changes in Pacific Ocean circulation following the Miocene onset of permanent Antarctic ice cover. Earth Planet Sci Lett 365:38–50.https://doi.org/10.1016/j.epsl.2013.01.020. Holbourn A, Kuhnt W, Schulz M, Erlenkeuser H (2005) Impacts of orbital forcing
and atmosphere carbon dioxide on Miocene ice-sheet expansion. Nature 438:483–487.https://doi.org/10.1038/nature04123.
Holbourn A, Kuhnt W, Schulz M, Flores JA, Anderson N (2007) Orbitally-paced climate evolution furing the middle Miocene“Monterey” carbon-isotope excursion. Earth Planet Sci Lett 261:534–550.https://doi.org/10.1016/j.epsl.2007.07.026.
Holbourn AE, Kuhnt W, Clemens SC, Kochhann KG, Jöhnck J, Lübbers J, Andersen N (2018) Late Miocene climate cooling and intensification of southeast Asian winter monsoon. Nat Commun 9(1):1584.
Horozal S, Kim GY, Cukur D, Bahk JJ, Buchs D, Ryu BJ, Lee GH, Kim SP (2017) Sedimentary and structural evolution of the Eastern South Korea Plateau (ESKP), East China Sea (Japan Sea). Mar Pet Geol 85:70–88.https://doi.org/10. 1016/j.marpetgeo.2017.04.014.
Iijima A, Tada R (1990) Evolution of tertiary sedimentary basins of Japan in reference to opening of the Japan Sea. J Fac Sci Univ Tokyo Section II Geol Mineral Geogr Geophys 22:121–171.
Irino T, Tada R, Ikehara K, Sagawa T, Karasuda A, Kurokawa S, Seki A, Lu S (2018) Construction of perfectly continuous records of physical properties for dark-light sediment sequences collected from the Japan Sea during Integrated Ocean Drilling Program Expedition 346 and their potential utilities as paleoceanographic studies. Prog Earth Planet Sci 5(1):23.https://doi.org/10. 1186/s40645-018-0176-7.
Kamikuri S, Itaki T, Motoyama I, Matsuzaki K (2017) Radiolarian biostratigraphy from Middle Miocene to Late Pleistocene in the Japan Sea. In: Paleontol Res. Kamikuri S, Nishi H, Motoyama A, Saito S (2004) Middle Miocene to Pleistocene
radiolarians biostratigraphy in the Northwest Pacific Ocean, ODP leg 186. Island Arc 13:191–226.https://doi.org/10.1111/j.1440-1738.2003.00421.x. Kamikuri S, Nishi H, Motoyama I (2007) Effects of Late Neogene climatic cooling
on North Pacific radiolarian assemblage and oceanographic conditions. Palaeogeogr Palaeoclimatol Palaeoecol 249:370–392.https://doi.org/10.1016/ j.palaeo.2007.02.008.
Kim CH, Yoon JH (1999) A numerical modeling of the upper and the
intermediate layer circulation in the East Sea. J Oceanogr 55:327–345.https:// doi.org/10.1023/A:1007837212219.
Laskar J, Robutel P, Joutel F, Gastineau M, Correia ACM, Levrard B (2004) A long-term numerical solution for the insolation quantities of the Earth. Astron Astrophys 428:261–285.https://doi.org/10.1051/0004-6361:20041335. Liebrand D, Beddow HM, Lourens LJ, Pӓlike H, Raffi I, Bohaty SM, Hilgen FJ, Saes
MJM, Wilson PA, van Dijk AE, Hodell DA, Kroon D, Huck CE, Batenburg SJ (2016) Cyclostratigraphy and eccentricity tuning of the Early Oligocene through Early Miocene (30.1-17.1 Ma): Cibicides mundulus stable oxygen and carbon isotope records from Walvis Ridge Site 1264. Earth Planet Sci Lett 450:392–405.https://doi.org/10.1016/j.epsl.2016.06.007.
Liebrand D, de Bakker ATM, Beddow HM, Wilson PA, Bohaty SM, Ruessink G, Pӓlike H, Batenburg SJ, Hilgen FJ, Hodell DA, Huck CE, Kroon D, Raffi I, Saes MJM, van Dijk AE, Lourens LJ (2017) Evolution of the Early Antarctic ice ages. Proc Natl Acad Sci 114:3687–3872.https://doi.org/10.1073/pnas.1615440114. Liebrand D, Lourens LJ, Hodell DA, de Boer B, van de Wal RSW, Pӓlike H (2011)
Antarctic ice sheet and oceanographic response to eccentricity forcing during the Early Miocene. Clim Past 7:869–880. https://doi.org/10.5194/cp-7-869-2011.
Lisiecki LE, Raymo ME (2005) A Pliocene-Pleistocene stack of 57 globally distributed benthicδ18O records. Paleoceanography 20(1).https://doi.org/10. 1029/2004PA001071.
Lofi J, Voelker AHL, Ducassou E, Hernández-Molina FJ, Sierro FJ, Bahr A, Galvani A, Lourens LJ, Pardo-Igúzquiza E, Pezard P, Rodríguez-Tovar FJ, Williams T (2016) Quaternary chronostratigraphic framework and sedimentary processes for the Gulf of Cadiz and Portuguese Contourite depositional systems derived from natural gamma ray records. Mar Geol 377:40–57.https://doi.org/10. 1016/j.margeo.2015.12.005.
Lourens LJ, Sluijs A, Kroon D, Zachos JC, Thomas E, Rӧhl U, Bowles J, Raffi I (2005) Astronomical pacing of Late Palaeocene to Early Eocene global warming events. Nature 435:1083–1087.https://doi.org/10.1038/nature03814. Matsuzaki KM, Itaki T, Tada R, Kamkikuri SI (2018) Paleoceanographic history of
the Japan Sea over the last 9.5 million years inferred from radiolarian assemblages (IODP expedition 346 sites U1425 and U1430). Prog Earth Planet Sci 5(54).https://doi.org/10.1186/s40645-018-0204-7.
Miller KG, Kominz MA, Browning JV, Wright JD, Mountain GS, Katz ME, Sugarman PJ, Cramer BS, Christie-Blick N, Pekar SF (2005) The Phanerozoic record of global sea-level change. Science 310:1293–1298.https://doi.org/10.1126/ science.1116412.
Miller KG, Wright JD, Fairbanks RG (1991) Unlocking the ice house: Oligocene-Miocene oxygen isotopes, eustasy, and margin erosion. J Geophys Res 96: 6829–6848.https://doi.org/10.1029/90JB02015.
Paillard D, Labeyrie L, Yiou P (1996) Macintosh program performs time-series analysis. EOS Trans AGU 77:379.https://doi.org/10.1029/96EO00259. Pälike H, Norris RD, Herrle JO, Wilson PA, Coxall HK, Lear CH, Shackleton NJ,
Tripati AK, Wade BS (2006) The heartbeat of the Oligocene climate system. Science 314:1894–1898.https://doi.org/10.1126/science.1133822. Schulz M, Mudelsee M (2002) REDFIT: estimating red-noise spectra directly from
unevenly spaced paleoclimatic time series. Comput Geosci 28:421–426. Shackleton NJ, Hall MA, Pate D (1995) Pliocene stable isotope stratigraphy of site
846. Proc ODP Sci Res 138:337–355.
Tada R (1991) Origin of rhythmical bedding in middle Miocene siliceous rocks of the Onnagawa Formation, northern Japan. J Sed Petrol 61:1123–1145.
https://doi.org/10.1306/D426784D-2B26-11D7-8648000102C1865D. Tada R (1994) Paleoceanographic evolution of the Japan Sea. Palaeogeogr
Palaeoclimatol Palaeoecol 108:487–508. https://doi.org/10.1016/0031-0182(94)90248-8.
Tada R, Iijima A (1983) Petrology and diagenetic changes of Neogene siliceous rocks in northern Japan. J Sediment Petrol 53:911–930.
Tada R, Iijima A (1992) Lithostratigraphy and compositional variation of Neogene hemipelagic sediments in the Japan Sea. Proc ODP Sci Results 127/128(Pt. 2): 1229–1260.https://doi.org/10.2973/odp.proc.sr.127128-2.188.1992College Station, TX (Ocean Drilling Program).
Tada R, Irino T, Ikehara K, Karasuda A, Sugisaki S, Xuan C, Sagawa T, Itaki T, Kubota Y, Lu S, Seki A, Murray RW, Alvarez Zarikian CA, Anderson WT Jr, Bassetti M-A, Brace BJ, Clemens SC, da Costa Gurgel MH, Dickens GR, Dunlea AG, Gallagher SJ, Giosan L, Henderson ACG, Holbourn AE, Kinsley CW, Lee GS, Lee KE, Lofi J, Lopes CICD, Peterson LC, et al. (2018) High-resolution and high-precision correlation of dark and light layers in the Quaternary hemipelagic sediments of the Japan Sea recovered during IODP expedition 346. Prog Earth Planet Sci, 5(1), 19.https://doi.org/10.1186/s40645-018-0167-8.
Tada R, Murray RW, Alvarez Zarikian CA, Anderson WT Jr, Bassetti M-A, Brace BJ, Clemens SC, da Costa Gurgel MH, Dickens GR, Dunlea AG, Gallagher SJ,
Giosan L, Henderson ACG, Holbourn AE, Ikehara K, Irino T, Itaki T, Karasuda A, Kinsley CW, Kubota Y, Lee GS, Lee KE, Lofi J, Lopes CICD, Peterson LC, Saavedra-Pellitero M, Sagawa T, Singh RK, Sugisaki S, Toucanne S, et al. (2015a) Methods. Proc IODP 346: College Station, TX (Integrated Ocean Drilling Program).https://doi.org/10.2204/iodp.proc.346.102.2015. Tada R, Murray RW, Alvarez Zarikian CA, Anderson WT Jr, Bassetti M-A, Brace BJ,
Clemens SC, da Costa Gurgel MH, Dickens GR, Dunlea AG, Gallagher SJ, Giosan L, Henderson ACG, Holbourn AE, Ikehara K, Irino T, Itaki T, Karasuda A, Kinsley CW, Kubota Y, Lee GS, Lee KE, Lofi J, Lopes CICD, Peterson LC, Saavedra-Pellitero M, Sagawa T, Singh RK, Sugisaki S, Toucanne S, et al. (2015b) Site U1425. Proc IODP 346: College Station, TX (Integrated Ocean Drilling Program).https://doi.org/10.2204/iodp.proc.346.106.2015. Tada R, Murray RW, Alvarez Zarikian CA, Anderson WT Jr, Bassetti M-A, Brace BJ,
Clemens SC, da Costa Gurgel MH, Dickens GR, Dunlea AG, Gallagher SJ, Giosan L, Henderson ACG, Holbourn AE, Ikehara K, Irino T, Itaki T, Karasuda A, Kinsley CW, Kubota Y, Lee GS, Lee KE, Lofi J, Lopes CICD, Peterson LC, Saavedra-Pellitero M, Sagawa T, Singh RK, Sugisaki S, Toucanne S, et al. (2015c) Site U1430. Proc IODP 346: College Station, TX (Integrated Ocean Drilling Program).https://doi.org/10.2204/iodp.proc.346.110.2015. Tada R, Zheng H, Clift PD (2016) Evolution and variability of the Asian monsoon
and its potential linkage with uplift of the Himalaya and Tibetan plateau. Prog Earth Planet Sci 3:4.https://doi.org/10.1186/s40645-016-0080-y. Talley LD, Lobanov V, Ponomarev V, Salyuk A, Tishchenko P, Zhabin I, Riser S
(2003) Deep convection and brine rejection in the Japan Sea. Geophys Res Lett 30:1159.https://doi.org/10.1029/2002GL016451.
Tamaki K, Suyehiro K, Allan J, Ingle JC, Pisciotto K (1992) Tectonic synthesis and implications of Japan Sea ODP drilling. Proc ODP Sci Results 127/128(Pt. 2): 1333–1348.https://doi.org/10.2973/odp.proc.sr.127128-2.240.1992College Station TX (Ocean Drilling Program).
Tian J, Zhao Q, Wang P, Li Q, Cheng X (2008) Astronomically modulated Neogene sediment records from South China Sea. Paleoceanography 23: PA3210.https://doi.org/10.1029/2007PA001552.
Watanabe M (1994) A tentative model for the formation of the Late Miocene submarine hiatus around the Japan Sea. Bull Geol Surv Japan 45:471–475. Westerhold T, Bickert T, Röhl U (2005) Middle to Late Miocene oxygen isotope stratigraphy of ODP site 1085 (SE Atlantic): new constrains on Miocene climate variability and sea-level fluctuations. Palaeogeogr Palaeoclimatol Palaeoecol 217:205–222.https://doi.org/10.1016/j.palaeo.2004.12.001. Yanagisawa Y, Akiba F (1998) Refined Neogene diatom biostratigraphy for the
northwest Pacific around Japan, with an introduction of code numbers for selected diatom biohorizons. J Geological Soc Japan 104:395–414. Zachos J, Pagani M, Sloan L, Thomas E, Billups K (2001) Trends, rhythms, and
aberrations in global climate 65 ma to present. Science 292:686–693.https:// doi.org/10.1126/science.1059412.