HAL Id: hal-01340879
https://hal.archives-ouvertes.fr/hal-01340879
Submitted on 2 Jul 2016HAL is a multi-disciplinary open access archive for the deposit and dissemination of sci-entific research documents, whether they are pub-lished or not. The documents may come from teaching and research institutions in France or abroad, or from public or private research centers.
L’archive ouverte pluridisciplinaire HAL, est destinée au dépôt et à la diffusion de documents scientifiques de niveau recherche, publiés ou non, émanant des établissements d’enseignement et de recherche français ou étrangers, des laboratoires publics ou privés.
Geometrical evolution of interlocked rough slip surfaces:
The role of normal stress
Nir Badt, Yossef Hatzor, Renaud Toussaint, Amir Sagy
To cite this version:
Nir Badt, Yossef Hatzor, Renaud Toussaint, Amir Sagy. Geometrical evolution of interlocked rough slip surfaces: The role of normal stress. Earth and Planetary Science Letters, Elsevier, 2016, 443, pp.153-161. �10.1016/j.epsl.2016.03.026�. �hal-01340879�
1
Geometrical evolution of interlocked rough slip surfaces: The
1role of normal stress
23
Nir Badt1, Yossef H. Hatzor1, Renaud Toussaint2 and Amir Sagy3* 4
1. Department of Geological and Environmental Science, Ben-Gurion University of the Negev, Beer Sheva 5
84105, Israel 6
2. Institut de physique du globe de Strasbourg, 5, rue René Descartes - F-67084 Strasbourg cedex 7
3. Geological Survey of Israel, 30 Malkhe Israel, Jerusalem 95501, Israel 8
*Corresponding author: [email protected] 9 10 11 12 13 14 15 16
Keywords: roughness evolution, fault geometry, direct shear, mechanical work, wear, surface 17
roughness 18
*Manuscript
2
Abstract
19
We study the evolution of slip surface topography using direct shear tests of perfectly mating 20
surfaces. The tests are performed under imposed constant normal stress and constant slip rate 21
conditions, to a sliding distance comparable to the roughness scale of the studied surfaces. 22
Prismatic limestone blocks are fractured in tension using four-point bending and the generated 23
surface topographies are measured using a laser profilometer. The initially rough fracture interfaces 24
are tested in direct shear while ensuring a perfectly mating configuration at the beginning of each 25
test. The predetermined sliding distance in all tests is 10 mm and the sliding velocity is 0.05 mm/s. 26
A constant normal stress is maintained throughout the tests using closed loop servo control. The 27
range of normal stresses applied is between 2 MPa and 15 MPa. After shearing, the surface 28
topographies are re-scanned and the geometrical evolution is analyzed. We find that surface 29
roughness increases with increasing normal stress: under normal stresses below 5 MPa the surfaces 30
become smoother compared to the original geometry, whereas under normal stresses between 7.5 31
MPa and 15 MPa the surfaces clearly become rougher following shear. Statistical spectral analyses 32
of the roughness profiles indicate that roughness increases with length-scale. Power spectral 33
density values parallel to the slip orientation are fitted by power-law with typical power value of 34
2.6, corresponding to a Hurst exponent of 0.8, assuming self-affine roughness. This power value is 35
consistent for the post-sheared surfaces and is obtained even when the original surface roughness 36
does not follow initially a power-law form. The value of the scaling-law prefactor however increases 37
with increasing normal stress. We find that the deformation associated with shearing initially rough 38
interlocked surfaces extends beyond the immediate tested surface, further into the intact rock 39
material. The intensity of the damage and its spatial distribution clearly increase with increasing 40
normal stress. Wear loss is measured by subtracting the post-shear surface from the pre-shear 41
surface matrices using known reference points. Our measurements indicate that wear loss and 42
3
roughness evolution are both positively correlated with the mechanical shear work applied during 43
the experiments. We argue, therefore, that normal stress plays a significant role in the evolution of 44
interlocked surfaces, such as geological faults, and strongly affects the energy partitioning during 45
slip. 46
4
1. Introduction
48
Faults in the upper crust are characterized by complex zones of deformed rock that shear during 49
repeated faulting events (Chester & Logan., 1986; Ben-Zion & Sammis, 2003; Wibberley et al., 2008; 50
Faulkner et al., 2010). Most of the displacement along faults is localized at principal slip surfaces 51
exhibiting geometrical irregularity at all measurable scales (Power et al., 1988; Siman-Tov et al., 52
2013; Candela et al., 2012) and as in other material interfaces the roughness is critical to the 53
understanding of shear and frictional processes (e.g. Bowden & Tabor, 1950; Dieterich & Kilgore; 54
1994). The presence of gouge and cataclasite zones in natural faults indicates that the fault surface 55
itself evolves through wear production (Power et al., 1988; Wang & Scholz, 1994). In each slip event 56
wear is generated and the initial geometry of the slip surface is continuously modified, a process 57
that has been referred to as “roughness evolution” (Sagy et al., 2007). 58
Previous roughness evolution studies in the field by means of geometrical measurements of natural 59
fault surfaces suggest that faults smooth with accumulated slip. Wesnousky (1988) observed strike-60
slip fault traces at geological map scales and discovered that the number of steps along the trace 61
reduces with increased offset on the faults. By comparing profiles along slip surfaces that 62
accommodated dozens to hundreds of meters of displacement to these which sheared less than a 63
meter, Sagy et al. (2007) concluded that roughness parallel to slip orientation reduced due to slip at 64
all measured scales. Brodsky et al. (2011) increased the sampling population and demonstrated that 65
roughness of profiles at lengths of 0.5 to 1 m decreased very gradually as function of the slip 66
amount. Bistacchi et al. (2011) studied paleo-seismic fault surfaces exhumed from seismogenic 67
depths and demonstrated that similar geometrical evolution occurs at these depths. 68
Surface roughness of fractures was intensively investigated in laboratory experiments as an integral 69
component of contact and shear mechanics (e.g. Bowden & Tabor, 1950; Archard, 1953). Many 70
pioneering works in rock mechanics investigated roughness of faults and fractures in relation to 71
5
mechanical strength and shear resistance (Patton, 1966; Barton, 1976; Byerlee, 1978). In the last 72
decades, quantitative statistical analysis methods to describe surface geometry were proposed (e.g. 73
Mandelbrot, 1983; Bouchaud et al., 1990; Grasselli et al., 2002) and some were applied to describe 74
rock discontinuities. Amitrano & Schmittbuhl (2002) for example measured the geometry of shear 75
fractures formed by triaxial shear tests and suggested that they exhibited self-affine power-law 76
geometry with Hurst exponents H of 0.8 and 0.74 for profiles normal and parallel to the slip 77
direction, respectively. Results obtained with rotary shear tests demonstrated slip rate effects on 78
surface roughness (Fondriest et al., 2013; Boneh et al. 2014; Siman-Tov et al., 2015). These studies 79
focused solely on the roughness characteristics after slip and therefore the actual roughness 80
evolution through shear remained unresolved. 81
Roughness evolution studies require measuring the surface geometry before and after shear 82
displacement. Renard et al. (2012) slid smooth halite surfaces on a coarse sandpaper substrate 83
under constant normal stress and characterized the roughness exponent evolution. Davidesko et al. 84
(2014) demonstrated that when shearing under relatively low normal stress (2 MPa) surface 85
roughness decreased with displacement; they sheared initially rough tensile fracture surfaces 86
produced by three-point bending to increasing slip distances, up to 15 mm. 87
Normal stress is fundamental in the theory of friction and wear (Bowden & Tabor, 1950; Archard, 88
1953; Byerlee, 1978) and therefore it is reasonable to assume that it also strongly affects damage 89
and deformation in natural faults which typically yield under tectonic stresses of significant 90
magnitudes. In the present study the effect of normal stress on roughness evolution of rock 91
surfaces is examined by means of direct shear experiments coupled with laser profilometer 92
measurements before and after shear. The advantage of the combined mechanical-tribological 93
methodology adopted here is that multi-scale mating surfaces are sheared relative to each other as 94
in natural faults, and are mapped with high precision. Moreover, the direct shear system used here 95
6
allows great control and measuring capabilities during shear displacement. The acquired roughness 96
data is examined both statistically, using spectral analyses, and morphologically, using cross-97
sections and height maps of the surfaces. 98
2. Experimental Procedure
99The experiments consist of several consequent stages: 1) rough tensile surfaces are created using 100
four point bending; 2) both surfaces are scanned with a laser profilometer; 3) direct shear 101
experiments under constant normal stress to target displacement of 10 mm are performed while 102
ensuring the sheared surfaces are perfectly mating ; 4) re-scanning of both surfaces; 5) roughness 103
analysis. 104
The experimental surfaces are generated from prismatic limestone beams. The starting material is a 105
fine-grained limestone with an average grain diameter of ~0.4 mm known locally as “Hebron 106
Marble”. The elastic parameters of the intact rock are Young’s modulus of 57 GPa and Poisson’s 107
ratio of 0.29 (Davidesko, 2013). 108
The four-point bending tests utilized the direct shear system with the shear load frame removed 109
and the normal piston used to deliver the axial load (Fig.1a). A vertical notch approximately 5 cm 110
long was pre-cut to direct the propagation direction of the induced tensile fracture (see Fig. 1a). 111
The produced surfaces were typically 8 cm wide and approximately 11 cm long. 112
The uniqueness of the generated surfaces in this procedure is that the roughness of one surface 113
matches exactly the roughness of the other, thus enabling the surfaces to slide relative to one 114
another from a completely mating configuration. Furthermore, the roughness of each set (two 115
mating surfaces) is neither predetermined nor reproducible, which better simulates natural fault 116
surfaces. The experimental fault surfaces in the present study, therefore, differ substantially from 117
7
the usual surfaces used in friction studies, because they allow examining of a multi-scale asperity 118
interlocking contact (Fig.2). 119
The experimental fault surfaces are sheared in a hydraulic, servo-controlled, direct-shear system 120
(Fig.1c) to a constant distance of 10 mm at a rate of 0.05 mm/s, under imposed constant normal 121
stress so that the tested interface is allowed to dilate vertically during shear. Normal load is 122
delivered from the axial piston which connects to the top of the shear load frame using a centering 123
pin. The lower shear box rolls on frictionless rollers that are placed between the shear box and the 124
base platen (Fig.1d). 125
The fractured interfaces are cast in the shear boxes using cement in a completely mating 126
configuration so that when initially loaded the interlocking contacts are fully preserved. The shear 127
boxes are placed in the shear load frame which is connected to the horizontal shear piston (Fig.1c). 128
Six linear variable displacement transducers (LVDTs) are attached to metal plates on both flanks of 129
the steel frames (Fig.1d); four vertical transducers are used to measure dilation during shear, and 130
two horizontal transducers are used to measure shear displacement. The LVDTs monitor the 131
displacements very close to the sliding interface, thus allowing excellent control capabilities during 132
testing because the shear displacement feedback to the closed-loop system is obtained from the 133
outputs of the two horizontal shear transducers. 134
The before and after topography of the tested interfaces is obtained by means of laser profilometer 135
(Fig.1b) and the data are used for roughness analysis. Both top and bottom surfaces are scanned 136
before and after shear. Prior to scanning, the surfaces are cleaned of dust and moisture. Wear 137
particles are removed from the post-shear surfaces using a soft brush and air pressure. The scans 138
are performed parallel to the direction of shear (longitudinal direction of the samples) using a 75 139
mm lens with a sampling frequency of 0.02 mm-1 and 34.34 mm-1 in the longitudinal and transverse 140
directions, respectively. The scans are used to map the entire surface in four parallel strips from 141
8
which roughness analysis is performed. By comparing the results to higher resolution 142
measurements in the same samples it is concluded that the accuracy of the measurements is robust 143
in our samples for detecting power spectral density values for wavelengths above 0.2 mm. All pre-144
shear scans had post-shear counterpart scans that covered the same area for later roughness 145
comparison. The acquired scans data are presented using surface matrices of heights. 146
147 148
Figure 1. Experimental methods in use: (a) Prismatic limestone beam in four-point bending
149
configuration, the length of the beam is 50 cm long. (b) Profilometer scanning a surface, note that
150
the surface is fixed to a steel shear box which links the sample to the direct shear system. (c) The
151
direct shear system: the normal piston (delineated by n arrow) and the shear piston and load
152
frame (delineated by s arrow). (d) Side view of the shear load frame with the vertical and
153
horizontal LVDTs (delineated by v and h arrows, respectively).
154 155 156
Figure 2. Schematic illustration of tested surface configuration in typical rock friction and wear
157
experiments (top) and the multi-scale, interlocking roughness in the present study (bottom).
158
3. Mechanical Results
159The mechanical results obtained from six direct shear experiments conducted in the present study 160
and data from one experiment conducted by Davidesko et al. (2014) are presented in Table 1 161
(Supplementary Material). All tests were sheared to a constant displacement of 10 mm at a rate of 162
0.05 mm/s under constant normal stress conditions. During shear displacement, the sliding 163
interface was allowed to dilate under the imposed normal stress; an example of a typical stress-164
Figure 1
Figure 2
9
displacement curve is shown in Figure 3. The results shown in Table 1 include measured shear 165
stress (τ) and normal stress (σn), calculated shear resistance (τ/σn), and calculated stress-drop (∆τ)
166
results. Shear resistance, as used here, is the value of the measured shear stress divided by the 167
applied normal stress at any particular instance. Stress-drop refers to the change in shear stress 168
from peak to minimum residual stress. It should be noted that while peak shear stress was clearly 169
exhibited in all tests, a constant residual shear stress, elsewhere referred to as “steady state” (e.g. 170
Dieterich & Kilgore, 1994) was never reached for the pre-specified target displacement of 10 mm. 171
We therefore use the tail of the shear stress – shear displacement curve to assign a residual shear 172
stress value for each test, thus obtaining the calculated stress-drop values reported in Table 1. 173
Peak shear resistance was typically reached after a few millimeters (2-6) of displacement for each 174
experiment (Fig.3a). Until that stage, the rough surfaces exhibited slip-hardening behavior 175
(Ohnaka, 2003) attributed to elastic deformation and yield of asperities before peak shear stress is 176
attained. As can be readily observed from inspection of figure 3b, this stage was coupled with 177
complex dilatational behavior, typically beginning with interface closure followed by interface 178
opening, before peak shear stress is reached. 179
Maximum values of shear resistance did not correlated with the imposed normal stress in our 180
experiments. The maximum shear resistance in the present study (τ/ σn =1.25) was obtained in an
181
experiment performed by Davidesko et al. (2014), which was performed under the lowest level of 182
normal stress in this suite of tests, σn = 2 MPa. The minimum shear resistance (τ/ σn = 0.661) was
183
measured in experiment LN6 performed under normal stress of σn = 10 MPa. This experiment is
184
different from the rest because a precursory slip event occurred before peak stress was attained. 185
The same phenomenon also occurred in experiment LN7 (σn = 15 MPa) where a significant
stress-186
drop (~0.54 MPa) was registered before peak strength was attained. These precursory stress-drop 187
events smoothed the stress-displacement curve, most likely dissipating some of the stored elastic 188
10
energy prior to peak stress and consequent plastic yield of the tested interfaces. Due to the initially 189
rough geometry of the surfaces, these precursory, uncontrolled events came as no surprise. 190
191 192 193
Figure 3. (a) Shear stress – shear displacement curves for all experiments. (b) Experiment LN11,
194
sheared under a normal stress of 12.5 MPa. Shear stress denoted by the black curve. The colored
195
curves depict the dilation-displacement curves of all four vertical LVDTs (labeled Xa-Xd) and the
196
average dilation (red curve). Note that here dilation is positive and contraction is negative.
197
Schematic illustration of LVDT layout (horizontal, labeled Ya-Yb, and vertical, labeled Xa-Xd)
198
presented in inset, shear direction marked by arrow.
199
4. Geometrical Evolution
200Roughness topography of sheared surfaces typically evolves through wear production (Power et al., 201
1988; Wang & Scholz, 1994; Brodsky et al., 2011). Here we first present direct observations of 202
geometrical variations followed by the statistical analysis of surface roughness. To prevent edge 203
effects due to irregular fracturing at the edges of the studied surfaces roughness analysis was 204
performed on selected zones in the center of the samples, few to dozens of centimeters long and 205
few centimeters wide. The geometrical analyses, therefore, represent these zones on the samples 206
only. The product for any given sample is a topographical map (expressed as a matrix) of any 207
particular domain before and after shear. Figure 4 displays topographical maps of surfaces before 208
and after slip, obtained from two different experiments. Both surfaces evolved through shear, but 209
under normal stress of σn = 5 MPa (Fig. 4a-b) the surface smoothed whereas under normal stress of
210
12.5 MPa (Fig. 4c) the surface roughened. Similar roughening is also clearly observed in other 211
Figure 3
11
surface maps of samples sheared under 7.5 and 15 MPa (See supplementary material). The 212
topographical variations are demonstrated along two profiles parallel to the slip direction (Fig. 213
4b,d). It appears that the profiles in Figure 4b suggest that under normal stress of 5 MPa the 214
surfaces smoothed, most likely through asperity decapitation (Wang & Scholz, 1994), which 215
decreased the overall roughness of the surface (see also Davidesko et al., 2014). 216
In contrast to the smoothing mechanism observed up to normal stress of 5 MPa, the clearly 217
observed surface roughening under higher normal stresses is novel and not trivial to explain. We 218
believe that because the surfaces are initially rough and perfectly mating (Fig.2) under higher 219
normal stresses shear must be associated with significant penetrative damage. This process is best 220
understood when the sheared surface morphology is carefully examined. Figure 5 presents the 221
surface of the sample that was sheared under normal stress of 12.5 MPa. Three main features can 222
be identified across the surface. First, there are undamaged zones where the original texture is 223
exposed. Other parts of the surface are covered by smooth grooves oriented in the slip direction, 224
similar to slip striations observed on natural faults. The third distinctive features are fractures that 225
penetrate the edges of the shear interface to a depth of a few millimeters. These fractures (Fig. 5b) 226
resemble Riedel shears and tensile fractures which typically develop along natural faults (Tchalenko, 227
1968; De Paola et al., 2008). Consider that in a given sample the fracture intensity varies across the 228
surface, with increasing density and penetration depth near geometrical irregularities. We find that 229
such penetrative damage is much more significant in surfaces sheared under relatively higher 230
normal stresses. Nonetheless, islands of striated polished zones (Fig. 5 a,c) suggest simultaneous 231
localization processes. 232
233
Figure 4. Geometrical evolution of surfaces sheared under a normal stress of 5 MPa (a-b) and 12.5
234
MPa (c-d). (a,c) pre-shear (top) and post-shear (bottom) matrices for a surfaces sheared under
12
σn=5 MPa and σn=12.5 MPa, respectively. (b,d) selected profiles in direction parallel to shear 236
(shear direction is to the left) for a surface sheared under σn=5 MPa and σn=12.5 MPa, 237
respectively. The pre and post shear surfaces are depicted by blue and red curves, respectively.
238
The matrices cover an area of 25×14.56 mm2 and 69.9×14.56 mm2 for the surface sheared under
239
5 MPa (a) and the surface sheared under 12.5 MPa (c), respectively.
240 241
Figure 5. Picture of a surface sheared under 12.5 MPa (a). Three different zones are identified;
242
undamaged zones exhibiting the original texture of the rock, penetrative damage, exhibiting
243
multiple fracture traces (b), and scattered zones of fine white gouge with slip-striations. Some of
244
these contain highly polished patches (c).
245 246
Statistical description of roughness evolution is performed using power spectral density (PSD) 247
analysis, which provides quantitative roughness values and variations as a function of length scale. 248
The analyses are performed on both pre - and post - shear matrices that contain the selected 249
damage zones, on profiles parallel to the slip direction. The analysis follows a procedure introduced 250
previously (Sagy & Brodsky, 2009; Brodsky et al., 2011; Candela et al., 2012; Davidesko et al., 2014); 251
namely, any profile is de-trended and the discrete Fourier transform is calculated. The power is the 252
square of the amplitudes of the coefficients and the PSD is the power spectrum normalized by the 253
profile length. The PSD value, presented here for any given wavelength (Fig. 6), is averaged from 254
the values calculated from several hundred profiles. 255
Figure 6 presents power spectral densities as function of the length scale of experimental surfaces 256
before (blue curves) and after (red curves) 10 mm of shear displacement under various normal 257
stress levels. Interestingly, the initial roughness in part of the samples does not fit well one power-258
Figure 4
Figure 5
13
law and at relatively short wavelengths becomes moderate when compared to longer wavelengths 259
(Fig. 6). However, the post-shear PSD curves closely fit a power of 2.6, or H=0.8 (black lines). 260
Figure 6 also shows that when the surfaces are sheared under normal stresses greater than 5 MPa 261
the PSD increases at all measurable scales. The increase in PSD values corresponds to a mean 262
increase in roughness for all the profiles that make up the surface at the specified wavelength. This 263
behavior is clearly depicted in figure 7 where the PSD post to pre shear ratios are plotted as a 264
function of the tested wavelength (final PSD(λ)/initial PSD(λ)). There is a distinct separation 265
between samples sheared under normal stress levels greater than 5 MPa, all of which exhibit 266
roughness ratios greater than 1 (roughening), and samples sheared under equal or lower normal 267
stress levels than 5 MPa, all of which exhibit roughness ratios smaller than 1 (smoothing). The 268
above observations (Figs.4-7) suggest that penetrative brittle fracturing is enhanced with 269
increasing normal stress. During shear sliding, fragmentation occurs in and near the fractured zone 270
and consequently rock fragments are detached from the host rock. Measurements of the surface 271
irregularities indicate that roughness evolution reflects this wear mechanism. 272
273
Figure 6. Power spectral density roughness before (blue curves) and after (red curves) 10 mm
274
shear under varying normal stresses. The slope in this bilogarithmic plot is of 2.6,
275
corresponding to a Hurst exponent: H = (β -1)/2=0.8.
276 277
Figure 7. Roughness evolution (PSD Ratio) as a function of wavelength for surfaces sheared under
278
constant normal stress.
Figure 6
Figure 7
14
5. Discussion
280
5.1 Geometrical-Mechanical Interactions
281
While this study focuses on roughness evolution, wear loss due to shear is a natural by-product of 282
the geometrical evolution and is therefore examined as well. Wear loss is measured by subtracting 283
the post-shear matrices from the pre-shear matrices, thus delineating the zones that experienced 284
significant damage in the resulting height-difference matrix, referred to here as the “damage 285
matrix” (Fig.8). Such height subtraction was possible because some parts of the post-shear surface 286
remained intact and could therefore be used as a reference for “zeroing” the two matrices. 287
Quantitative wear analysis is done by calculating the height difference between each compatible 288
point in the pre- and post-shear matrices. Each point in the damage matrices represents a unit cell 289
area of 0.1×0.0291 mm2, corresponding to the resolution of the scan in both transverse and 290
longitudinal directions, so that for each cell area we could calculate the wear volume at good 291
approximation. A threshold height difference is set to 0.5 mm in order to minimize height 292
difference incompatibility of the pre- and post-shear matrices. The wear volume is normalized by 293
the area of the whole damage matrix (or damage zone) as follows: 294
(1)
295
Where Vij is the total wear volume obtained from all the unit cells in the matrix (above threshold
296
value), n is the total number of cells in the entire matrix that entail a height difference value greater 297
than the set threshold, and A is the unit cell area. The calculated wear volume is normalized by the 298
area of the sampled zone. Combining measurements from both mated surfaces in a given 299
experiment provides the average wear, expressed here in terms of total wear loss volume per 300
damage area (Fig. 9a). The main parameter that changed between experiments was the normal 301
15
stress, but because the initial roughness of our samples although similar, was not identical, we plot 302
the wear loss against the total mechanical shear work spent during the shearing process (Fig.9), 303
thus integrating the effects of normal stress, surface geometry, and material properties. The shear 304
work due to shear sliding is obtained directly from the shear stress - shear displacement curves (e.g. 305 Fig. 3): 306 (2)
where Wt is the spent shear work during sliding to a pre-specified target distance of 10 mm, τ is the
307
shear stress and du is the displacement interval. 308
The relationships between mechanical shear work (normalized to the surface area) and wear loss, 309
normal stress and roughness ratio are plotted in figure 9. The roughness ratio is defined as the 310
value of the PSD ratio along the range of 1mm to 1cm. As would be intuitively expected, shear 311
induced wear generation and surface roughening are energy sinks, which require increasing 312
amounts of mechanical energy to be provided by the loading system. 313
314
Figure 3. Damage matrices for surfaces that were sheared under 5 MPa (top) and 12.5 MPa
315
(bottom). The matrices depict zones that underwent significant damage (red areas) and
316
undamaged zones (blue areas) that were used as reference for “zeroing” the pre and post shear
317
matrices.
318 319
Figure 9. Wear loss and roughness ratio presented against the total shear work. The average
320
width of the wear volume in any given sample is presented in Fig. 9a. Red dots represent values
321
calculated using measurements from both mating surfaces, while the grey diamond represents a
Figure 8
Figure 9
16
value obtained from a single surface and multiplied by two. PSD ratio and normal stress values
323
are presented in Fig. 9b. The error bars (right) depict one standard deviation.
324
5.2 Roughness evolution
325
The PSD analyses performed on the experimental slip surfaces portray the geometrical modification 326
of the surfaces through shear. The overall picture suggests that surface roughness increases 327
through shear under relatively high normal stresses (≥7.5 MPa) and decreases under relatively low 328
stresses (≤5 MPa). Previous experimental observations demonstrated that surface roughness 329
smooths as function of slip distance (Davidesko et al., 2014). In those experiments, surface 330
roughness of tensile fracture were fitted well by a similar power-law, before and after shear, 331
suggesting that when constant normal stress is applied during shear displacement the power 332
spectral density of the surface can be described by: 333
(3)
Where is the slope of the PSD lines (in logarithmic space) and k(d) is the slip dependent coefficient
334
of the smoothing process. It is demonstrated here that when the displacement is fixed and the 335
normal stress is variable, the PSD can be described by: 336
(4)
where k(N) is the normal stress dependent coefficient of the roughening process. The prefactor k is
337
therefore the parameter that chiefly varies during our shear experiments. Interestingly, computer 338
simulations demonstrated that the prefactor of the self-affine surface roughness is the main 339
component of roughness that affects energy dissipation during faulting (Newman & Griffith, 2014). 340
On the other hand, In most sheared surfaces of both sets of experiments, the power exhibits a 341
typical value of 2.6, in direction of slip along the measured scales, which in self-affine surfaces 342
corresponds to a roughness (or Hurst) exponent of H=0.8, as measured in previous studies 343
17
(Bouchaud, 1997), where (Barabasi & Stanley, 1995). It is therefore suggested that this 344
roughness exponent might represent a more general multiscale self-affine roughness as suggested 345
previously both for tensile and shear fractures (e.g. Bouchaud et al., 1990; Amitrano and 346
Schmittbuhl, 2002; Renard et al., 2006). 347
Examination of the experimental surfaces more locally reveals that the tested surfaces undergo 348
smoothing and roughening at different localities (Figure 10a). The pre- and post-shear curves 349
display an overall increase in surface roughness; however, when different zones in the same post-350
shear surface matrix are examined areas of different roughness are evident. The rough zone 351
(magenta colored curve) exhibits the maximum PSD values for each wavelength. In contrast, the 352
smooth zone showing striations with no intensive penetrative damage, exhibits PSD values that are 353
much closer to the initial values before slip has occurred. When two PSD functions with equal 354
power (β=2.6) but different prefactor values are plotted along with the surface data, it can be 355
concluded that while some variations in the power exist in the data, the predominant change in 356
roughness is manifested mathematically as an increase or decrease in the prefactor (k) value. 357
Following our observation that the prefactor is normal-stress-dependent, and its value increases 358
with normal stress (Figs. 6-7), we conclude that the same process also occurs locally. The striation 359
zones have presumably experienced a lower local normal stress than the rough ones. These local 360
variations of the normal stress are mostly influenced by the initial geometry of the fault, as evident 361
by direct observations (Fig. 5) and suggested by models of stress distribution near rough fault 362
surfaces (Chester & Chester, 2000; Sagy & Brodsky, 2009; Griffith et al., 2010). We thus conclude 363
that initial roughness strongly influences post slip damage intensity and surface geometry. 364
Figures 6 and 10a also demonstrate that at short length scales (< 1mm) some of the initial tensile 365
fracture surfaces display a kink in the PSD values. Examination of thin sections reveals that the 366
average grain size of the tested rock before shear is 0.4 mm, and therefore the bend in the PSD 367
18
values is best interpreted as associated with the typical grain scale of the samples (~ 1- 0.1 mm). 368
Such small-scale cutoff is commonly observed in tensile fractures for numerous materials 369
(Bouchaud, 1997). Interestingly, this cutoff remains in post-shear PSD curves for the surface 370
sheared under 2 MPa (Fig. 6), but diminishes in surfaces sheared under higher normal stresses (Figs. 371
6, 10a). Figure 10b presents the most extreme case of deviation of initial roughness from a power-372
law. The plot includes measurements from the high resolution lens of 50 mm, which enlarges the 373
scanning resolution down to less than 0.05 mm. The kink in the pre-shearing roughness is reduced 374
in the post-shear roughness and “moves” around smaller wavelength. This is attributed to higher 375
efficiency of fragmentation in the grain scale during shear, as the grains themselves are fractured. 376
The typical grain size in the gouge becomes smaller as shear progresses, as observed in figure 5 and 377
discussed by Amitrano & Schmittbuhl (2002). 378
379
Figure 10. (a) PSD curves for different zones of unequal roughness for a surface sheared under
380
12.5 MPa. The pre and post shear curves refer to the whole surface before and after shear,
381
respectively. The rough and striation zone curves refer to two distinct zones in the post-shear
382
surface that underwent roughening and smoothing, respectively. The two black solid lines are
383
upper and lower bounds to the data featuring different values of k. (b) Power spectrum curves for
384
a surface sheared under 15 MPa. Note the cross-over between the pre shear (blue) and post
385
shear (red) curves around a wavelength of 0.4 mm.
386 387
5.3 Applications for natural faulting
388
The initial setup presented here is of a tensile fracture that is reactivated by shear. Such a slip mode 389
is common in natural environments (Segall & Pollard, 1983; Martel et al., 1988; Di Toro & 390
Pennacchioni, 2004). Moreover, field and experimental observations as well as theoretical analyses 391
Figure 10
19
demonstrate that the initial inelastic deformation of brittle rocks, even under compression, usually 392
includes tensile mode fracturing, while shear occurs only when these fractures interact (Segall & 393
Pollard, 1983; Ashby & Sammis, 1990; Reches & Lockner, 1994). More broadly, one can interpret 394
the presented configuration as a simplification of the shear of a multiscale interlocked rough fault, 395
as is the case for faults along the entire range of length scales. At large scales, even mature faults 396
can express significant roughness (Wang & Bilek, 2011). 397
Friction experiments under constant loading conditions display in some configurations strain 398
hardening and strain weakening stages, followed by low resistance to shear (e.g. Ohnaka, 2003). 399
Considering previous (Davidesko et al., 2014) and current results we suggest that the evolution of 400
roughness in sheared interlocked surfaces exhibits a roughening stage during strain hardening while 401
gradual localization and smoothing occurs during strain, or slip, weakening. Our samples which 402
contained initially rough surfaces never experienced the entire transient stage because the 403
displacement length required for crossing the entire transient stage is strongly dependent upon the 404
initial roughness and the normal stress (Queener et al., 1965; Wang & Scholz., 1994). Figure 10b 405
demonstrates surface roughness in an experiment that was terminated during the slip weakening 406
stage after 10 mm of slip. Although in average the surface roughened, smooth striated zones were 407
observed (Fig. 5) indicating that some localization had already occurred. We therefore suggest that 408
our experiments best simulate the deformation of a fault patch with roughness larger or 409
comparable to the slip displacement of the event. 410
Contrary to this, many experimental works adopted the shearing of relatively smooth surfaces in 411
order to study the friction properties of rocks. Unsurprisingly, the transient stage in these 412
experiments is relatively short. Beyond this stage, under constant applied velocity and normal 413
stress, roughness, wear rate and resistance to shear remain statistically stable, (Archard, 1953; 414
Boneh et al., 2014; Lyakhovsky et al., 2014). We therefore assume that these experiments best
20
simulate fault patches which absorbed slip amounts larger than their length. We also note that slip 416
velocity and normal stress further affect surface roughness at this stage (Boneh et al., 2013; Chen et 417
al., 2013; Fondriest et al., 2013; Siman-Tov et al., 2015). 418
Finally, natural fault roughness values decrease with net slip (Sagy et al., 2007; Bistacchi et al. 419
2011), albeit very gradually (Brodsky et al., 2011). Normal stress variations, as presented here, 420
could be important to this evolution. Roughness and wear loss in the present testing configuration 421
evolve throughout brittle damage and increase with the mechanical shear work (Fig. 9). Following 422
these results and previous theoretical analysis (Newman & Griffith., 2014) we speculate that the 423
energy dissipation during natural slip is affected both by the level of normal stress and by the initial 424
fault surface roughness. Further experimental and theoretical research focused on the transient 425
wear stage is necessary for better simulating dissipation and partitioning of energy during 426
earthquake. 427
428
6. Summary and conclusions
429Our experimental configuration in which the surfaces are: a) initially rough, b) include multiscale 430
geometrical irregularities, c) initially interlocked, and d) sheared to distances that are comparable 431
to the roughness amplitude of the surface, is well suited to simulate natural faulting. Such a testing 432
configuration has never been attempted in previous experimental shear and roughness evolution 433
studies. While it is generally assumed that shearing surfaces one against the other is closely 434
associated with polishing and smoothing of surface asperities, we find that deformation associated 435
with shearing extends beyond the immediate zone of the asperities and that this deformation 436
becomes more intensive with increasing normal stress. We demonstrate here that roughness 437
evolution is a complex mechanism that consists of simultaneous roughening and smoothing in a 438
21
given surface. Roughening occurs as part of damage development during strain hardening stage 439
while gradual localization and smoothing occur during strain weakening. Under constant stress, the 440
final roughness value depends on the slip amount (Davidesko et al., 2014). When the slip distance 441
and the loading velocity are constant, the surface becomes rougher with increasing normal stress. 442
Consequently, the roughness of the surface after shear can be higher than the initial roughness, an 443
experimental finding never reported before. 444
We show that roughness, as function of measured wavelength, fits a power-law with power value 445
of β~2.6, or Hurst exponent of H~0.8, assuming characteristic self-affine topography parallel to the 446
slip direction (Figs. 6 and 10). Interestingly, this power is stable in the sheared surfaces even when 447
the initial roughness does not fit a power-law, indicating that this characteristic roughness is an 448
attractor for the morphology developed under brittle shear. Therefore, continuous shear can 449
enlarge the range of length scales which statistically obey power-law roughness. The final 450
roughness of the surface, which depends on the initial geometry, the level of normal stress, and the 451
imposed sliding distance, is expressed by the evolution of the scaling-law prefactor. This value 452
increases with normal stress but decreases with continuous slip. 453
454
Acknowledgements 455
We thank Telemaco Tesei and W. Ashley Griffith for their insightful comments and constructive 456
review which helped improve this manuscript. This study is funded by Israel Science Foundation 457
grant No. 929/10 and by USIAS Fellowship, University of Strasbourg. 458
459
7. References
460Amitrano, D., & Schmittbuhl, J. (2002). Fracture roughness and gouge distribution of a granite shear band. 461
Journal of Geophysical Research, 107(B12), 1978–2012, doi:10.1029/2002JB001761. 462
22
Archard, J. F. (1953). Contact and rubbing of flat surfaces. Journal of Applied Physics, 24, 8, 981-988. 463
Ashby, M. F., and C. G. Sammis (1990), The damage mechanics of brittle solids in compression, Pure and 464
applied geophysics, 133, 489 – 521. 465
Barabási, A.-L., & Stanley, H.E. (1995). Fractal concepts in surface growth. Cambridge University Press. 466
Barton, N. (1976). Rock Mechanics Review: The Shear Strength of Rock and Rock Joints. International Journal 467
of Rock Mechanics, Mining Science and Geomechanics Abstracts, 13, 255-279. 468
Ben-Zion, Y., & Sammis, C. G. (2003). Characterization of fault zones. Pure and Applied Geophysics, 160(3-4), 469
677-715. 470
Bistacchi, A., Griffith, W. A., Smith, S. A., Di Toro, G., Jones, R., & Nielsen, S. (2011). Fault roughness at 471
seismogenic depths from LIDAR and photogrammetric analysis. Pure and applied geophysics, 472
168(12), 2345-2363. 473
Boneh, Y., Sagy, A., & Reches, Z. (2013). Frictional strength and wear-rate of carbonate faults during high-474
velocity, steady-state sliding. Earth and Planetary Science Letters, 381, 127-137. 475
Boneh, Y., Chang, J., Lockner, D. A., and Reches, Z. (2014). Fault Evolution by Transient Processes of Wear 476
and Friction. Pure and Applied Geophysics, Vol. 171, Issue 11, 3125-3141. 477
Bouchaud, E., Lapasset, G., & Planès, J. (1990). Fractal dimension of fractured surfaces: a universal value? 478
Europhysics Letters, 13(1), 73. 479
Bouchaud, E. (1997). Scaling properties of cracks. Journal of Physics: Condensed Matter, 9(21), 4319. 480
Bowden, F. P. and Tabor, D. (1950). The Friction and Lubrication of Solids. Oxford: Oxford University Press. 481
Brodsky, E. E., Gilchrist, J. J., Sagy, A., & Collettini, C. (2011). Faults smooth gradually as a function of slip. 482
Earth and Planetary Science Letters, 302, 185-193. 483
Byerlee, J. (1978). Friction of Rocks. Pure and Applied Geophysics, 116, 615-626. 484
Candela, T., Renard, F., Klinger, Y., Mair, K., Schmittbuhl, J., & Brodsky, E. E. (2012). Roughness of fault 485
surface over nine decade of length scales. Journal of Geophysical Research 117(B8). 486
Chen, X., Madden, A. S., Bickmore, B. R., & Reches, Z. E. (2013). Dynamic weakening by nanoscale smoothing 487
during high-velocity fault slip. Geology, 41(7), 739-742. 488
23
Chester, F. M., & Logan, J. M. (1986). Implications for mechanical properties of brittle faults from 489
observations of the Punchbowl fault zone, California. Pure and Applied Geophysics, 124, 79-106. 490
Chester, F. M., & Chester, J. S. (2000). Stress and deformation along wavy frictional faults. Journal of 491
Geophysical Research, 105(B10), 23421-23430. 492
Davidesko, G. (2013). Evolution of Surface Roughness Through Shear, M.Sc. Thesis. Beer-Sheva, Israel: Ben-493
Gurion University of the Negev. 494
Davidesko, G., Sagy, A., & Hatzor, Y. H. (2014). Evolution of slip surface roughness through shear. 495
Geophysical Research Letters, 41(5), 1492-1498. 496
De Paola, N., Collettini, C., Faulkner, D. R., & Trippetta, F. (2008). Fault zone architecture and deformation 497
processes within evaporitic rocks in the upper crust. Tectonics, 27(4). 498
Dieterich, J. H., & Kilgore, B. D. (1994). Direct observation of frictional contacts: New insights for state-499
dependent properties. Pure and Applied Geophysics, 143(1-3), 283-302. 500
Di Toro, G., & Pennacchioni, G. (2005). Fault plane processes and mesoscopic structure of a strong-type 501
seismogenic fault in tonalites (Adamello batholith, Southern Alps). Tectonophysics, 402(1), 55-80. 502
Faulkner, D. R., Jackson, C. A. L., Lunn, R. J., Schlische, R. W., Shipton, Z. K., Wibberley, C. A. J., & Withjack, M. 503
O. (2010). A review of recent developments concerning the structure, mechanics and fluid flow 504
properties of fault zones. Journal of Structural Geology, 32(11), 1557-1575. 505
Fondriest, M., Smith, S. A., Candela, T., Nielsen, S. B., Mair, K., & Di Toro, G. (2013). Mirror-like faults and 506
power dissipation during earthquakes. Geology, 41(11), 1175-1178. 507
Griffith, W. A., S. Nielsen, G. Di Toro, and S. A. Smith (2010), Rough faults, distributed weakening, and off-508
fault deformation, Journal of Geophysical Research, 115, B08409, doi:10.1029/2009JB006925. 509
Grasselli, G., J. Wirth, and P. Egger (2002). Quantitative three-dimensional description of a rough surface and 510
parameter evolution with shearing. International Journal of Rock Mechanics and Mining Sciences 511
39.6: 789-800. 512
Lyakhovsky, V., Sagy, A., Boneh, Y., & Reches, Z. (2014). Fault wear by damage evolution during steady-state 513
slip. Pure and Applied Geophysics,171(11), 3143-3157. 514
24
Mandelbrot, B. B. (1983). The Fractal Geometry of Nature, W. H. Freeman and Company, New York, 495 p. 515
Martel, S. J., Pollard, D. D., & Segall, P. (1988). Development of simple strike-slip fault zones, Mount Abbot 516
quadrangle, Sierra Nevada, California. Geological Society of America Bulletin, 100(9), 1451-1465. 517
Newman, P. J., & Griffith, W. A. (2014). The work budget of rough faults.Tectonophysics, 636, 100-110. 518
Ohnaka, M. (2003). A constitutive scaling law and a unified comprehension for frictional slip failure, shear 519
fracture of intact rock, and earthquake rupture. Journal of Geophysical Research, B2, 2080, 520
doi:10.1029/2000JB000123 521
Patton, F. (1966). Multiple modes of shear failure in rock. Proc. 1st congr. Int. Soc. Rock Mech. , (pp. 1, 509-522
513). Lisbon. 523
Power, W. L., Tullis T. E. and Weeks, J. D. (1988). Roughness and wear during brittle faulting, Journal of 524
Geophysical Research, 93, 15,268-15,278. 525
Queener, C. A., Smith, T. C., and Mitchell, W. L. (1965). Transient wear of machine parts, Wear, 8, 391–400. 526
Reches, Z. E., & Lockner, D. A. (1994). Nucleation and growth of faults in brittle rocks. Journal of Geophysical 527
Research, 99(B9), 18159-18173. 528
Renard, F., Viosin, C., Marsan, D., & Schmittbuhl, J. (2006). High resolution 3D laser scanner measurements 529
of a strike-slip fault quantify its morphological anisotropy at all scales. Geophys. Res. Let., 33, DOI: 530
10.1029/2005GL025038. 531
Renard, F., Mair, K., & Gundersen, O. (2012). Surface roughness evolution on experimentally simulated 532
faults. Journal of Structural Geology, 45, 101-112. 533
Sagy, A., & Brodsky, E. (2009). Geometric and rheologic asperities in an exposed fault zone. Journal of 534
Geophysical Reasearch, 114, B02301, doi:10.1029/2008JB005701. 535
Sagy, A., Brodsky, E., & Axen, G. J. (2007). Evoluction of fault-surface roughness with slip. Geology, Vol. 35, 536
Num. 3, 283-286. 537
Segall, P., & Pollard, D. D. (1983). Nucleation and growth of strike slip faults in granite. Journal of Geophysical 538
Research: Solid Earth, 88(B1), 555-568. 539
25
Siman-Tov, S., Aharonov, E., Sagy, A., & Emmanuel, S. (2013). Nanograins form carbonate fault mirrors. 540
Geology, 41(6), 703-706. 541
Siman-Tov, S., Aharonov, E., Boneh, Y., & Reches, Z. (2015). Fault mirrors along carbonate faults: Formation 542
and destruction during shear experiments. Earth and Planetary Science Letters, 430, 367-376. 543
Tchalenko, J. (1968). The evolution of kink-bands and the development of compression textures in sheared 544
clays. Tectonophysics, 6, 159-174. 545
Wang, W., & Scholz, C. H. (1994). Wear processes during frictional sliding of rock: A theoretical and 546
experimental study. Journal of Geophysiacal Research, Vol.99, No. B4, pp. 6789-6799. 547
Wang, K., & Bilek, S. L. (2011). Do subducting seamounts generate or stop large 548
earthquakes?. Geology, 39(9), 819-822. 549
Wesnousky, S. G. (1988). Seismological and structural evolution of strike-slip faults. Nature, v. 335, 340-342. 550
Wibberley, C. A. J., Yielding, G. & Di Toro, G. (2008). Recent advances in the understanding of fault zone 551
internal structure: a review. Geological Society, London, Special Publications 299.1, 5-33. 552
Geometrical evolution of interlocked rough slip surfaces: The role of
normal stress
Nir Badt1, Yossef H. Hatzor1, Renaud Toussaint2 and Amir Sagy3*
1. Department of Geological and Environmental Science, Ben-Gurion University of the Negev, Beer Sheva 84105, Israel 2. Institut de physique du globe de Strasbourg, 5, rue René Descartes - F-67084 Strasbourg cedex 3. Geological Survey of Israel, 30 Malkhe Israel, Jerusalem 95501, Israel *Corresponding author: [email protected]
Supplementary Material
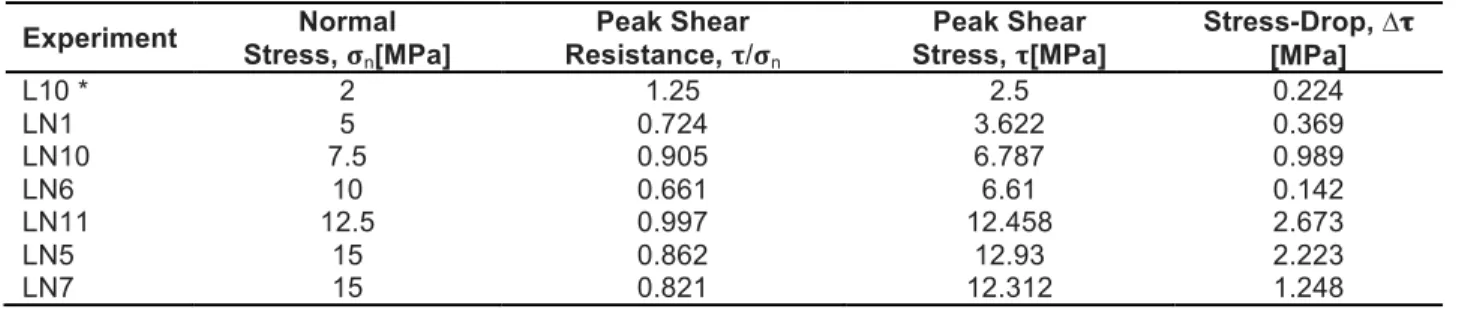
Table 1. Results from direct shear experiments
Experiment Stress, Normal 𝛔
n[MPa]
Peak Shear Resistance, 𝛕/𝛔n
Peak Shear
Stress, 𝛕[MPa] Stress-Drop, ∆[MPa] 𝛕
L10 * 2 1.25 2.5 0.224 LN1 5 0.724 3.622 0.369 LN10 7.5 0.905 6.787 0.989 LN6 10 0.661 6.61 0.142 LN11 12.5 0.997 12.458 2.673 LN5 15 0.862 12.93 2.223 LN7 15 0.821 12.312 1.248 *Data from Davidesko et al. (2014)
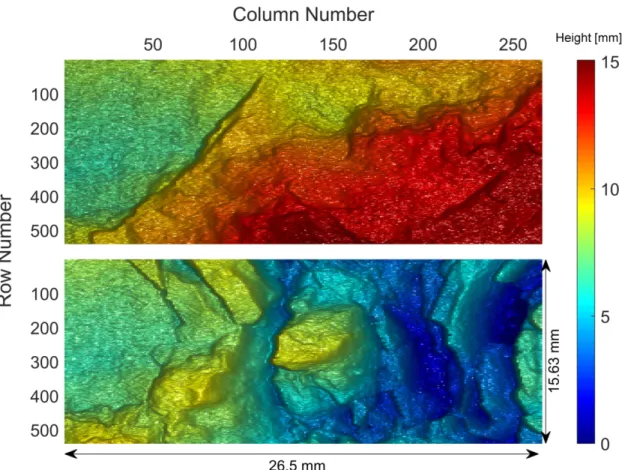
Figure 1. Surface matrices before (top) and after (bottom) shear for an experiment sheared under 7.5 MPa.
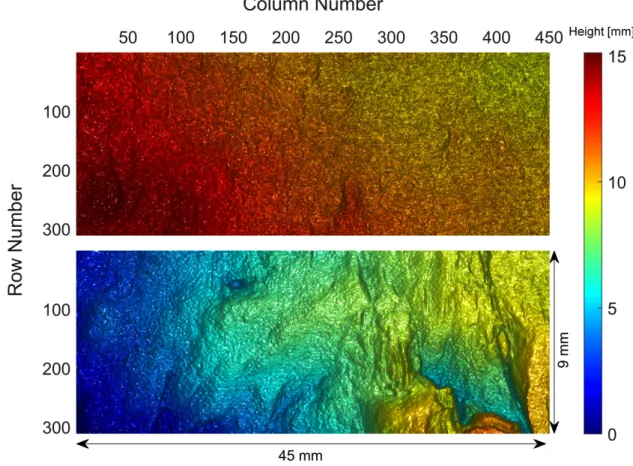
Figure 2. Surface matrices before (top) and after (bottom) shear for an experiment sheared under 15 MPa.