To link to this article :
DOI:
10.1109/ICETCE.2012.252
URL :
http://dx.doi.org/10.1109/ICETCE.2012.252
To cite this version :
Wang, Yunli and Ababou , Rachid and Marcoux, Manuel
Effect and
propagation of water level fluctuations in a sloping sandy beach --
Unsaturated porous media II: numerical simulation test of single
harmonic wave (long run)
. (2012) In: ICETCE 2012 (18-20 May
2012) : The 2nd International Conference on Electric and Civil
Engineering , 18 May 2012 - 20 May 2012 (Three Gorges , China).
Open Archive TOULOUSE Archive Ouverte (OATAO)
OATAO is an open access repository that collects the work of Toulouse researchers and
makes it freely available over the web where possible.
This is an author-deposited version published in :
http://oatao.univ-toulouse.fr/
Eprints ID : 10633
Any correspondance concerning this service should be sent to the repository
administrator:
[email protected]
Effect and Propagation of Water Level Fluctuations
in a Sloping Sandy Beach—Unsaturated Porous Media II
Numerical Simulation Test of Single Harmonic Wave (long run)
Yunli Wang 1,2
1Southwest Hydraulic Engineering and Science Institute for Waterways, Chongqing Jiaotong University
Chongqing, China Email: [email protected]
Rachid Ababou2, Manuel Marcoux2
2Groupe d’Etudes sur les Milieux Poreux (GEMP), Institut de Mécanique des Fluides de Toulouse (IMFT)
Toulouse, France
Emails: [email protected]; [email protected] Abstract—In coastal processes, the strong water movements due
to short periodic waves (such as sea swell) can induce irregular water level fluctuations in the swash zone and within the sandy beach. The measured water level fluctuations with very complex entry water level fluctuations in a wave canal with a sloping sandy beach were analyzed by using 7 capacitive sensors. Numerical simulations have also been implemented in order to complement the experimental water level signal analyses. In this paper, a numerical test of single harmonic wave (long run) with same computational domain and porous media properties as the experiment is conducted to understand the effect and propagation of the water level fluctuations in the unsaturated porous media. The key coupling parameter of the macro (sea water) porous and micro (sloping sandy beach) porous media in the Richards equation model is further identified by this numerical test, which is the basis to simulate and explain the complex experimental results.
Keywords-Water level fluctuations; single harmomic wave; macro porous media; micro porous media; sloping sandy beach; unsaturated porous media;Richards eqution
I. INTRODUCTION
Beach groundwater interacting with tides, waves and swash is a complex and dynamic system. Groundwater fluctuations driven by oceanic oscillations enhance water exchange between the ocean and coastal aquifer. Interaction between swash dynamics and groundwater may also be important with regard to onshore sediment transport and beach profile evolution. There is currently limited understanding of how the beach groundwater system responds to oceanic forcing at various frequencies.
A ―wave-beach‖ experiment was conducted in a large water wave canal equipped with a wave generator (CIEM flume in Barcelona) [1]. The experiment was part of a European project, HYDRALAB-SANDS, undertaken in collaboration between the HYDRALAB laboratory in Barcelona (Spain) and the OTE group of IMFT laboratory (Toulouse, France). The experiment was initially designed to measure the erosion of the swash zone in a sandy beach, with periodic water level oscillations.
This work focuses on a related problem, namely, the effect of surface water waves and swash zone phenomena on subsurface oscillations in the sandy porous medium, and the
possible interactions between surface and subsurface oscillations.
Richard model with Van Genuchten / Mualem parameters in the Bigflow code developed by Rachid Ababou (Ababou 1991 [2]) has been identified by a simple numerical simulation test of single harmonic wave (short run) for being capable of modelling the coupling between the macro (sea water) and micro porous media (sloping sandy beach) [3]. In this paper, Richard model is further identified by another relatively complex numerical simulation test of single harmonic wave (long run) in the sloping sandy beach-unsaturated porous media.
II. EXPERIMENT
A. Experiment description
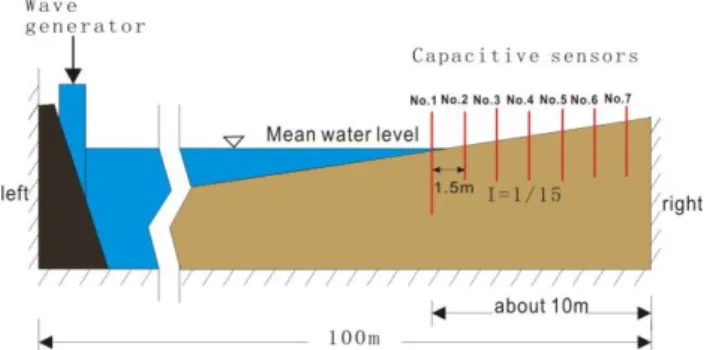
A 100m long, 3m wide and 5m high water-wave canal was used in this study. At the back end of the canal, a mechanical wave generator was designed with adjustable period and amplitude. For this experiment, the period was about 4 seconds, and the maximum amplitude was about 0.9 m. The weighted average diameter d50 of sand grains was 0.25mm. The beach slope was 1/15.
As shown in Fig. 1, 7 capacitive sensors were installed at intervals of about 1.5 m in the beach in order to measure groundwater level fluctuations. In particular, sensor No.1 was placed near the still water / beach boundary to measure the water level fluctuations corresponding to the entry condition of the model.
Doctoral scholarship in France (CSC)
Figure 1 Schematic of the layout of the capacitive sensors in the swash zone (vertical axial section). Sensor N°1 is closest
to the free water.
Wang Y., R. Ababou, M. Marcoux (2012) : “Effect and Propagation of Water Level Fluctuations in a Sloping Sandy Beach --Unsaturated Porous Media II: Numerical Simulation Test of Single Harmonic Wave (Long Run)”. Proceedings of ICETCE 2012: The 2nd International
B. Measured water levels H(t)
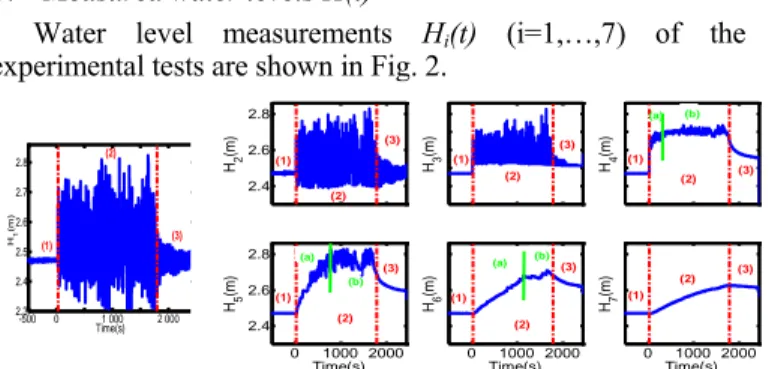
Water level measurements Hi(t) (i=1,…,7) of the experimental tests are shown in Fig. 2.
-500 0 1 000 2 000 2.3 2.4 2.5 2.6 2.7 2.8 (1) (2) (3) Time(s) H1 (m) 2.4 2.6 2.8 (1) (2) (3) H2 (m ) (1) (2) (3) H3 (m ) (1) (2) (3) H4 (m ) 0 1000 2000 2.4 2.6 2.8 (1) (2) (3) H5 (m ) Time(s) 0 1000 2000 (1) (2) (3) H6 (m ) Time(s) 0 1000 2000 (1) (2) (3) H7 (m ) Time(s) (a) (b) (b) (a) (b) (a)
Figure 2 Water levels Hi(t) versus time at the 7 sensors From Fig.2, the measurement results show clearly one effect with two aspects: the spatial decaying of the amplitudes away from the shore, and the filtering out of the shortest periods (i.e., the system behaves as a low-pass filter of water fluctuations). Furthermore, the signals away from the shore (H5(t), H6(t) ,H7(t)) exhibit a very different behavior from those closer to the shore.
The net increase of the mean groundwater in these sensors may be caused by the sloping beach favoring vertical infiltration/drainage, and swash zone run-up, as observed in other coastal processes (Turner 1997 [4]).
III. NUMERICAL SIMULATION
Two types of equation models are used for analyzing transient porous media flows: saturated plane flow equation (Dupuit-Boussinesq), and variably saturated 3D flow (generalized Richards). Both models can treat the case of transient flow in a partially saturated porous medium, under different assumptions. In this paper, we use variably saturated 3D flow model.
A. Govening equations
Variably saturated 3D flow model model is based on a generalization of the 3D Richards equation for variably saturated heterogeneous porous media, possibly with macro-porous zones (including inertial effects with a quadratic flux-gradient law). This model is fully 3D (not vertically hydrostatic), and it is able to represent multiple free surface dynamics in (x,y,z,t). Also, the model accounts for capillary effects in the unsaturated zone.
The equations are given by (Trégarot, 2000 [4]): 3D mass conservation: div q
t h e . (1) 3D Darcy-Buckingham (saturated/unsaturated):
h H K q . (2)3D flow equation for pressure head h: B g h K div h h K div t h e ) ( ) ( . (3) Where, r e h h
( ) ( ) is the effective volumetric water content, m3/m3;
h
is the pressure head, m; r is the residual water content, m3/m3;
x g h
H is total hydraulic head, m;
x
is the point coordinate vector in the (x,y,z);g g
g/ is the normalized anti-gravity vector
(upwards); ) ( 0 0 0 ) ( 0 0 0 ) ( ) ( h K h K h K h K zz yy xx is hydraulic conductivity tensor, m/s.
Note that the hydraulic conductivity tensor is expressed here in the principal system of coordinates. It is assumed that the axes of the computational domain (x,y,z) coincide with the principal system of the permeability tensor. That is, the matrix
K(h) is assumed diagonal in this work. Nevertheless, it is worth
noted that our model allows for the conductivity-pressure relation K(h) to be nonlinearly anisotropic.
Note K(h) and θ(h) are respectively hydraulic conductivity function and water content function for the unsaturated media. For the unsaturated simulation, the parameter models of the water content θ(h) and the hydraulic conductivity K(h) are very important. Examples of models that have been often used in the literature are the Brooks and Corey, Brutsaert, Campbell, Van Genuchten / Mualem, and the Exponential model. These models have been often used for hydrological applications in the unsaturated zone, and the Van Genuchten / Mualem, and the Exponential model are most popular [5]. In this paper, we use Van Genuchten / Mualem model.
B. Van Genuchten / Mualem model of K(h) and θ(h)
In the unsaturated zone of a porous medium, the model proposed by Van Genuchten (1980) [6] for the water content-pressure relation, θ(h), is:
m n r s r h h h S ) ( 1 1 ) ( ) ( (4) Where,
θs is the saturated water content, m3/m3; θr is the residual water content, m3/m3;
m, n are the dimensionless exponents of the VGN model.
The functional model of Mualem (1976) [7] relates the hydraulic conductivity function K(h) to θ(h) function via a functional (integral). When θ(h) is the Van Genuchten curve of eq. (4), the resulting K(h) is of the form:
2 ) ) ( 1 ( 1 1 1 ) ) ( 1 ( 1 ) ( ) ( /2 m n n r s r R h h K K K h K h K m (5) where,
Ks is the saturated hydraulic conductivity, m/s; Kr is the residual hydraulic conductivity, m/s;
n
m11/ (Mualem model).
In addition, in the Van Genuchten / Mualem model, the can be interpreted as an inverse capillary length scale (mean capillary length):
1
C. Numercial method
In this paper, BigFlow is used to do the coupling between the free surface water flow (sea water) and the groundwater flow (Ababou and Al-Bitar (2008) [8]). The Bigflow code is based on the implicit finite volume, with sparse Preconditioned Conjugate Gradient matrix solver, and modified Picard iterations for nonlinear problem. The code was developed by Rachid Ababou for high resolution simulation of 3D groundwater and unsaturated flow in heterogeneous media, and was tested for high-performance computations (Ababou et al (1993) [9]).
D. Computational domain
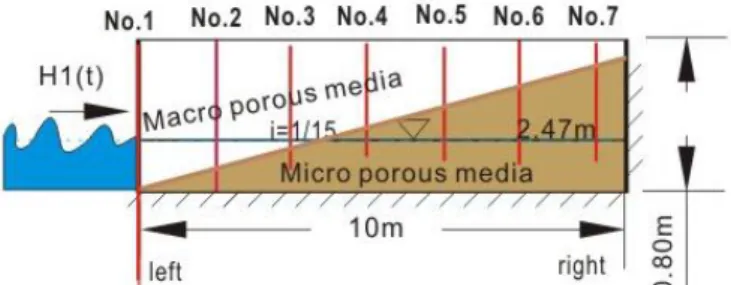
The computational domain of the numerical test is similar to the experiment and its vertical cross section is shown in Fig. 4.
Figure 4 vertical cross section of the numerical simulations In Fig.4, the computational domain includes two media: macro and micro porous media (sea water and sloping sandy beach). Furthermore, 7 probes (sensors) with same x position as those of the experiment are placed in the porous media to measure the numerical water level fluctuations
) (t
Hi (i=1, …,7).
E. Boundary and initial conditions
The left boundary is open and all the other boundaries are impermeable walls. The initial water level H0 is constant and at zero moment, it suddenly becomes oscillatory with a sine wave entering into the computational domain, and then it keeps oscillatory until the maximum calculation time tmax=600s. The left entry water level is written in Eq. (6) and shown Fig. 5 as follows:
t T A H t H(0,) 0 0 sin 2 (6)
Where, H0=0.2m, A0/H0=0.5, and T=30se
0 100 200 300 400 500 600 0 0.2 0.4 0.6 0.8 Time(s) H1 (m)
Figure 5 Left entry water level fluctuation for single harmonic wave test (long run)
F. Physical properties of the beach sands and the sea water
The saturated hydraulic conductivity Ks of the sand beach is 0.05m/s,and the ratio of the hydraulic conductivity between
macro and micro porous media is taken 1.0E+4. The saturated water content θs of the sand beach is taken the measured value 0.38m3/m3, while the sea water is a macro porous medium and its saturated water content is taken 1 m3/m3. The parameter functions of and of VGM of two media are shown in Fig. 6.
-102 -100 -10-2 -10-4 -10-6 10-8 10-6 10-4 10-2 100 h(m) (m 3/m 3)
Micro porous media (beach sands) Macro porous media (sea water)
-102 -100 -10-2 -10-4 -10-6 10-10 10-5 100 105 h(m) K(m/s)
Micro porous media (beach sands) Macro porous media (sea water)
Figure 6 Water content
h and hydraulic conductivity hK of the micro and macro porous media in log-log axis
IV. NUMERCIAL RESULTS AND ANALYSIS
In this paper, we introduce the numerical results and analysis of single harmonic wave test (long run).
A. Evolution of the water level fluctuations in space and time
The evolution of the water levels of the 6 sensors Hi(t) (i=2,…,7) is separately shown in Fig. 7.
0 200 400 600 0,1 0,2 0,3 H 2 (m ) 0 200 400 600 0.1 0.2 0.3 H 3 (m ) 0 200 400 600 0.1 0.2 0.3 H 4 (m ) 0 200 400 600 0.1 0.2 0.3 H 5 (m ) 0 200 400 600 0.1 0.2 0.3 H 6 (m ) Time(s) 0 200 400 600 0.1 0.2 0.3 H 7 (m ) Time(s)
Figure 7 Evolution of the water levels of the 6 sensors at t=0-600s.
Fig. 7 clearly shows the spatial decaying of the amplitudes of the water levels of the 6 sensors Hi(t) (i=2,…,7) away from the shore, which has a good agreement with the experimental results . Furthermore, these water levels and its corresponding mobile averages are together demonstrated in Fig.8.
its corresponding mobile averages.
From Fg.8, it can be seen that: (1) in the pure groundwater zone, the each mobile average of the water levels Hi(t) (i=4,…,7) is gradually increasing and finally tend to a same stable constant value; (2) in the mixed zone of free water and groundwater, in spite of the fact less higher than the ones of Hi(t) (i=4,…,7), the mobile averages of Hi(t) (i=2,…,3) are still higher than the one of the left entry water level H1(t) (0.2m). The phenomenon (1) may be owing to the capillary effects of the beach sands and the impermeable right boundary of the numerical domain. Meanwhile, the phenomenon (2) may be owing to the capillary effects of the beach sands and free water flow movement. In short, the two phenomena have good agreements with the ones of the above experiment as well as the literature [Turner 1997 [4]].
B. Profiles of the pressure head contour and the flux velocity field
The instantaneous profiles of the pressure head contour and the flux field at t=T+T/8=33.75s is shown in Fig. 9.
Figure 9 Instantaneous vertical cross-section maps of the pressure and flux (length scale in z direction is 10)
Note: in order to clearly demonstrate the flux field in the two type of media in one figure, two flux scales are respectively adopted: (a) 0.3 is taken for free water in the sea; (b) 20 is taken for the groundwater.
From this figure, it can be seen that, at t=T+T/8=33.75s, the water levels are rising from the mean water level to the maximum, which leads to the upward flux field in the sea water. Meanwhile, in the beach, the flux is more complicated than the one in the sea. Actually, in the variable zone with great fluctuation of water levels in the beach, multi-direction flux presents periodically and its values are much bigger than the one in the other zones of the beach.
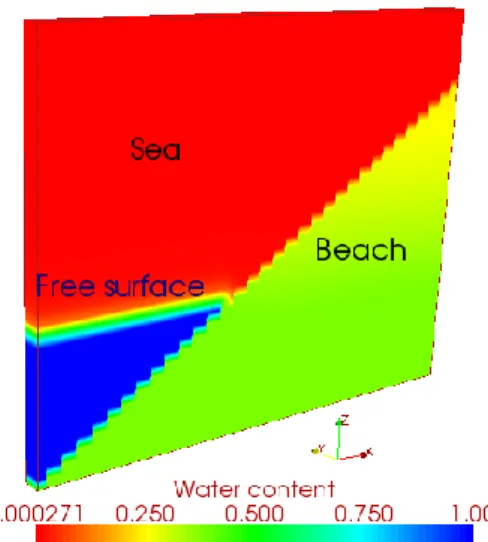
C. Instantaneous water content distribution θ(h) in the vertical section
The instantaneous distributions of the water content (h) in
the vertical section at t=T+T/8=33.75s is shown in Fig. 10.
Figure 10 Instantaneous vertical cross-section maps of the water content
h (length scale in z direction is 10)Fig. 10 indicates that the instantaneous distribution of the water content (h) in the vertical section is consistent with the
pressure head distribution at the same time (Fig. 9). Furthermore, it is clearly shown that the capillary length of the macro porous medium (sea) is very short (about 1cm). Meanwhile, the capillary length of the micro porous medium (sandy beach) is much large (about 20cm). Here, it is noted that, in the numerical model, for the macro and micro porous media, respectively takes 100 and 5.0 for Van Genuchten / Mualem parameter model.
V. CONCLUSION
Richard model with Van Genuchten / Mualem parameters in the Bigflow code has been further successfully identified by the numerical simulation of harmonic single wave (long run), owing to two main results:
the spatial decaying of the amplitudes of the water levels of the 6 sensors Hi(t) (i=2,…,7) away from the shore in the sloping sandy beach
the mean water levels in cross-shore direction in the sandy beach, which are higher than the ones in the sea the flux field in the sandy beach: in the variable zone
with great fluctuation of water levels in the beach, multi-direction flux periodically presents and its values are much bigger than the one in the other zones of the beach.
ACKNOWLEDGMENT
This experiment has been conducted through a collaborative effort on a long wave canal experiment (SANDS/HYDRALAB, Barcelona, Spain) and in collaboration with the OTE group of IMFT laboratory (D. Astruc, O. Eiff, et al., IMFT, Toulouse, France). In addition, most of this paper is based on the first author’s Ph.D. thesis (available online), with a doctoral scholarship funded by the China Scholarship Council (CSC).
REFERENCES
[1] Y. Wang, R. Ababou and M. Marcoux, ―Signal processing of water level fluctuations in a laboratory experiment: sloping sandy beach in a wave
canal (hydralab project barcelona)‖
.
GeoShanghaï 2010 internat.conf.: ASCE Geotech. Special Publi. (GSP). Vol. 376, N°41103, pp.
204 –210. http://dx.doi.org/10.1061/41103(376)26 , EI.
[2] R. Ababou, ―Approaches to Large Scale Unsaturated Flow in Heterogeneous, Stratified, and Fractured Geologic Media‖. Report NUREG/CR-5743, U.S. Nuclear Regulatory Commission, Government Printing Office, Washington DC, 150 pp., 1991.
[3] Y. Wang, R. Ababou and M. Marcoux, ―Effect and propagation of water Level fluctuations in a sloping sandy beach—unsaturated porous media: numerical simulation test of single harmonic wave (short run)‖.
ICMT 2011(WCEUP2011) hangzhou, internat. conf. proceeding,
IEEE ,vol.2, pp. 1516 –1519. Accession number of EI:
20113814353524.
[4] IL.Turner , BP. Coates and RI. Acworth, ―Tides, waves and the super-elevation of groundwater at the coast‖. Journal of Coastal Research,vol. 13(1): 46-60, 1997.
[5] G. Trégarot, ―Modélisation couplée des écoulements à saturation variable avec hétérogénéités, forçage et interface hydrologique.‖ Thèse de doctorat. IMFT, Institut National Polytechnique de Toulouse, 2000. [6] MTh.Van Genuchten, ―A closed-form equation for predicting the
hydraulic conductivity of unsaturated soils‖. Soil Sci. Soc. Am. J., 44:892-898, 1980.
[7] Y. Mualem, ―A new model for predicting the hydraulic conductivity of unsaturated porous media‖. Water Resources Research, 12(3), pp. 513- 522, 1976.
[8] R. Ababou and A. Al-Bitar, ―Coupled Surface / Subsurface Flow Systems : Numerical Modeling‖. Chap. 7 in ―Overexploitation & Contamination of Shared Groundwater Resources‖. NATO-ASI: Advanced Studies Institute Series, C.J.G. Darnault (ed.), Springer Science & Business Media BV, January 2008 (pp. 105-117)
[9] R .Ababou and A. C. Bagtzoglou, ―Bigflow: A numerical code for simulating flow in variably saturated, heterogeneous geologic media (theory and user’s manual, version 1.1)‖. Report NUREG/CR-6028, US Nuclear Regulatory Commission, Government Printing Office,