HAL Id: hal-00300992
https://hal.archives-ouvertes.fr/hal-00300992
Submitted on 27 Mar 2003HAL is a multi-disciplinary open access
archive for the deposit and dissemination of sci-entific research documents, whether they are pub-lished or not. The documents may come from teaching and research institutions in France or abroad, or from public or private research centers.
L’archive ouverte pluridisciplinaire HAL, est destinée au dépôt et à la diffusion de documents scientifiques de niveau recherche, publiés ou non, émanant des établissements d’enseignement et de recherche français ou étrangers, des laboratoires publics ou privés.
New-particle formation events in a continental boundary
layer: First results from the SATURN experiment
F. Stratmann, H. Siebert, G. Spindler, B. Wehner, D. Althausen, J.
Heintzenberg, O. Hellmuth, R. Rinke, U. Schmieder, C. Seidel, et al.
To cite this version:
F. Stratmann, H. Siebert, G. Spindler, B. Wehner, D. Althausen, et al.. New-particle formation events in a continental boundary layer: First results from the SATURN experiment. Atmospheric Chemistry and Physics Discussions, European Geosciences Union, 2003, 3 (2), pp.1693-1731. �hal-00300992�
ACPD
3, 1693–1731, 2003 New-particle formation: SATURN F. Stratmann et al. Title Page Abstract Introduction Conclusions References Tables Figures J I J I Back Close Full Screen / EscPrint Version Interactive Discussion
c
EGU 2003 Atmos. Chem. Phys. Discuss., 3, 1693–1731, 2003
www.atmos-chem-phys.org/acpd/3/1693/ c
European Geosciences Union 2003
Atmospheric Chemistry and Physics Discussions
New-particle formation events in a
continental boundary layer: First results
from the SATURN experiment
F. Stratmann1, H. Siebert1, G. Spindler1, B. Wehner1, D. Althausen1,
J. Heintzenberg1, O. Hellmuth1, R. Rinke1, U. Schmieder1, C. Seidel1, T. Tuch1, U. Uhrner1, A. Wiedensohler1, U. Wandinger1, M. Wendisch1, D. Schell2, and A. Stohl3
1
Institute for Tropospheric Research, Leipzig, Germany
2
enviscope GmbH, Frankfurt/Main, Germany
3
Technical University of Munich, Freising, Germany
Received: 6 February 2003 – Accepted: 20 March 2003 – Published: 27 March 2003 Correspondence to: F. Stratmann ([email protected])
ACPD
3, 1693–1731, 2003 New-particle formation: SATURN F. Stratmann et al. Title Page Abstract Introduction Conclusions References Tables Figures J I J I Back Close Full Screen / EscPrint Version Interactive Discussion
c
EGU 2003
Abstract
During the SATURN experiment, which took place from 27 May to 4 June 2002, new particle formation in the continental boundary layer was investigated. Simultane-ous ground-based and tethered-balloon-borne measurements were performed, includ-ing meteorological parameters, particle number concentrations and size distributions, 5
gaseous precursor concentrations and SODAR and LIDAR observations.
Newly formed particles were observed inside the residual layer, before the break-up process of the nocturnal inversion, and inside the mixing layer throughout the break-up of the nocturnal inversion and during the evolution of the planetary boundary layer.
1. Introduction
10
Atmospheric aerosol particles influence climate (e.g. Charlson and Heintzenberg, 1995) and human health (e.g. Dockery and Pope,1994). An important source of at-mospheric aerosols is new particle formation from gaseous precursors, i.e. homoge-neous nucleation. If newly formed particles grow up to diameters about of 50 nm and larger they become climatically relevant as particles in this size range can act as cloud 15
condensation nuclei (CCN). A changing number of CCN may affect the size of cloud droplets and consequently the radiative properties of clouds. This effect is called the indirect aerosol effect on climate. If the newly formed particles grow up to sizes above 100 nm, they start to scatter light efficiently and alter the radiative properties of the Earth’s atmosphere directly. This effect is called the direct effect of aerosol particles on 20
climate.
Nucleation, usually detected as enhanced number concentration of particles in the size range below 10 nm, has been observed in Arctic areas (Wiedensohler et al.,1996; Pirjola et al.,1998), in marine locations (e.g.Hoppel et al.,1994;O’Dowd et al.,1999) and in continental locations, such as boreal forests (M ¨ak ¨al ¨a et al.,1997), remote (e.g. 25
ACPD
3, 1693–1731, 2003 New-particle formation: SATURN F. Stratmann et al. Title Page Abstract Introduction Conclusions References Tables Figures J I J I Back Close Full Screen / EscPrint Version Interactive Discussion
c
EGU 2003 al.,2000), the free troposphere (Clarke,1992;Schr ¨oder and Str ¨om,1997), and in the
vicinity of evaporating clouds (Hegg et al.,1990;Wiedensohler et al.,1997; Keil and Wendisch,2001).
To date, the fundamental processes causing nucleation and subsequent growth into the size-range of a few nanometers are still not well understood. Most likely there is 5
not only one mechanism that controls atmospheric nucleation processes. Weber et al. (1999) e.g. suggested that nucleation mechanisms may vary with altitude. Other re-searchers noted that favourable atmospheric conditions, such as turbulence due to breaking Kelvin-Helmholtz waves (Bigg, 1997) or boundary layer mixing processes (Easter and Peters,1994;Nilsson and Kulmala,1998;Hellmuth and Helmert,2002; 10
Uhrner et al.,2002), and atmospheric waves in general (Nilsson et al.,2000) can en-hance nucleation rates by up to several orders of magnitude. However, most of the measurements reported in the literature are single point measurements and therefore not suitable to gain insight into the above mechanisms.
In this work, which reports first results from the SATURN (”Strahlung, vertikaler 15
Austausch, Turbulenz und Partikel-Neubildung”, radiation, vertical exchange, turbu-lence and new particle formation) experiment, a new approach is presented. Instead of performing only single point measurements, vertical soundings of meteorological parameters such as wind, temperature, relative humidity, and particle number concen-trations were carried out utilizing a unique balloon-borne measurement platform. In ad-20
dition, ground-based measurements of particle number size distributions and gaseous precursor concentrations (SO2, NH3) were performed at the site where the balloon was launched. Furthermore, at two additional locations (distance to the balloon site is about 40 km) particle number size distributions were measured. To gain information about the vertical structure and the development of the boundary layer, SODAR measure-25
ments were performed at the balloon site and a LIDAR was operated at about 50 km apart from to the balloon site.
ACPD
3, 1693–1731, 2003 New-particle formation: SATURN F. Stratmann et al. Title Page Abstract Introduction Conclusions References Tables Figures J I J I Back Close Full Screen / EscPrint Version Interactive Discussion c EGU 2003 2. SATURN experiment 2.1. Experimental sites
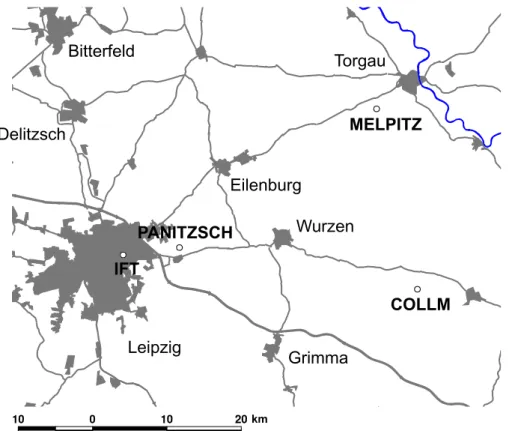
During the SATURN experiment, measurements were taken at three measurement sites (Fig. 1), i.e. Melpitz, Collm, and Panitzsch. All three sites can be classified as rural, urban influenced with varying distances to the city of Leipzig. Additionally, 5
LIDAR measurements were performed at the Institute for Tropospheric Research (IfT) in Leipzig.
Melpitz: The Melpitz site (51.526◦N, 12.928◦E, 87 m a.s.l.), located about 42 km north-east of Leipzig, is the permanent research station of the IfT and is situated near 10
the village Melpitz in the vicinity of the city of Torgau (river Elbe valley). The station is located on a flat meadow (approximately 400 m × 500 m) surrounded by agricultural land. The nearest road is passing by around 1.5 km to the north. Edges of forests are 2.5 km to the north (D ¨ubener Heide) and 1 km to the south (Dahlener Heide). For further information seeSpindler et al.(1996) andSpindler et al.(2001).
15
Collm: The measurement site Collm is located on the isolated hill Collm (51.3077◦N, 13.0026◦E, 230 m a.s.l.) approximately 40 km south-east of Leipzig. It is surrounded by small villages, forests, and agriculturally used areas and features a busy national road approximately 2 km from the measurement site. The hill is mainly covered 20
with forest. The building of Collm Observatory of the Leipzig University hosted the measurement. Instrumentation was set up on the highest floor of the building and the aerosol inlet was mounted 1 m above the building, corresponding to a height of 25 m above ground.
25
Panitzsch: The site in the village Panitzsch (51.361◦N, 12.544◦E, 139 m a.s.l., approximately 10 km to the east of Leipzig) was located at the edge of a residential area. The measurement van was set up 5 m from a local road and approximately
ACPD
3, 1693–1731, 2003 New-particle formation: SATURN F. Stratmann et al. Title Page Abstract Introduction Conclusions References Tables Figures J I J I Back Close Full Screen / EscPrint Version Interactive Discussion
c
EGU 2003 20 m from a wheat field to the east. The surrounding area is flat and open to the east
and north. The aerosol inlet was mounted on a 10-m mast. The height of the nearby housing was approximately 1 m below the inlet height.
2.2. Balloon-borne measurements of turbulence, trace gas, and particle number con-centration in Melpitz
5
To measure the vertical distribution of particle number concentrations and turbulence (wind vector, temperature, and humidity) the tethered-balloon-borne payload ACTOS (Airship-borne Cloud Turbulence Observation System) was used. This system was originally developed to measure turbulence and microphysical parameters in boundary-layer clouds (Siebert et al.,2003). For the SATURN-experiment ACTOS was equipped 10
with the following instruments.
– An ultrasonic (“sonic”) anemometer/thermometer (Solent HS, Gill Instruments
Ltd., Lymington, United Kingdom) was used to measure the three-dimensional wind vector with 100-Hz resolution (Siebert and Muschinski,2001). To correct the measured wind vector for altitude and lateral motion a navigation unit including 15
GPS (Global Positioning System) and inertial sensors was included. The mea-surement height was derived from the static pressure measured with a barome-ter (PTB220, Vaisala Oy, Helsinki, Finland) and from GPS. The humidity fluctua-tions were determined with a closed Lyman-α absorption hygrometer which was calibrated against a slow more accurate capacitive sensor (Humicap HMP232, 20
Vaisala Oy, Helsinki, Finland). The temperature fluctuations were measured with fine-wire sensors (UFT-B, see Haman et al., 2000), additionally the virtual tem-perature was derived from the speed of sound as measured with the sonic. Both probes were calibrated with an airborne thermometer (PT-100, T-139, Rosemount Inc., Eagan, MN, USA). A real-time data acquisition system with telemetry link for 25
ground monitoring completes the equipment of ACTOS.
ACPD
3, 1693–1731, 2003 New-particle formation: SATURN F. Stratmann et al. Title Page Abstract Introduction Conclusions References Tables Figures J I J I Back Close Full Screen / EscPrint Version Interactive Discussion
c
EGU 2003 USA) were run in parallel for particle number concentration measurements. Both
CPCs were operated at a flow rate of 1.5 l min−1 but at different temperature differences ∆T between saturator and condenser (CPC-I ∆T = 18 K and CPC-II ∆T = 24 K). Banse et al.(2001) determined the lower cut-off sizes of the TSI-3762 at 20 K and 23 K to 8 and 5 nm. For∆T = 18 and 24 K, the lower cut-off 5
size can be estimated to about 10 and 5 nm, respectively. From the two number concentrations NI and NII measured with these CPCs, the number concentration of particles in the diameter range 5–10 nm was determined. The time resolution of the concentration measurements is in the order of one second (Buzorius et al., 1998).
10
– For the detection of SO2 gas-phase concentrations a THERMO ENVIRONMEN-TAL, Model 43C Trace Level Instrument with a time resolution of 10 s was used. Since this instrument is designed for ground-based operation, it was modified with respect to weight reduction and power supply. Zero-point stabilization and span of the signal have been checked each day in the field by using an activated carbon 15
filter bag and a 20 ppb standard-gas Teflon bag, respectively.
The complete system ACTOS is about 4 m in length and the payload is about 110 kg. The setup is illustrated in Fig.2with indication of the main sensor equipment. ACTOS together with the tethered balloon MAPS-Y is shown in Fig.3. The ceiling of the system is at about 1.3 km at maximum wind speeds of 10–15 m s−1. A more detailed descrip-20
tion of the turbulence sensors and a general introduction of ACTOS and MAPS-Y is given bySiebert(2001) andSiebert et al.(2003).
2.3. Measurements of meteorological parameters and trace-gas concentrations at the Melpitz site
At the Melpitz site continuous measurements of meteorological parameters and trace 25
gases concentrations were carried out during the SATURN experiment. Global solar radiation was measured using a pyranometer (CM11, Kipp and Zonen, Germany).
ACPD
3, 1693–1731, 2003 New-particle formation: SATURN F. Stratmann et al. Title Page Abstract Introduction Conclusions References Tables Figures J I J I Back Close Full Screen / EscPrint Version Interactive Discussion
c
EGU 2003 Dry and wet bulb temperatures (PT100) were determined utilizing a psychrometer
(Thies, Germany). In combination with pressure measurements (Vaisala, Germany), the relative humidity was calculated. Measurements of wind direction and horizontal wind velocity were carried out using a wind vane (Siggelkow, Germany) and a cup anemometer (Siggelkow, Germany), respectively. The temperature was measured 5
2.4 m above ground, wind direction and horizontal wind velocity at 12 m and 11.7 m height, respectively.
To characterize the development of the boundary layer at the Melpitz site, a monostatic Doppler SODAR (MODOS, manufactured by METEK GmbH, Elmshorn, 10
Germany) was used. It measures the backscattered signal intensity S and the Doppler shift of reflected sound pulses. From S, which is mainly influenced by small temperature fluctuations, the position of the inversion layer can be estimated. The three-dimensional wind vector is derived from the Doppler shift. The instrument was operated on a continuous basis during the whole SATURN experiment. A more 15
detailed introduction about acoustic remote sensing can be found inNeff and Coulter (1986).
Furthermore, radiosondes were launched during the whole measurement period several times each day. Two different types of radiosondes (Graw DFM90 and Vaisala 20
RS80-A) were utilized to measure profiles of temperature, pressure, and relative humidity. As the Graw types were additionally equipped with a GPS receiver, they were applied to determine the actual wind velocity and direction.
SO2 and NH3 concentrations were measured at the Melpitz site on a continuous 25
basis.
For the SO2measurements a pulsed fluorescence gas monitor (Model 43s, Thermo Environmental Instruments Inc., USA) was used. For calibration trace gas quantities, of SO2 prepared from a test gas cylinder with audit certificate (Messer Griesheim,
ACPD
3, 1693–1731, 2003 New-particle formation: SATURN F. Stratmann et al. Title Page Abstract Introduction Conclusions References Tables Figures J I J I Back Close Full Screen / EscPrint Version Interactive Discussion
c
EGU 2003 Germany) in combination with a gas mixer (Environics 2000, USA), were used.
Ammonia was measured with an wet annular denuder system (Slanina et al.,1992; Wyers et al., 1993). The analysis in this system is made by membrane diffusion of NH3at high pH into a counter flow of de-ionized water, with an online measurement of conductivity.
5
2.4. Ground-based measurements of particle size distributions
Particle number size distributions were measured in the particle size range 3 < Dp <
800 nm at all three measurement sites. For that purpose, Twin Differential Mobility Particle Sizer (TDMPS) systems were used (designed byBirmili et al.,1999) compris-ing two size spectrometers that simultaneously measure different particle size ranges 10
at dry conditions. Nucleation mode particles (3 < Dp < 22 nm) were measured with
an Ultrafine Differential Mobility Analyzer (Hauke type) in conjunction with an Ultra-fine Condensation Particle Counter (UCPC, Model 3025, TSI Inc., St. Paul, MN, USA). Particles in the range from 22 < Dp < 800 nm were measured by means of a
Dif-ferential Mobility Analyzer (Hauke type) and a CPC (TSI-Model 3010). In Melpitz, the 15
total particle number concentration (3 < Dp < 1000 nm) was additionally measured
using a UCPC (TSI-Model 3025). The inlets used at the three sites were commercially available low-flow PM10 inlets (Thermo Anderson, Smyrna, GA, USA).
2.5. LIDAR
To gain information about structure and development of the planetary boundary layer 20
(PBL), a multiwavelength aerosol Raman lidar (Mattis et al.,2002) was used at the IfT site. This instrument delivers the particle volume 180◦-backscatter coefficient at 355, 532, and 1064 nm wavelength and the particle volume extinction coefficients at 355 and 532 nm wavelenght as well as temperature and water-vapor mixing ratios. The LIDAR is part of the European Aerosol Research Lidar Network (EARLINET,B ¨osenberg et al., 25
ACPD
3, 1693–1731, 2003 New-particle formation: SATURN F. Stratmann et al. Title Page Abstract Introduction Conclusions References Tables Figures J I J I Back Close Full Screen / EscPrint Version Interactive Discussion
c
EGU 2003
3. Meteorological situation
The SATURN experiment took place from 27 May to 14 June 2002. During this time period new-particle formation events were observed on 8 days. This paper focus on observations conducted on 3 June 2002.
5
The large-scale meteorological situation on 3 June 2002 is depicted in Fig. 4. During this day, the weather in central Europe was mainly influenced by a high-pressure system ranging from Northern Scandinavia over central Europe to the south-east of the Mediterranean. A low-pressure system with its frontal system west of Great Britain had no influence on the weather in the experimental site. Calm winds 10
from southeasterly directions and sunny weather prevailed on 3 June 2002. Only a few convective clouds developed at noon.
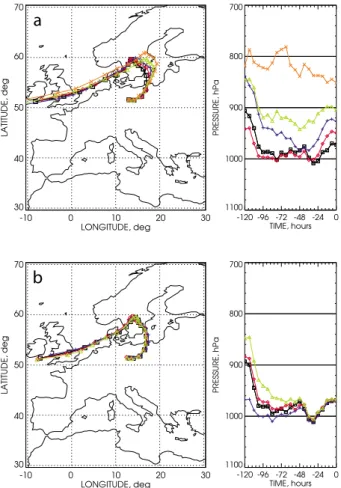
Figure5shows a 120-h sequence of the backward trajectories for arrival heights of 15
400, 600, 800, 1000, and 1500 m asl at Melpitz at 09:00 UTC and for an arrival height of 400 m asl at the stations Collm, Leipzig, Melpitz, and Panitzsch at 11:00 UTC. These three-dimensional backward trajectories were calculated with the flexible trajectory model FLEXTRA (version 3.2d) (Stohl et al.,1995). FLEXTRA was driven with hemi-spheric model-level wind fields provided by the European Centre for Medium-Range 20
Weather Forecasts (T213 L31 model, ECMWF, 1998), with a horizontal resolution of 0.5◦ and a time resolution of 3 h (analyses at 00:00, 06:00, 12:00, 18:00 UTC; 3-h forecasts at 03:00, 09:00, 15:00, 21:00 UTC).
The air was advected from the North Atlantic, crossed Great Britain, the North 25
Sea, and southern Scandinavia. Then the flow turned south-westward over the Baltic Sea. For about 24 h the air mass traveled over continental sites in northern Poland before it reached the experimental area from the East. The flow pattern in the lowest
ACPD
3, 1693–1731, 2003 New-particle formation: SATURN F. Stratmann et al. Title Page Abstract Introduction Conclusions References Tables Figures J I J I Back Close Full Screen / EscPrint Version Interactive Discussion
c
EGU 2003 1500 m of the atmosphere did not change significantly, neither with time nor with
height, during the entire day. Only the turning point over the Baltic Sea moved slowly eastward. This movement caused the air masses that arrived in the late afternoon to spend an additional 6–12 h over land.
5
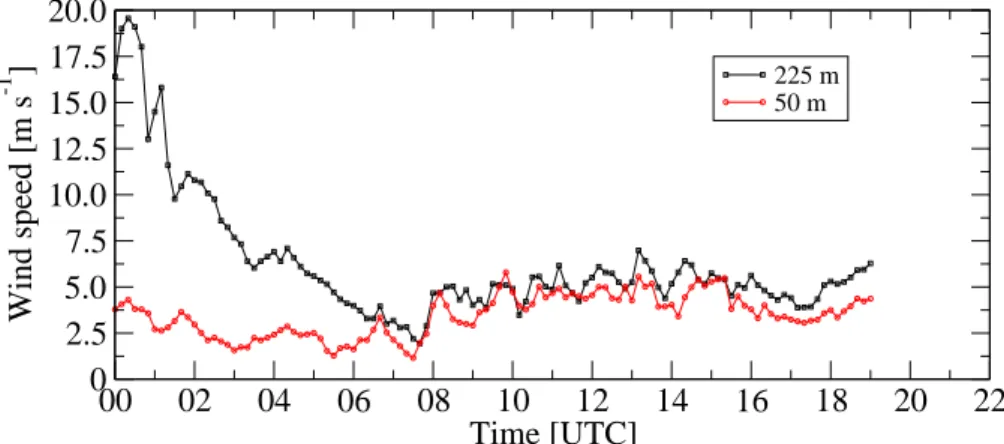
Figure 6 shows time series of the horizontal wind speed in 50 and 225 m on the 3 June 2002 in Melpitz, as measured with the SODAR system. The horizontal wind speed in 50 m was about 3–4 m s−1during night and increased slightly in the morning (around 08:00 UTC) to values of 4–6 m s−1 over the day. In the first part of the day much higher values of the wind speed were observed in 225 m. After the maximum of 10
20 m s−1was reached between 00:00 and 01:00 UTC, the wind speed decreased until 07:00 UTC to values similar to those measured in 50 m. This increased wind speed is due to a shallow low-level jet which occurred during night in the stable boundary layer (SBL) close to the inversion. For a general description of the PBL the reader is referred to textbooks like e.g. Stull (1988). The lack of data after 19:00 UTC is due to 15
a negative signal-to-noise ratio for the level in 225 m.
Figure 7 shows a time-height contour plot of the back-scattered signal intensity
S measured with SODAR for the same time as Fig. 6. According to Beyrich and Weill (1993) the height of the SBL (resp. the nocturnal inversion layer (IL) depth) is 20
indicated by the maximum of the vertical gradient of the signal S. In Fig. 7 a local maximum of this gradient is identified around 200 m between 00:00 and 03:00 UTC. After 03:00 UTC (sunrise) the gradient became smaller and the height of the maximum varied between 150 and 260 m. At about 07:00 UTC the nocturnal IL broke up and intensive vertical mixing started. Within about one hour the mixed layer (ML) rose from 25
about 260 m to higher than the ceiling of the SODAR. After sunset (19:20 UTC) again a strong vertical gradient of S with a maximum in about 150 m developed.
humid-ACPD
3, 1693–1731, 2003 New-particle formation: SATURN F. Stratmann et al. Title Page Abstract Introduction Conclusions References Tables Figures J I J I Back Close Full Screen / EscPrint Version Interactive Discussion
c
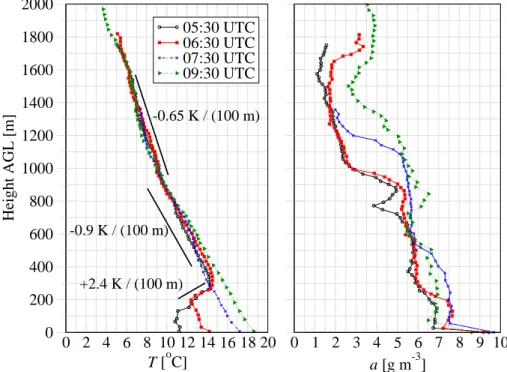
EGU 2003 ity a (right) as measured with radiosondes (Vaisala RS80). The first two profiles
(launched at 05:30 and 06:30 UTC) show the pronounced IL with positive temperature gradients of +2.4 K (100 m)−1 below 260 m. In the residual layer (RL), between the inversion and about 1000 m, the gradient is −0.9 K (100 m)−1, that is, this layer is neutrally stratified. Above the RL, the atmosphere is slightly stably stratified with a 5
mean gradient of about −0.65 K (100 m)−1. The solid lines with the gradients in Fig.8 refer to the sounding from 06:30 UTC. The next two profiles (07:30 and 09:30 UTC) show the situation after the inversion broke up, no inversion can be found over the complete profile. This is in good agreement with the SODAR measurements. The humidity profiles show a local maximum below the inversion (first two profiles). A 10
second jump is seen in 1000 m, which is also an indication for the height of the RL. After the ground inversion disappeared, the humidity profiles show no significant structures up to the PBL height in 1200 m (07:30 UTC) and 1400 m (09:30 UTC), respectively.
15
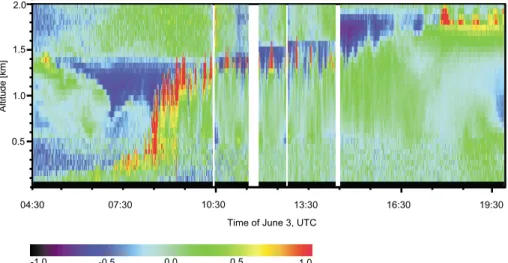
Figure9shows the development of the PBL between 04:30 UTC and 19:50 UTC on 3 June 2002, as measured with LIDAR at the IfT site in Leipzig. The time-height contour plot represents a measure of relative particle back-scattering:
Prel(z)= P (z) − ¯P (z) ¯
P (z) . (1)
Here P (z) is the actual LIDAR signal at height z detected with a resolution of 60 m 20
and 30 s and ¯P (z) is the average signal at height z for a given measurement period.
The periods are separated by white vertical bars in Fig.9. Relative back-scatter values are shown, because measurements close to the LIDAR (i.e. close to the ground) are usually biased by the incomplete overlap between the laser beam and the receiver’s field of view. In the case of relative back-scattering after Eq. (1) this overlap effect is 25
canceled out. Thus, the observations cover the entire PBL. Note that the LIDAR is sensitive to optically active particles only, i.e. back-scattering is dominated by particles
ACPD
3, 1693–1731, 2003 New-particle formation: SATURN F. Stratmann et al. Title Page Abstract Introduction Conclusions References Tables Figures J I J I Back Close Full Screen / EscPrint Version Interactive Discussion
c
EGU 2003 with diameters >100 nm.
According to Eq. (1), bluish-green colors in Fig. 9 (Prel ∼ 0) indicate atmospheric regions with marginal changes in particle back-scattering, whereas blue (Prel < 0)
and red colors (Prel > 0) show strong negative and positive deviations from the mean,
respectively. A rapid change between red and blue colors marks the atmospheric 5
height regions of strongest dynamic activity, where particle-rich air is transported upwards and cleaner air moves downward. The SBL is observed in 200 m height between 04:30 and about 07:00 UTC. First up-drafts developed below 400 m height between 07:00 and 08:00 UTC. A rapid increase of the mixed layer from 300 to 1400 m associated with strong dynamic activity was observed between 08:00 and 09:30 UTC. 10
From 09:30 to 15:00 UTC only slight variations of the PBL height around 1500 m occurred. In the late afternoon, a further increase of the PBL height to values around 1700 m, probably associated with a change in the air-mass, was found.
At both experimental sites, Melpitz and Leipzig, a similar development of the 15
PBL was observed. During the cloudless night, a SBL developed about 200 m in depth. Above the inversion, the RL up to 1000 m in Melpitz and about 1400 m in Leipzig was clearly identified. Extensive vertical mixing started after the inversion broke up at both sites. At the Melpitz site, the first plumes reached heights of 500 m at about 08:00 UTC, while at Leipzig this height was reached about 0.5 h later. This time 20
shift might be due to cirrus clouds which were observed above Leipzig but not over Melpitz. These clouds may delay the warming of the lower air masses and, therefore, the convective mixing of the PBL.
ACPD
3, 1693–1731, 2003 New-particle formation: SATURN F. Stratmann et al. Title Page Abstract Introduction Conclusions References Tables Figures J I J I Back Close Full Screen / EscPrint Version Interactive Discussion c EGU 2003 4. Observations in Melpitz 4.1. Ground-based observations
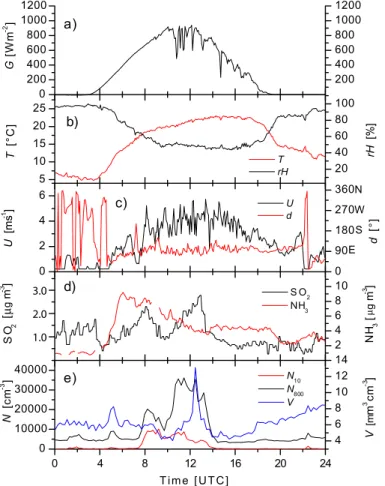
Figure10 shows results from the ground-based measurements of global radiation G, temperature T , relative humidity RH, wind speed v , wind direction d i r, SO2, and NH3 concentration, particle number concentration N (3–10 nm and 3–800 nm) and calcu-5
lated particle volume concentration V as function of time as determined in Melpitz on June 3, 2002.
From Figs.10a-c, it can be seen, that June 3 featured an increase in global radiation (a radiation maximum near 1000 W m−2) and temperature, and decreasing relative humidity during morning hours. Around 10:00 UTC the global radiation decreased and 10
varied afterwards due to small cumulus clouds. The wind speed was close to zero during the night and increased up to 4 ms−1during the day forced by convection. The mean wind direction during the day was from east.
The SO2concentration (Fig.10d) shows two peaks, the first one at 08:00 UTC, i.e. half an hour after the break-up of the nocturnal inversion layer (up to 900 ppt) and a 15
second one at 12:00 UTC (up to 1050 ppt). The ammonia concentration (Fig. 10 d) increases fast in the early morning from 1 up to 9 µg m−3. During daytime the NH3 concentration is about 4–6 µg m−3.
As can be seen in Fig. 10 e, the number concentrations (N10: 3–10 nm and N800: 3–800 nm) show a significant increase at 07:30 UTC. N800 featured a second, higher 20
maximum between 10:30 and 12:00 UTC. The volume concentration, as calculated from the number size distribution shows no correlation with the first morning maximum, it is even slightly decreasing between 08:00 and 10:00 UTC.
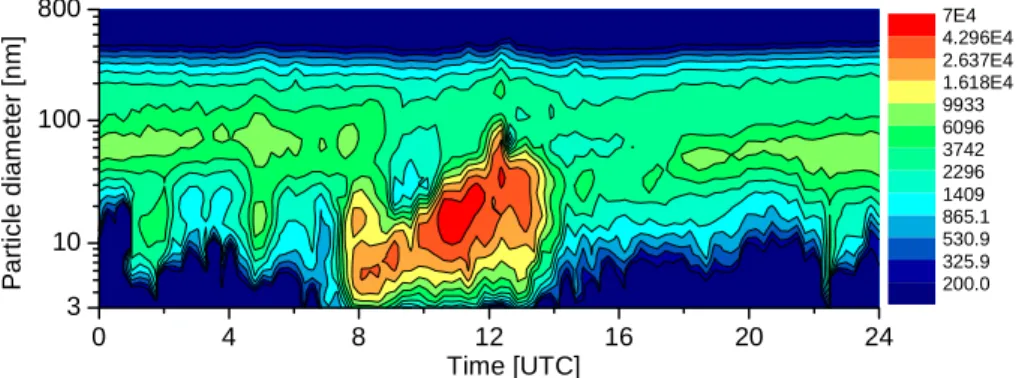
In Fig. 11 the diurnal variation of the number size distributions as measured at 25
ACPD
3, 1693–1731, 2003 New-particle formation: SATURN F. Stratmann et al. Title Page Abstract Introduction Conclusions References Tables Figures J I J I Back Close Full Screen / EscPrint Version Interactive Discussion
c
EGU 2003 Approximately at 07:30 UTC, analogue to Fig. 10e, a rapid increase in number
concentration of particles with diameters between 3 and 20 nm is observed. This increase coincides with the break-up of the nocturnal inversion at around 07:30 UTC (see Fig. 7) and the first increase in SO2 concentration (Fig. 10d). In the particle size range below 20 nm, the particle size distribution at this time is bimodal featuring 5
local maxima at approximately 5 and 15 nm. With increasing time, both maxima shift towards larger particle sizes with the lower maximum becoming more pronounced. Simultaneously, new particle formation and growth are taking place. Between 10:30 and 12:00 UTC (see also Fig. 10e), an absolute maximum located around 20 nm appears. The occurrence of this maximum coincides with the appearance of small 10
cumulus clouds (see Fig.10a) and the second increase in SO2concentration.
The ground-based observations at the Melpitz site showed, that newly formed particles occur from the beginning of the break-up of the nocturnal inversion until the mixing layer has reached the top of the PBL in around 1000 m after a few hours (cf. 15
Fig. 9 for Leipzig). Assuming a particle diameter of 1 nm for the freshly nucleated particles and a reasonable growth rate of 6 nm/h (Lehtinen and Kulmala, 2002) nucleated particles grow within half an hour to a diameter of 4 nm. This time is comparable with the time scale of the evolving PBL discussed before. Consequently it may be concluded that at the Melpitz site on June 3, 2002, new particle formation 20
is induced by the break-up of the nocturnal inversion and proceeds throughout the evolution process of the PBL. The occurrence of the second local size distribution maximum at around 15 nm maybe explained by the mixing down of particles that were newly formed and grew up to larger sizes inside the RL before the break-up of the nocturnal inversion. This hypothesis is supported by the balloon-borne observations 25
ACPD
3, 1693–1731, 2003 New-particle formation: SATURN F. Stratmann et al. Title Page Abstract Introduction Conclusions References Tables Figures J I J I Back Close Full Screen / EscPrint Version Interactive Discussion
c
EGU 2003 4.2. Balloon-borne observations
Several vertical profiles and time series at a constant level were measured with ACTOS in Melpitz on 3 June 2002.
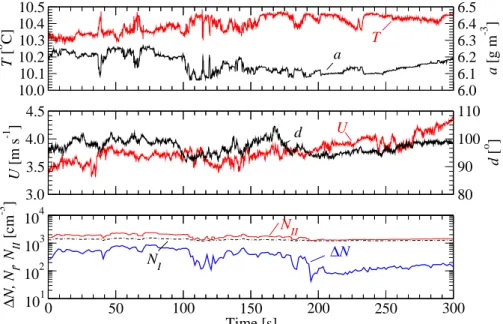
The first time series (Fig. 12) was measured at a height of 830 m from 06:26 to 5
06:30 UTC in the RL well above the inversion at 200 m. The time series of T and
a show strong fluctuations with standard deviations of about σT = 0.05 K and σa =
0.08 g m−3, respectively. Most of the fluctuations of the thermodynamic variables were observed within the first 200 s. The mean horizontal wind speed U was 3.8±0.15 m s−1 from easterly directions. Particle number concentrations are plotted on a logarithmic 10
scale. For the particles between 12 and 1500 nm the concentration NI was around 1300 ± 100 cm−3 whereas the concentration NII which includes the smaller particles was at 1700 ± 320 cm−3. Small particles show maximum concentrations∆N of several 100 cm−3 in the first 200 s where σT and σaare higher.
15
Results from the following descent (starting at 06:31 UTC) from 830 m to ground are plotted in Fig.13. The temperature profile indicates an inversion between 150 and 200 m with a mean gradient of about+2.8 K (100 m)−1. Between 200 and 330 m the gradient is close to zero. For higher altitudes the profile shows an adiabatic lapse rate of −1 K (100 m)−1.
20
The water-vapor density shows strong fluctuations inside the ML with a slight decrease in the inversion from about 9.5 to 7 g m−3. In the first 100 m above ground,
U is close to 2 m s−1 and exhibits a local maximum around the inversion. In the RL,
U varies between 3 and 4 m s−1 from easterly directions. The number concentration profiles show a clear cut between the ML, inversion, and RL. Inside the ML , NII is 25
nearly constant with height and includes about 250 particles cm−3smaller than 10 nm. In a narrow region above the inversion (between 250–300 m), no small particles could be observed. Above,∆N increases up to values of 800 cm−3between 400 and 600 m.
ACPD
3, 1693–1731, 2003 New-particle formation: SATURN F. Stratmann et al. Title Page Abstract Introduction Conclusions References Tables Figures J I J I Back Close Full Screen / EscPrint Version Interactive Discussion
c
EGU 2003 In this layer, ∆N varies in the same range as in the time series shown in Fig. 12. A
similar behavior can be observed for the SO2concentration profile, which also features a local minimum around 300 m.
Taking ∆N as an indicator for the presence of newly formed particles, the above 5
profiles suggest, that between 06:26 and 06:53 UTC, new particle formation is taking place below the inversion and in the RL. However, ground-based NO and particle size distribution observations suggest that below the inversion the presence of small particles was most likely due to traffic emissions. Nevertheless, traffic emissions cannot explain large values of∆N in the RL. These small particles were most likely 10
formed by nucleation as no other local sources were present.
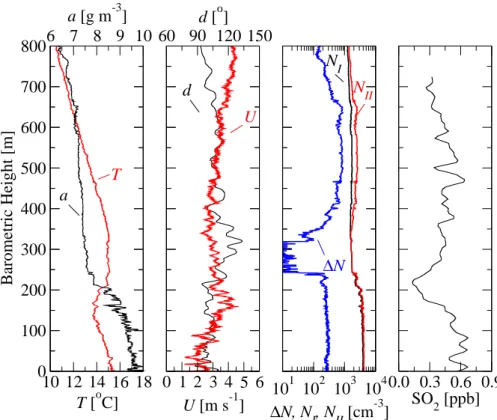
Figure 14 shows vertical profiles about 2 h later compared to the profiles depicted in Fig. 13. The profiles were measured during an ascent from ground to 610 m. The inversion in 200 m had disappeared and T shows a near-adiabatic lapse rate of −0.9 K (100 m)−1 over the complete altitude range. The profile of a features some 15
fluctuations over the complete profile but a sharp decrease in 550 m, i.e. in the same height where a small increase of T can be observed. In 350 m, a has a local maximum which corresponds with a change of the wind direction from south-east to north-east and an increased U . The particle concentrations show high values from the ground up to 550 m. In this range∆N varies between 1000 and 5000 cm−3 and NII between 20
2000 and 12000 cm−3, respectively. Above 550 m ∆N decreases rapidly to zero and
NII ≈ NI to about 1800 cm−3. The SO2-profile is nearly height independent with values around 0.3 ppb.
After these vertical profiles were taken, the balloon was fixed at 600 m again. 25
The corresponding time series (Fig. 15), started about 10 min after the maximum height of the profiles shown in Fig.14 was reached. The time series of T and a but also U and d show very similar structure, periods with high fluctuations are interrupted by periods with nearly no structure. The same intermittent behavior is seen in the
ACPD
3, 1693–1731, 2003 New-particle formation: SATURN F. Stratmann et al. Title Page Abstract Introduction Conclusions References Tables Figures J I J I Back Close Full Screen / EscPrint Version Interactive Discussion
c
EGU 2003 particle number concentrations. Most significant is ∆N which shows variations of
several orders of magnitude with maximum values of 4000 to 5000 cm−3. The total concentration NII varies between 1300 cm−3, which seems to be the background concentration (cf. also Fig.12), and maximum values of up to 12000 cm−3 between
t = 300 and 340 s. This behavior can be explained with up-drafts which temporarily
5
penetrate into the RL. Therefore, sometimes ACTOS is inside of such an up-draft with highly increased turbulence and sometimes ACTOS is inside the RL where the turbulence is much weaker and NP is much less than in the ML.
This all together indicates, that at this stage, the ML has a height of about 550 m. 10
Taking again∆N as an indicator for the presence of newly formed particles, the above profiles suggest, that between 08:43 and 09:05 UTC, new particle formation is taking place in the entire ML while inside the RL no newly formed particles were observed.
5. Comparison of particle size distributions at Melpitz, Collm, Panitzsch sites
Figure16shows the diurnal variation of the normalized number size distributions for the 15
three ground-based measurement sites on 3 June 2002. Each number size distribution measured by the TDMPS-systems was divided by the total number concentration from 3 to 800 nm to emphasize the location, i.e. the particle diameter, of the size distribution local maxima independent of the total number concentration. The observations at the Melpitz and Collm sites show a rapid increase in number concentration of particles 20
with diameters between 3 and 20 nm and the particle size distributions feature local maxima at approximately 5 and 15 nm. At the Panitzsch site, however, below 20 nm, only one local maximum occurs which is located around 15 nm. Compared to the Melpitz and Collm sites, the occurrence of this maximum is delayed by approximately half an hour in accordance with the delayed break-up of the nocturnal inversion layer 25
as detected by the LIDAR-system at the Ift site about 10 km away. At the Panitzsch site, no local maximum at 5 nm was observed. This suggests that at the this site, new
ACPD
3, 1693–1731, 2003 New-particle formation: SATURN F. Stratmann et al. Title Page Abstract Introduction Conclusions References Tables Figures J I J I Back Close Full Screen / EscPrint Version Interactive Discussion
c
EGU 2003 particle formation is significantly weaker throughout the evolution process of the PBL.
Considering the distances between the three sites, it is concluded that new particle formation is not a local phenomenon but its magnitude may vary locally to a significant extend.
6. Summary
5
In this work, first results from the SATURN experiment have been presented. During the experiment, vertical soundings of meteorological parameters and particle number concentrations were carried out utilizing a balloon-borne measurement platform. In ad-dition, ground-based measurements of particle number size distributions and gaseous precursor concentrations took place at the balloon site. At two additional locations 10
(distance to the balloon site about 40 km), particle number size distributions were mea-sured. The vertical structure and the development of the PBL were observed utilizing a SODAR (at the ballon site) and a LIDAR system (distance about 50 km to the balloon site).
The SATURN experiment took place from 27 May to 14 June 2002. During this time 15
period new-particle formation events were observed on 8 days. This paper focused on observations conducted on 3 June 2002 which was a typical radiation day. During night, a nocturnal inversion layer up to 200 m had developed below the overlaying RL. At around 07:00 UTC the inversion broke up and extensive vertical mixing increased the height of the ML up to about 1400 m in the afternoon. From the ground-based ob-20
servations at the Melpitz site it was concluded that on 3 June 2002, new particle forma-tion was induced by the break-up of the nocturnal inversion and proceeded throughout the evolution process of the PBL. The occurrence of a second local size distribution maximum in the particle size range below 20 nm was explained by the mixing down of particles that were newly formed and grew up to larger sizes inside the RL before the 25
break-up of the nocturnal inversion. This hypothesis was supported by balloon-borne observations performed before the break-up of the nocturnal inversion. Balloon-borne
ACPD
3, 1693–1731, 2003 New-particle formation: SATURN F. Stratmann et al. Title Page Abstract Introduction Conclusions References Tables Figures J I J I Back Close Full Screen / EscPrint Version Interactive Discussion
c
EGU 2003 observations carried out after the break-up of the nocturnal inversion indicated that
new particle formation was taking place in the entire ML while inside the RL no newly formed particles were observed. Comparing the particle size distributions observed at the three measurement sites, it was found that at two sites the evolution of the particle size distributions was similar. At the third site, in the particle size range below 20 nm, 5
only particles supposedly formed in the RL and almost no newly formed particles were observed.
Summarizing the presented results it can be stated that new particle formation a) may take place inside the RL before the break-up of the nocturnal inversion, b) may be induced by the the break-up of the nocturnal inversion, c) may proceed during the 10
evolution of the PBL, d) is not a local phenomena but d) may vary locally to a significant extend.
Acknowledgements. The authors acknowledge, the German Bundeswehr for their kind
provi-sion of the tethered balloon MAPS-Y, G. Sanftleben and his co-workers from the Bundeswehr Technical Centre for Ships and Naval Weapons for their excellent and very cooperative opera-15
tion of the tethered balloon, J. Str ¨uning and co-workers from the Office of Military Geophysics for his support, the Ift department heads (J. Heintzenberg, H. Herrmann, E. Renner) for making available the necessary financial resources, T. Conrath, A. Gr ¨uner, J. Hanss and the staff of the Collm observatory for supplying the needed and important technical support and A. Nowak for providing his meteorological expertise. Without all these contributors, the SATURN experiment 20
would have been impossible!
References
Banse, D. F., Esfeld, K., Hermann, M., Sierau, B., and Wiedensohler, A.: Particle counting efficiency of the TSI CPC 3762 for different operating parameters, J. Aerosol Sci., 32, 157– 161, 2001. 1698
25
Beyrich, F. and Weill, A.: Some aspects of determination the stable boundary layer depth from SODAR data, Boundary-Layer Meteorol., 63, 97–116, 1993. 1702
ACPD
3, 1693–1731, 2003 New-particle formation: SATURN F. Stratmann et al. Title Page Abstract Introduction Conclusions References Tables Figures J I J I Back Close Full Screen / EscPrint Version Interactive Discussion
c
EGU 2003 Bigg, E. K.: A mechanism for the formation of new particles in the atmosphere, Atm. Res., 43,
129-137, 1997. 1695
Birmili, W., Stratmann, F., and Wiedensohler, A.: Design of a DMA-based Size Spectrometer for large particle size range and stable operation, J. Aerosol Sci., 30, 4, 549–554, 1999. 1700
Birmili, W. and Wiedensohler, A.: New particle formation in the continental boundary layer: 5
Meteorological and gas phase parameter influence, Geophys. Res. Lett., 27, 3325–3328, 2000. 1694
B ¨osenberg, J., Ansmann, A., Baldasano, J. M., Balis, D., B ¨ockmann, C., Calpini, B.,, Chaikovski, A., Flamant, P., Hagard, A., Mitev, V., Papayannis, A., Pelon, J., Resendes, D., Schneider, J., Spinelli, N., Trickl, T., Vaughan, G., Visconti, G. and Wiegner, M.: EARLINET: 10
A European Aerosol Research Lidar Network, in ’Advances in Laser Remote Sensing’, A. Dabas, C. Loth, and J. Pelon (eds.), Ecole Polytechnique, 91128 Palaiseau, France, 155– 158, 2001. 1700
Buzorius, G., Rannik, U., M ¨akel ¨a, J. M., Vesala, T., and Kulmala, M.: Vertical aerosol particle fluxes measured by eddy covariance technique using condensational particle counter, J. 15
Aerosol Sci., 29, 157–171, 1998. 1698
Charlson, R. J. and Heintzenberg, J. (eds.), Aerosol Forcing of Climate, John Wiley & Sons, Chichester, 1995. 1694
Clarke, A. D.: Atmospheric nuclei in the remote free troposphere, J. Atmos. Chem., 14, 479– 488, 1992. 1695
20
Dockery, D. W. and Pope, C. A.: Acute respiratory effects of particulate air pollution, Annu. Rev. 5 Public. Health, 15, 107–132, 1994. 1694
Easter, R. C. and Peters, L. K.: Binary homogeneous nucleation: Temperature and relative humidity fluctuations, nonlinearity, and aspects of new particle formation in the atmosphere, J. Appl. Met., 33, 775–784, 1994. 1695
25
ECMWF: User guide to ECMWF products 2.1, Meteorological Bulletin M3.2, ECMWF, Reading, UK, 1995. 1701
Haman, K., Malinowski, S. P., Stru´s, B. D., Busen, R., Stefko, A., and Siebert, H.: A family of ultrafast aircraft thermometers for warm and supercooled clouds and various types of aircraft, Preprints 13th International Conference on Clouds and Precipitation, Reno, NV, USA (14–18 30
August 2000). 1697
Hegg, D. A., Radke, L., and Hobbs, P. V.: Particle production associated with marine clouds, J. Geophys. Res., 95, 13 917–13 926, 1990. 1695
ACPD
3, 1693–1731, 2003 New-particle formation: SATURN F. Stratmann et al. Title Page Abstract Introduction Conclusions References Tables Figures J I J I Back Close Full Screen / EscPrint Version Interactive Discussion
c
EGU 2003 Hellmuth, O. and Helmert, J.: Parameterization of turbulence-enhanced nucleation in large
scale models: Conceptual study, Air Pollution Modeling and Its Application, XV, edited by Bor-rego and Schayes, Kluwer Academic/Plenum Publishers, New York, 295–304, 2002. 1695
Hoppel, W. A., Frick, G. M., Fitzgerald, J. W., and Larson, R. E.: Marine boundary layer mea-surements of new particle formation and the effects nonprecipitating clouds clouds have on 5
the aerosol size distribution, J. Geophys. Res., 99, 14443–14459, 1994. 1694
Keil, A. and Wendisch, M.: Bursts of Aitken mode and ultrafine particles observed at the top of continental boundary layer clouds, J. Aerosol Sci., 32, 649–660, 2001. 1695
Lehtinen, K. E. J. and Kulmala, M.: A model for particle formation and growth in the atmosphere with molecular resolution in size, Atmos. Chem. Phys. Discuss., 2, 1791–1807, 2002 1706
10
M ¨akel ¨a, J. M., Aalto, P., Jokinen, V., Pohja, T., Nissinen, A., Palmroth, S., Markkanen, T., Seitsonen, K., Lihavainen, H., and Kulmala, M.: Observations of ultrafine aerosol particle formation and growth in boreal forest, Geophys. Res. Lett., 24, 1219–1222, 1997. 1694
Mattis, I., Ansmann, A., Althausen, D., Jaenisch, V., Wandinger, U., M ¨uller, D., Arshinov, Y. F., Bobrovnikov, S. M., and Serikov, I. B.: Relative-humidity profiling in the troposphere with a 15
Raman lidar, Appl. Opt., 41, 6451–6462, 2002. 1700
McMurry, P. H., Woo, K. S., Weber, R. J., Chen, D.-R., and Pui, D. Y. H.: Size distributions of 3-10 nm atmospheric particles: implications for nucleation mechanisms, Phil. Trans. R. Soc. Lond. A, 358, 2625–2642, 2000. 1694
Neff, W. D. and Coulter, R. L.: Acoustic Remote Sensing, Probing the atmospheric boundary 20
layer., 239 p, D. H. Lenschow (Ed.). American Meteorological Society, Boston, USA, 1986.
1699
Nilsson, E. D. and Kulmala, M.: The potential for atmospheric mixing processes to enhance the binary nucleation rate, J. Geophys. Res., 103, 1381–1389, 1998. 1695
Nilsson, E. D., Pirjola, L., and Kulmala, M.: The effect of atmospheric waves on aerosol nucle-25
ation and size distribution, J. Geophys. Res., 105, 19 917–19 926, 2000. 1695
O’Dowd, C, McFiggans, G., Creasey, D. J., Pirjola, L., Hoell, C., Smith, M. H., Allan, B. J., Plane, J. M. C., Heard, D. E., Lee, J. D., Pilling, M. J., and Kulmala, M.: On the photochemical production of new particles in the coastal boundary layer, Geophys. Res. Lett., 26, 1707– 1710, 1999. 1694
30
Pirjola, L., Laaksonen, A., Aalto, P., and Kulmala, M.: Sulfate aerosol formation in the Arctic boundary layer, J. Geophys. Res., 103, 8309-8321, 1998. 1694
ACPD
3, 1693–1731, 2003 New-particle formation: SATURN F. Stratmann et al. Title Page Abstract Introduction Conclusions References Tables Figures J I J I Back Close Full Screen / EscPrint Version Interactive Discussion
c
EGU 2003 in the midlatitude free troposphere and tropopause region, Atmos. Res., 44, 333–356, 1997.
1695
Siebert, H. and Muschinski, A.: Relevance of a Tuning-Fork Effect for Temperature Measure-ments with the Gill Solent HS Ultrasonic Anemometer-Thermometer, J. Atmos. Oceanic Tech., 18, 1367–1376, 2001. 1697
5
Siebert, H.: Tethered-balloon borne turbulence measurements in the cloudy boundary layer. Ph.D. thesis, University of Leipzig, Germany, 2001. 1698
Siebert, H., Wendisch, M., Conrath, T., Teichmann, U., and Heintzenberg, J.: A new tethered balloon-borne payload for fine-scale observations in the cloudy boundary layer, Boundary-Layer Meteorol., 106, 461–482, 2003. 1697,1698
10
Slanina, J., de Wild, P. J., and Wyers, G. P.: The application of denuder systems to the analysis of atmospheric components in: Gaseous pollutants characterization and cycling, Advances in Environmental Science and Technology , Ed. J. O. Nriagu, John Wiley and Sons Ltd, New York, USA, 24, 1992. 1700
Spindler, G., M ¨olders, N., Hanss, J., Beier, N., and Kramm, G.: Determining the dry deposition 15
of SO2, O3, NO, and NO2 at the SANA core station Melpitz, Meteorol. Zeitschift, N.F. 5,
205–220, 1996. 1696
Spindler, G., Teichmann, U., and Sutton, M. A.: Ammonia dry deposition over grassland – micrometeorological flux-gradient measurements and bidirectional flux calculation using an inferential model, Q.J.R. Meteorol. Soc., 127, 795–814, 2001. 1696
20
Stohl, A., Wotawa, G., Seibert, P., and Kromp-Kolb, H.: Interpolation errors in wind fields as a function of spatial and temporal resolution and their impact on different types of kinematic trajectories, J. Appl. Meteor., 34, 2149–2165, 1995. 1701
Stull, R. B.: An introduction to boundary layer meteorology, Kluwer Academic Publishers, Dor-drecht, The Netherlands, 666, 1988. 1702
25
Uhrner, U., Birmili, W., Stratmann, F., Wilck, C., Ackermann, I. J., and Berresheim, H.: Particle Formation at a Continental Background Site: Comparison of Model Results with Observa-tions., Atmos. Chem. Phys. Discuss., 2, 2413–2448, 2002. 1695
Weber, R. J., Marti, J. J., McMurry, P. H., Eisele, F. L., Tanner,D. J., and Jefferson, A.: Mea-surements of new particle formation and ultrafine particle growth rates at a clean continental 30
site, J. Geophys. Res., 102, 4375–4385, 1997. 1694
Weber, R. J., McMurry, P. H., Mauldin, R. L., Tanner, D. J., Eisele, F. L., Clarke, A. D., and Kapustin, V. N.: New particle formation in the remote troposphere: A comparison of
obser-ACPD
3, 1693–1731, 2003 New-particle formation: SATURN F. Stratmann et al. Title Page Abstract Introduction Conclusions References Tables Figures J I J I Back Close Full Screen / EscPrint Version Interactive Discussion
c
EGU 2003 vations at various sites, Geophys. Res. Lett., 26, 307–310, 1999. 1695
Wiedensohler, A., Covert, D. S., Swietlicki, E., Aalto, P., Heintzenberg, J., and Leck, C.: Occur-rence of an ultrafine particle mode less than 20 nm in diameter in the marine boundary layer rence 20 during Arctic summer and autumn, Tellus, 48B, 213–222, 1996. 1694
Wiedensohler, A., Hansson, H.-C., Orsini, D., Wendisch, M., Wagner, F., Bower, K. N., Choular-5
ton, T. W., Wells, M., Parkin, M., Acker, A., Wieprecht, W., Fachini, M. C., Lind, J. A., Fuzzi, S., Arends, B. G. and Kulmala, M.: Night-time formation and occurrence of new particles associated with orographic clouds, Atmos. Environ. 31, 2545–2559, 1997. 1695
Wyers, G. P., Otjes, R. P., and Slanina, J.: A continuous-flow denuder for the measurement of ambient concentrations and surface-excange of ammonia, Atmos. Environ., 27A, 2085– 10
ACPD
3, 1693–1731, 2003 New-particle formation: SATURN F. Stratmann et al. Title Page Abstract Introduction Conclusions References Tables Figures J I J I Back Close Full Screen / EscPrint Version Interactive Discussion c EGU 2003 Leipzig Torgau MELPITZ PANITZSCH COLLM IFT Eilenburg Wurzen Delitzsch Bitterfeld Grimma km Fig. 1. Map of the measurement sites during SATURN.
ACPD
3, 1693–1731, 2003 New-particle formation: SATURN F. Stratmann et al. Title Page Abstract Introduction Conclusions References Tables Figures J I J I Back Close Full Screen / EscPrint Version Interactive Discussion
c
EGU 2003
Fig. 2. The tethered-balloon borne payload ACTOS with ultrasonic anemometer (sonic),
ACPD
3, 1693–1731, 2003 New-particle formation: SATURN F. Stratmann et al. Title Page Abstract Introduction Conclusions References Tables Figures J I J I Back Close Full Screen / EscPrint Version Interactive Discussion
c
EGU 2003
ACPD
3, 1693–1731, 2003 New-particle formation: SATURN F. Stratmann et al. Title Page Abstract Introduction Conclusions References Tables Figures J I J I Back Close Full Screen / EscPrint Version Interactive Discussion
c
EGU 2003
ACPD
3, 1693–1731, 2003 New-particle formation: SATURN F. Stratmann et al. Title Page Abstract Introduction Conclusions References Tables Figures J I J I Back Close Full Screen / EscPrint Version Interactive Discussion c EGU 2003 a b
Fig. 5. Backward trajectories with arrival at (a) Melpitz on 3 June 2002, 09:00 UTC, and (b)
Collm (black), Leipzig (red), Melpitz (blue), and Panitzsch (green) on 3 June 2002, 11:00 UTC. The arrival heights are (a) 400 (black), 600 (red), 800 (blue) , 1000 (green), and 1500 m a.s.l. (orange) and (b) 400 m a.s.l. (right panels, time 0). The left panels present a horizontal projection of the trajectories with their positions marked every 6 h.
ACPD
3, 1693–1731, 2003 New-particle formation: SATURN F. Stratmann et al. Title Page Abstract Introduction Conclusions References Tables Figures J I J I Back Close Full Screen / EscPrint Version Interactive Discussion c EGU 2003 00 02 04 06 08 10 12 14 16 18 20 22 Time [UTC] 0 2.5 5.0 7.5 10.0 12.5 15.0 17.5 20.0 Wind speed [m s -1 ] 225 m 50 m
Fig. 6. Time series of the horizontal wind speed in 50 and 225 m as measured with SODAR in
ACPD
3, 1693–1731, 2003 New-particle formation: SATURN F. Stratmann et al. Title Page Abstract Introduction Conclusions References Tables Figures J I J I Back Close Full Screen / EscPrint Version Interactive Discussion c EGU 2003 00 02 04 06 08 10 12 18 20 22 100 200 300 500 600 700 14 16 70 dB 115 dB Height [m] Time [UTC] 400 800
Fig. 7. Height-time contour plot of the back-scattered signal intensity S as measured with
ACPD
3, 1693–1731, 2003 New-particle formation: SATURN F. Stratmann et al. Title Page Abstract Introduction Conclusions References Tables Figures J I J I Back Close Full Screen / EscPrint Version Interactive Discussion c EGU 2003 0 2 4 6 8 10 12 14 16 18 20 T [oC] 0 200 400 600 800 1000 1200 1400 1600 1800 2000 Height AGL [m] 05:30 UTC 06:30 UTC 07:30 UTC 09:30 UTC 0 1 2 3 4 5 6 7 8 9 10 a [g m-3] -0.9 K / (100 m) -0.65 K / (100 m) +2.4 K / (100 m)
Fig. 8. Vertical profiles of temperature T and absolute humidity a as measured with radiosondes
ACPD
3, 1693–1731, 2003 New-particle formation: SATURN F. Stratmann et al. Title Page Abstract Introduction Conclusions References Tables Figures J I J I Back Close Full Screen / EscPrint Version Interactive Discussion c EGU 2003 19:30 16:30 13:30 10:30 07:30 04:30 0.5 1.0 1.5 2.0 Altitude [km]
Time of June 3, UTC
0.5 -0.5
-1.0 0.0 1.0
Fig. 9. Development of the planetary boundary layer in terms of the relative back-scatter signal
at 1064 nm observed with the IfT Raman LIDAR at Leipzig on 3 June 2002. The resolution is 60 m and 30 s.
ACPD
3, 1693–1731, 2003 New-particle formation: SATURN F. Stratmann et al. Title Page Abstract Introduction Conclusions References Tables Figures J I J I Back Close Full Screen / EscPrint Version Interactive Discussion c EGU 2003 µ 0 4 8 12 16 20 24 0 10000 20000 30000 40000 e) N10 N800 V N [cm -3 ] T i m e [ U T C ] d) S O 2 NH 3 SO 2 0 2 4 6 c) U d S W N U [ms ] -1 0 90 180 270 360 d [°] E 5 10 15 20 25 b) T rH T [°C] 20 40 60 80 100 rH [%] 0 200 400 600 800 1000 1200 200 400 600 800 1000 1200 a) G [Wm -2 ] 2 4 6 8 10 NH 3 [ g m -3 ] 4 6 8 10 12 14 V [m m 3 cm -3 ] 1.0 2.0 3.0 [ g m -3 ] µ
Fig. 10. Diurnal variation of global radiation G, temperature T , relative humidity rH, wind speed
U , wind direction d , SO2, NH3, particle number concentration (N10: 3–10 nm and N800:3– 800 nm) and particle volume concentration V in Melpitz on 3 June 2002, at ground.
ACPD
3, 1693–1731, 2003 New-particle formation: SATURN F. Stratmann et al. Title Page Abstract Introduction Conclusions References Tables Figures J I J I Back Close Full Screen / EscPrint Version Interactive Discussion c EGU 2003 0 4 8 12 16 20 24 3 10 100 800 Time [UTC] P a rt ic le di am e ter [n m] 200.0 325.9 530.9 865.1 1409 2296 3742 6096 9933 1.618E4 2.637E4 4.296E4 7E4
ACPD
3, 1693–1731, 2003 New-particle formation: SATURN F. Stratmann et al. Title Page Abstract Introduction Conclusions References Tables Figures J I J I Back Close Full Screen / EscPrint Version Interactive Discussion c EGU 2003 10.0 10.1 10.2 10.3 10.4 10.5 T [ o C] 6.0 6.1 6.2 6.3 6.4 6.5 a [g m -3 ] 3.0 3.5 4.0 4.5 U [m s -1 ] 80 90 100 110 d [ o ] 0 50 100 150 200 250 300 Time [s] 101 102 103 104 ∆ N, N I , N II [cm -3 ] T a d U N II NI ∆N
Fig. 12. Time series of temperature T , absolute humidity a, horizontal wind speed U , wind
direction d , particle number concentration NI (10 < Dp< 1500 nm), NII (5 < Dp< 1500 nm),
ACPD
3, 1693–1731, 2003 New-particle formation: SATURN F. Stratmann et al. Title Page Abstract Introduction Conclusions References Tables Figures J I J I Back Close Full Screen / EscPrint Version Interactive Discussion c EGU 2003 10 12 14 16 18 T [oC] 0 100 200 300 400 500 600 700 800 Barometric Height [m] 6 7 8 9 10 a [g m-3] 60 90 120 150 d [o] 0 1 2 3 4 5 6 U [m s-1] 101 102 103 104 ∆N, NI, NII[cm-3] 0.0 0.3 0.6 0.9 SO2 [ppb] T a d U ∆N NI NII
Fig. 13. Vertical profile (descent from 830 m to ground, 06:31–06:53 UTC) of temperature T ,
absolute humidity a, horizontal wind speed U , wind direction d , particle number concentration
ACPD
3, 1693–1731, 2003 New-particle formation: SATURN F. Stratmann et al. Title Page Abstract Introduction Conclusions References Tables Figures J I J I Back Close Full Screen / EscPrint Version Interactive Discussion c EGU 2003 12 14 16 18 20 T [oC] 0 100 200 300 400 500 600 700 800 Barometric Height [m] 6 7 8 9 10 a [g m-3] 60 90 120 150 d [o] 0 1 2 3 4 5 6 U [m s-1] 101102103 104 ∆N, NI, NII[cm-3] 0.0 0.3 0.6 0.9 SO2 [ppb] T a d U ∆N NI NII
Fig. 14. Vertical profile (ascent from ground to 610 m, 08:43–08:48 UTC) of temperature T ,
absolute humidity a, horizontal wind speed U , wind direction d , particle number concentration
ACPD
3, 1693–1731, 2003 New-particle formation: SATURN F. Stratmann et al. Title Page Abstract Introduction Conclusions References Tables Figures J I J I Back Close Full Screen / EscPrint Version Interactive Discussion c EGU 2003 13.2 13.4 13.6 13.8 T [ o C] 7 8 9 10 a [g m -3 ] 3 4 5 6 7 U [m s -1 ] 60 80 100 120 140 d [ o ] 150 200 250 300 350 Time [s] 101 102 103 104 ∆ N, N I , N II [cm -3 ] T a U d ∆N NI N II
Fig. 15. Time series of temperature T , absolute humidity a, horizontal wind speed U , wind
direction d , particle number concentration NI (10 < Dp< 1500 nm), NII (5 < Dp< 1500 nm),
ACPD
3, 1693–1731, 2003 New-particle formation: SATURN F. Stratmann et al. Title Page Abstract Introduction Conclusions References Tables Figures J I J I Back Close Full Screen / EscPrint Version Interactive Discussion c EGU 2003 0 4 8 12 16 20 24 3 10 100 800 Panitzsch Collm Melpitz Time [UTC] 3 10 100 800 3 10 100 800 P a rtic le dia m eter [n m ]
Fig. 16. Diurnal variation of number size distributions normalized by the total number
concen-tration in Melpitz, Collm, and Panitzsch on 3 June 2002. Red colors indicates relative high concentrations, whereas blue indicates relative low concentrations.