HAL Id: hal-03047067
https://hal.sorbonne-universite.fr/hal-03047067
Submitted on 8 Dec 2020HAL is a multi-disciplinary open access archive for the deposit and dissemination of sci-entific research documents, whether they are pub-lished or not. The documents may come from teaching and research institutions in France or abroad, or from public or private research centers.
L’archive ouverte pluridisciplinaire HAL, est destinée au dépôt et à la diffusion de documents scientifiques de niveau recherche, publiés ou non, émanant des établissements d’enseignement et de recherche français ou étrangers, des laboratoires publics ou privés.
western Niger Delta intraslope basins: A record of
glacio-eustatic sea-level and basin tectonic forcings
Kelvin Chima, Christian Gorini, Marina Rabineau, Didier Granjeon, Damien
Do Couto, Estelle Leroux, Nick Hoggmascall
To cite this version:
Kelvin Chima, Christian Gorini, Marina Rabineau, Didier Granjeon, Damien Do Couto, et al.. Pliocene and Pleistocene stratigraphic evolution of the western Niger Delta intraslope basins: A record of glacio-eustatic sea-level and basin tectonic forcings. Global and Planetary Change, Elsevier, 2020, 195, pp.103355. �10.1016/j.gloplacha.2020.103355�. �hal-03047067�
1 Pliocene and Pleistocene stratigraphic evolution of the western Niger Delta intraslope basins: A record of glacio-eustatic sea-level and basin tectonic forcings
Kelvin Ikenna Chimaa,b*, Christian Gorinia, Marina Rabineauc, Didier Granjeond, Damien Do Coutoa, Estelle Lerouxe, Nick Hoggmascallf
a
Sorbonne Université-ISTeP UMR 7193, F7500, Paris (France)
b
Alex Ekwueme Federal University, Ndufu-Alike Ikwo, Ebonyi State, Nigeria.
c
CNRS, UMR 6538, LGO (CNRS/UBO/UBS), Plouzane (France)
d
IFPEN, Rueil-Malmaison (France)
e
IFREMER, ZI Pointe du Diable, Plouzane, France (France)
f
Shell International (UK).
Abstract
Although climate proxy (δ18
O) across the world ocean basins reveals that orbital forcing significantly controlled the Pliocene and the Pleistocene sediment deposition, and has been demonstrated in seismic and outcrop studies on the continental shelves of many margins, few or no seismic stratigraphic studies have investigated orbital forcing on deep-water sediment records. In this study, we combined detailed seismic stratigraphy and 3D geomorphological analysis of a high-resolution 3D seismic block in a detailed study of the stratigraphic evolution of the western Niger Delta intraslope basins over the last 5.5 Ma. Two mega seismic units named MSU 1 and MSU 2 were identified.
2 The change in sedimentary architecture from (i) mass flows and turbidite sequences to (ii) hemipelagic and turbidite sequences at the MSU 1/MSU 2 transition coincides with a significant (x3) increase in sedimentation rates and a transition from dominant 400 ka eccentricity cycles (from 5.3 Ma-0.8 Ma) to dominant 100 ka eccentricity cycles, at the Middle Pleistocene Transition (MPT) (circa 0.8-0 Ma). The timing of these changes was estimated based on a detailed analysis of seismic facies succession, correlation of seismic markers with high-resolution sea-level and oxygen isotope curves, and estimation of sequence duration. Further changes in the sedimentary record, characterised by turbidite-dominated sequences at the lower part of MSU 1 to mixed mass flows and turbidite sequences at the upper part of MSU 1, were respectively correlated with changes that occurred in the early Pliocene (circa 4.9 Ma) and in the early Pleistocene (circa 2.6 Ma).
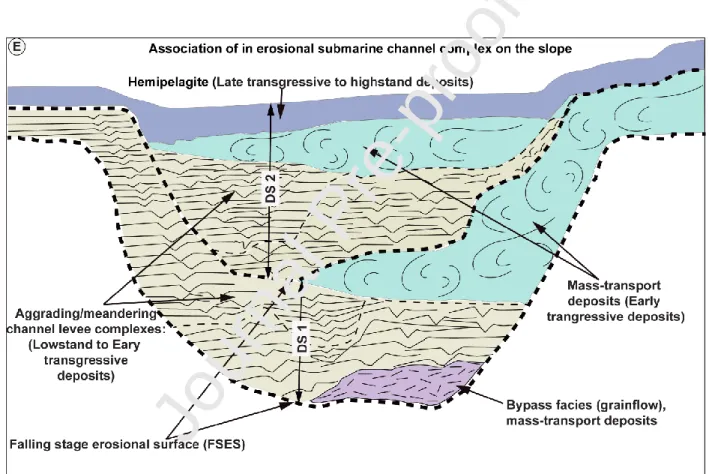
The depositional sequence on the western Niger Delta intraslope basin is usually characterised by a falling stage erosional surface (FSES) at its base and top (sequence boundary), and by (i) basal MTDs/bypass facies (where preserved), (ii) turbidite feeder channels/aggrading or meandering channel levee complexes and/or MTDs (slides/slumps) and (iii) hemipelagic drapes that successively document the falling stage, lowstand to early transgressive and late transgressive to highstand transits of the shoreline.
This seismic stratigraphic study demonstrates for the first-time sequence cyclicity associated with orbital (Milankovitch) forcing in the deep-water Niger Delta over the last 5.5 Ma. The Pliocene and Pleistocene sedimentary records of the western Niger Delta intraslope basins were controlled by interplay between allocyclic forcing linked to glacio-eustatic sea-level oscillations and basin tectonics associated with mobile shale movements, the latter being more prevalent from the early Pliocene to the MPT.
3 If calibrated with high-resolution biostratigraphic data in future studies, this study could serve as a useful analogue for further studies in the Gulf of Guinea, equatorial Atlantic and other margins fed by large deltas.
Keywords: Niger Delta; Intraslope basins; Pliocene; Pleistocene; Seismic stratigraphy; Allocyclic forcing; Eccentricity cycles.1
1. Introduction
Deep-water sediments are important archives of the Earth‟s history not only because they record past climatic, geodynamic, environmental and hydrodynamic changes (e.g. Burbank,1992; Molnar, 2004; Catuneanu, 2006; Posamentier and Kolla, 2003; Clift, 2010; Zecchin and Catuneanu, 2010), but also because they host viable hydrocarbon fields (see review in Morley et
al., 2011). Understanding the complex interplay between allocyclic (e.g. eustasy, tectonics,
climate and indirectly sediment supply), and autocyclic (e.g. channel avulsion) or regional forcings (e.g. delta lobe switching, shale tectonics etc.), is critical for interpretation of the evolution of deep-water sedimentary systems (e.g. Elliot, 1975; Jervey, 1988; Posamentier et al., 1988; Pulham, 1989; Einselle, 1991; Wiener et al., 2010; Miall, 2010; Morley et al., 2011; Catuneanu and Zecchin, 2013).
The Pliocene and Pleistocene are ideal time intervals for this kind of study because eustasy and climate proxies (δ18O) are well constrained and show significant variations both in amplitude and frequency (e.g. Ruddiman et al., 1989; Imbrie et al., 1993; Bassinot et al., 1994;
a,b*
Corresponding autho :: Kelvin Ikenna Chima; Sorbonne Université; Institut des Sciences de
la Terre (ISTeP), Case 129, Tour 56/66, fifth floor, 4 Place Jussieu, 75252, Paris Cedex. E-mail;
4 Leroy et al., 1999; Shackleton, 2000; Lisiecki and Raymo, 2005; Miller et al., 2005; Gibbard et
al., 2010; Gibbard and Lewin, 2016; Raymo et al., 2018). Published climate proxies across the
worlds‟ ocean basins show that the Pliocene and Pleistocene were controlled by orbital forcing (Milankovitch cycles) of three major periods namely: (i) precession (23 ka), (ii) obliquity (41 ka), and (iii) eccentricity (400 ka and 100 ka) (Lisiecki and Raymo, 2007). The early Pliocene from (5.3 Ma) to the early Pleistocene was dominated by obliquity cycles (41 ka), while the middle Pleistocene (circa 1.4 Ma) to the present was dominated by eccentricity (400 to 100) (Head and Gibbard, 2015a, b; Gibbard and Lewin, 2016). Although the switch to the eccentricity cycles is poorly understood and a transition period from 1.4 to 0.4 Ma was suggested by Head and Gibbard (2015a, b), and Gibbard and Lewin (2016), a marked change to increasingly severe glacial cycles, the so-called „0.8 Ma event‟ (Lisiecki and Raymo, 2007; Head and Gibbard, 2015a, b) or „0.9 Ma‟ (Miller et al., 2005; Elderfield et al., 2012), is usually interpreted as the Middle Pleistocene Transition (MPT).
Sedimentary records all over the world show the imprint of tectonic, climatic and glacio-eustatic cycles of different orders (Haq et al., 1987). Fourth-order climate cycles lasting 400 ka have been reported during the Pliocene e.g. on the continental shelf offshore Foz do Amazonas Basin (Brazil), with incised valleys, slope canyons and mass wasting (Gorini et al., 2014). During the Pleistocene, fifth-order glacio-eustatic sea-level changes with 100 ka periodicity are also well documented with marked shoreline progradation on the shelf and increased deep-water sedimentation during glacials e.g. in the Mediterranean Sea over the last 500 ka (Rabineau et
al.,2006; Ridente et al., 2008; Lafosse et al., 2018). During the Pliocene, sediment architecture in
the Mediterranean Sea does not appear to be much imprinted by the 400 ka cycles as shown in seismic (Rabineau et al., 2014) and numerical simulations (Leroux et al., 2014), probably
5 because of an anomaly in accommodation created by the erosion of the entire margin after the Messinian Salinity Crisis. 100-ka glacio-eustatic cycles have also been described worldwide e.g. offshore Alaska (Gulick et al., 2012), in the Gulf of Mexico (Galloway, 2001) and the Bengal fan (Werber et al.,1997).
In the eastern Niger Delta, Jermannaud et al. (2010) and Rouby et al. (2011), documented a transition from global climate-controlled sequences from circa 4-2.5 Ma to sediment supply-controlled sequences from 2.5 Ma to the present. These authors also demonstrated a general progradation and an increase in sedimentation rates from 4-2.5 Ma, followed by a retrogradation and a decrease in sedimentation rates over the last 2.5 Ma. Additionally, Riboulot et al. (2012), showed that eccentricity forcing of 100 ka periodicities has controlled the stratigraphic evolution of the eastern Niger Delta continental shelf over the last 0.5 Ma.
In the western Niger Delta slope, where the present study was conducted (Fig. 1), Jobe et
al. (2015, 2016; red box in Fig. 1A, D), linked changes in sedimentation rates during the last 130
ka (MIS 5e to the present) to glacial/interglacial cycles with increased sedimentation rates during the lowering of the sea level (MIS3 and MIS2) and an overall reduction in sedimentation during a rapid post-glacial sea-level rise associated with the Meltwater pulse 1A at 14 ka. Earlier studies e.g. Lézine et al. (2005); Weldeab et al. (2011); Collins et al. (2014); Govin et al. (2014) and Armitage et al. (2015), linked the increase in sedimentation rates in the Gulf of Guinea during the Quaternary to the West African Monsoon. A recent high-resolution, 3D seismic and sequence stratigraphic study of the western Niger Delta slope (yellow box in Fig. 1A, C, D, E) by Chima et
al. (2019, dated the Neogene stratigraphic record from the Burdigalian (18.5 Ma) to the late
Miocene (5.5 Ma), and described interactions between mobile shale and erosional submarine channel over the last 5.5 Ma. However, the lack of biostratigraphic data for the Pliocene and
6 Pleistocene poses a challenge to constraining the timing of major changes in sedimentary records.
Despite the above-mentioned studies of the Pliocene and Pleistocene sedimentary records in the Niger Delta, no study has investigated its control by orbital forcings from the late Messinian (5.5 Ma) to the present. Hence, the objective of this paper is to perform a detailed analysis of the stratigraphic evolution of the western Niger Delta intraslope basins over the last 5.5 Ma with a view to (i) proposing a sequence stratigraphic framework for the Pliocene and Pleistocene intervals; and (ii) investigating their control by orbital forcings.
The Niger Delta is an ideal laboratory to study climate stratigraphy and slope depositional processes because it is located on a passive margin where the imprints of regional/global climate dynamics, sea-level variation, gravity-tectonics, drainage evolution and sediment supply are well imaged on high-resolution 3D seismic reflection data.
2. Regional Setting
The Cenozoic Niger Delta is located in the Gulf of Guinea on the equatorial Atlantic margin of West Africa (Fig. 1A). The delta is the twelfth largest petroleum province in the world (Tuttle et al., 1999). It covers an area of ∼140,000 km2 with a maximum sediment thickness of ∼
12 km (Allen, 1965; Evamy et al., 1978; Doust and Omatsola, 1990). The Niger Delta is divided into the Eastern and the Western lobes by a Cretaceous basement high [the Charcot Fracture Zone (CFZ)] (Corredor et al., 2005; Fig. 1A). The development of the delta since the late Eocene (Fig. 1B, C), has led to three major structural zones:(i) an extensional zone (EZ) below the continental shelf characterised by normal faults; (ii) a translational zone (TZ) below the upper slope dominated by mobile shales and intraslope basins, and (iii) a contractional zone (CZ)
7 located at the toe of the slope characterised by reverse faults and detachment folds (Doust and Omatsola, 1990; Damuth, 1994; Cohen and McClay, 1996; Connors et al., 1998; Morgan, 2004; Bilotti et al., 2005; Corredor et al., 2005; Fig. 1A, C).
The classification scheme of Prather et al. (2003) describes the western Niger Delta slope profile as a „graded slope‟ characterised by a seafloor whose downslope profile is elevated above the level of theoretical concave-upward, smoothed graded profile. Shale tectonics on the Niger Delta slope give rise to shale/thrust-cored structural highs flanked by mobile shale withdrawal intraslope basins that interact with sediment-gravity flows (Doust and Omatsola, 1990; Damuth, 1994; Cohen and McClay, 1996; Connors et al., 1998; Graue, 2000; Morgan, 2004; Bilotti et al., 2005; Corredor et al., 2005; Wiener et al., 2010; Prather et al., 2012; Fig. 1D, E). The western Niger Delta slope is in constant dynamic equilibrium as the movements of mobile shale create structural highs which, in turn, are smoothed by sediment-gravity flows that preferentially accumulate within adjacent intraslope basins (Deptuck et al., 2003; Adeogba et al., 2005; Bakare et al., 2007; Prather et al., 2012; Clark and Cartwright, 2012; Chima et al., 2019; Fig. 1D, E). The distribution of shale/thrust-cored structures on the western Niger Delta slope significantly controls the morphology of submarine channels, depositional patterns, reservoir architecture and distribution (e.g. Adeogba et al., 2005; Bakare et al., 2007; Jobe et al., 2015, 2016; Clark and Cartwright, 2012; Deptuck et al., 2012; Prather et al., 2012; Jolly et al., 2016; Hansen et al., 2017; Chima et al., 2019). The present study was conducted in the translational zone of the western Niger Delta slope at the transition between the extensional and the contractional domains (Fig. 1A, C). The study area covers 638 km2 at ~120 km from the present-day coastline and lies at water depths ranging from 900 to 1,755 m (Fig. 1E).
8 3. Dataset and Methods
3.1 Dataset
We used high-resolution 3D seismic data and lithologic logs from five boreholes (see Fig. 1A, D, E), to study the Pliocene and the Pleistocene stratigraphic evolution of the western Niger Delta.
3.1.1 Seismic data
The 3D seismic data was processed as a zero-phase source wavelet in the American reverse standard polarity such that an increase in acoustic impedance corresponds to a trough (blue loop) in the wavelet, while a decrease in acoustic impedance is represented by a peak (red loop) in the wavelet. The horizontal resolution of the data is characterised by a stacking bin spacing of 25 m x 25 m (inline and crossline spacing), and a seismic recording sampling interval of 4 milliseconds two-way travel time (TWT). The dominant frequency of the data is 30 Hz over the first 3 seconds (TWT), which yields a vertical resolution of ~13.7 meters within the interval of interest.
3.1.2 Well data
The well data comprise gamma-ray logs from five wells (labelled W1, W2, W3, W4 and W5 in Fig. 1A, D, E). Wells W2-W5 penetrate only the lower part of the Pliocene whereas W1 covers the Neogene to the late Pleistocene (see Figs. 2; 7 and 9B of Chima et al., 2019). The most recent available biostratigraphic dating corresponds to the late Messinian (circa 5.5 Ma), based on the last recorded occurrence of Discoaster quinqueramus (see Chima et al., 2019).
9 Biostratigraphic data were not available for the interval of interest (the Pliocene and the Pleistocene).
3.2 Methods
3.2.1 Seismic stratigraphy
We applied the concept of seismic stratigraphy (after Mitchum and Vail, 1977) to analyse the sedimentary architecture of the Pliocene and Pleistocene sedimentary records of the western Niger Delta intraslope basins. Our seismic stratigraphic approach relied on the recognition of reflection amplitude, continuity, internal architecture, external geometry, the nature of bounding surfaces and erosional truncations to delineate key seismic surfaces as well as their association with seismic facies.
3.2.2 3D seismic geomorphology
We applied the 3D seismic geomorphological analysis technique described by Posamentier and Kolla (2003) and Catuneanu (2006) for our detailed study of the depositional environments corresponding to the seismic facies described above. This was achieved by detailed analysis of root mean square (RMS) seismic amplitudes, that makes it possible to distinguish lithological and depositional environments (see Chima et al., 2019; and references therein). Analyses of the RMS amplitudes were combined with variance seismic attributes to guide the geological interpretation of the seismic data (Chopra and Mafort, 2007; Taner et al; 1994; Chima et al., 2019). Three (3D) seismic geomorphological analyses enabled the detailed study of the space-time evolution of the Pliocene and the Pleistocene sedimentary records.
10 3.2.3 Allostratigraphic partitioning and dating of the Pliocene and the Pleistocene stratigraphy
Detailed analysis of RMS maps combined with variance analysis of seismic attributes and 3D geomorphological interpretation of the seismic data made it possible to define 21 mappable seismic surfaces, which bound thefourth-and fifth-order allostratigraphic sequences as defined by Catuneanu (2006) and Catuneanu et al. (2011). These allostratigraphic units were grouped in two mega seismic units (MSU 1 and MSU 2). As no biostratigraphic data were available for the Pliocene or the Pleistocene, we used the most recent biostratigraphically constrained interval (the late Messinian) dated at ∼5.5 Ma based on the last recorded occurrence of Discoaster
quinqueramus (see Chima et al., 2019), to define the age of the lower part of MSU 1. Then, we
matched the key erosional and conformable seismic surfaces that show significant changes in the sedimentary architecture both in seismic lines and on 3D geomorphological maps with the high-resolution Pliocene and the Pleistocene sea-level and oxygen isotope (18O) curves derived from (Lisiecki and Raymo, 2005; Raymo et al., 2018).
4. Results and Interpretations
4.1. Seismic facies analysis
The Pliocene and Pleistocene stratigraphy of the western Niger Delta intraslope basins were subdivided into two mega seismic units named MSU 1 and MSU 2, based on the observed changes in seismic geometries and depositional environments. MSU 1 and MSU 2 correspond to Unit 6 and Unit 7 respectively in Chima et al. (2019). Although a detailed seismic facies analysis of the study area was presented in Chima et al. (2019) (Fig. 1A, C, D, E; 2A), the present study sheds more light on facies association and improves our understanding of depositional processes
11 and sequence stratigraphy in a deep-water (slope) setting. The six seismic facies previously described in the study area by Chima et al. (2019) include: (1) chaotic, discontinuous low-amplitude (Bl) seismic facies, characterised by elongate/tabular geometry, irregular tops and
erosional bases, interpreted as mass-transport deposits (MTDs; Fig. 2A1, B, C); (2) chaotic,
discontinuous to moderately continuous, high-amplitude (Bh) seismic facies, characterised by
irregular base, blocky external form and sinuous planform geometry, interpreted as turbidite feeder channels/aggrading or meandering channel levee complexes (CLCs; Fig. 2A2, B); (3)
coherent/slightly inclined, moderate to high-amplitude seismic facies that generally border the margins of concave-upward negative relief and display tortuous planform geometry, interpreted as MTDs (slides/slump blocks?; Fig. 2A3); (4) parallel continuous to slightly convergent,
high-amplitude, (Cbh) seismic facies that display fan-shaped geometry with high RMS amplitude on
the map, interpreted as distributary channels/lobes (2A4, C); (5) convergent/thinning, high-to
moderate-amplitude, (Cth) seismic facies, characterised by wedge geometry, which borders
negative relief, marked by sinuous planform geometry, interpreted as channel levee deposits (2A5, B, C); (6) transparent, parallel, continuous, draping seismic facies (D) that locally display
small-scale chaotic internal architecture, bounded by conformable surfaces interpreted as hemipelagic drapes and/or muddy turbidites (2A6, B, C). The foregoing seismic facies and their
interpretations were confirmed by 3D seismic geomorphology (Figs. 3-10) and are consistent with previous studies of the Niger Delta intraslope basins (e.g. Deptuck et al., 2003; 2012; Adeogba et al., 2005; Bakare et al., 2007; Hansen et al., 2017).
4.2 Facies association
12 Seismic facies on the western Niger Delta intraslope basins display complex lateral and vertical arrangements inside and outside erosional submarine channels MSU 1 and MSU 2 (e.g. Fig. 2A, B, C).
4.2.1 Association of seismic facies in mega seismic unit 1 (MSU 1)
In MSU 1, we observed a 2.5 km wide concave-upward negative topography (185 m deep) that obstructs the lateral continuity of seismic reflections (e.g. Fig. 2B). Within this topographic feature, a narrow (1 km wide, 90 m deep), vertically stacked, concave-upward negative topographies were also observed (e.g. Fig. 2B). The 2.5 km and the 1 km wide negative topographies were interpreted as, respectively, erosional submarine channels and channel levee systems (CLSs) or channel forms (after Deptuck et al., 2003; e.g. Fig. 2B).
4.2.1.1 Association of seismic facies within the erosional submarine channels in MSU 1
The association of facies within the erosional submarine channels in MSU 1 includes: (i)
Bl seismic facies (MTDs), named basal MTDs; (ii) Bh seismic facies, which correspond to
turbidite feeder channels/aggrading or meandering channel levee complexes, and (iii) Cth seismic
facies, which correspond to channel levee deposits (e.g. Fig. 2A, B). Levee deposits were further subdivided into inner and outer levee (IL and OL) deposits, respectively, depending on whether sedimentation occurred inside or outside the erosional submarine channel (e.g. Fig. 2B). These
Bl, Cth and the Bh seismic facies generally infilled erosional submarine channels in MSU 1 (e.g.
2B). Each erosional submarine channel and associated infilling was generally abruptly overlain by another negative topography (erosional submarine channel) with or without complete
13 preservation of the Bl, Cth and the Bh seismic facies (Fig. 2B). The entire system is locally
overlain by another Bl seismic facies (MTD; e.g. Fig. 2B).
4.2.1.2 Association of seismic facies outside the erosional submarine channels in MSU 1
Outside the erosional submarine channels in MSU 1, seismic facies generally stack vertically from (i) Bl facies (basal MTDs), (ii) the Cth facies (channel levee deposits), (iii) the Bl
facies (MTDs), (iv) the Cbh facies(distributary channels/lobe deposits) and the D seismic facies
(hemipelagic drape) (e.g. Fig. 2C). The Bl seismic facies (MTDs) generally disrupt the lateral
continuity of the underlying Cth seismic facies (e.g. 2C).
4.2.2 Association of seismic facies in MSU 2
In MSU 2, similar concave upward, negative topographies previously described and interpreted as erosional submarine channels and CLSs (Fig. 2B), were also observed in MSU 2 (e.g. Fig. 3A, B). How the seismic facies are associated inside and outside the erosional submarine channels is described below.
4.2.2.1 Association of seismic facies within the erosional submarine channels in MSU 2
In MSU 2, the seismic facies in the erosional submarine channels generally stack from (i) the Bh facies (turbidite feeder channels/aggrading or meandering channel levee complexes); (ii)
coherent/slightly inclined, moderate to high amplitude seismic facies that generally border the margins of concave-upward negative relief and display tortuous planform geometry (slide/slump blocks) (Fig. 2A; 3A, B) to (iii) the D facies (hemipelagic drape), where preserved (e.g. horizons S and X in Fig. 3A, B). The coherent/slightly inclined, moderate to high amplitude seismic facies
14 (slide blocks/slump deposits) locally disrupt the lateral continuity of the underlying Bh seismic
facies (e.g. Fig. 3A, B).
4.2.2.2 Association of seismic facies outside the erosional submarine channels in MSU 2
In MSU 2, the association of seismic facies outside erosional submarine channels includes: (i) the Cth facies (aggrading channel levee/overbank deposits); (ii) the Bl facies
(MTDs), and (iii) the D facies (hemipelagic drape) (see the stratigraphic interval between horizons T and V at the extreme left in Fig. 3A, B). As observed in MSU 1, the Bl facies (MTDs)
generally disrupt the lateral continuity of the Cth seismic facies (e.g. Fig. 3A, B).
4.3 3D seismic geomorphology and sedimentary architecture
A total of 21 seismic surfaces (13 in MSU 1, labelled M-P) and (8 in MSU 2, labelled Q-X in Figs. 3-10), were analysed in detail in this study. Only a few representative erosional surfaces in the lower, middle, and upper parts of MSU 1 and MSU 2 which illustrate the main changes in the sedimentary architecture of the Pliocene and the Pleistocene are presented here.
4.3.1 Base of MSU 1 (horizon M) Description
The base of MSU 1 (horizon M in Fig. 3B) is unerlain by > 80 m thick transparent, parallel continuous, D seismic facies (highlighted in blue in Fig. 3B). The M horizon is traceable through a significant part of the study area except across the overlying 185 m negative relief (horizon A in Fig. 3A) and the mounded seismic wipe out zone in the northern part of the study area (Figs. 1D, 3A, B). The 185 m deep relief associated with horizon A marks the onset of the
15 chaotic, discontinuous low amplitude (Bl seismic facies), the convergent/thinning, high to
moderate amplitude (Cth seismic facies) and the parallel continuous to slightly convergent, high
amplitude (Cbh seismic facies) (Fig. 3A, B). An RMS amplitude map draped on a variance
attribute of the 185 m deep relief associated with horizon A, shows the presence of a 1.5 km wide, east-west trending, relatively straight planform feature (labelled 1 in Fig. 3C), and two narrow winding features (labelled 2, 3 in Fig. 3C), in the southern part of the study area. The narrow winding feature (labelled 2 in Fig. 3C), is connected to a fan-shaped feature to the southwest. Linear scars with respectively, northeast-southwest, radial, and east-west orientations, are observed in the northern, central, and southern parts of the study area (Fig. 3C). A grey area (dashed red line) is observed in the north-eastern part of the study area characterised by radial features at its southern tip (Fig. 3C). The narrow winding feature (labelled 3 in Fig. 3C), crosses an oblique, elongated positive relief to the south. A north-south seismic line (CCI), (located in Fig. 3C), illustrates the sedimentary architecture of horizon A (Fig. 3A, B). Northeast-southwest trending linear scars generally offset stratigraphy normally except in the north, where one of the scars (labelled Z in Fig. 3B) offsets stratigraphy normally at its lower part but inversely at its upper part.
Interpretation
The >80 m thick transparent, parallel continuous, draping seismic unit, characterised at the base by a conformable seismic surface (labelled horizon M in Fig. 3B), corresponds to the hemipelagic drape (HD)/muddy turbidites, dated at 5.5 Ma (see Chima et al., 2019). The conformable nature of this hemipelagic drape suggests that it passively draped the slope during the episode of maximum flooding of the continental shelf and sediment starvation in the deep
16 basin (see Chima et al., 2019; and references therein). This interpretation is supported by the fact that the D. quinqueramus (calcareous nannofossil) we used in dating the hemipelagic drape at 5.5 Ma is globally recognised as an important marker of the high sea level in the late Miocene (e.g. Backman et al., 2012). The 1.5 km wide and 185 m deep negative relief associated with horizon A (Fig. 3B), which displays straight planform geometry (Fig. 3C), corresponds to the erosional submarine channel described in section 4.2.1. The lateral discontinuity of horizon M (the base of the hemipelagic drape dated at 5.5 Ma) caused by the overlying horizon A, further supports the interpretation of the latter as an erosional surface (Fig. 3B). The Bl, Cth and the Cbh seismic facies
that generally overlie horizon A correspond to, respectively, the MTDs, channel levee deposits/CLSs and the turbidite feeder channels/aggrading, or meandering channel levee complexes described above (Figs. 2A, B; 3A, B). The narrow, winding features (labelled 2, 3) south of the main erosional submarine channel in Fig. 3C, were interpreted as sinuous channel levee systems (CLSs) or channel forms (after Deptuck et al., 2003; Fig. 3C). The fan-shaped feature associated with CLS 2 was interpreted as a transient fan/lobe deposit (after Adeogba et
al., 2005; Fig. 3C). The seismic wipe out/grey area in the north-eastern part of the study area was
interpreted as a mobile shale, while the linear scars and oblique/elongated feature, crossed by a CLS to the south, were respectively interpreted as normal faults and buried folds (see Chima et
al., 2019; Fig. 3C). The change in the stratal offset patterns along fault Z (Fig. 3B), from normal
at the lower stratigraphic level to inverse at the upper stratigraphic level, was interpreted as fault inversion linked to shale tectonics.
4.3.2 Middle part of MSU 1 (horizons G and I) Description
17 An RMS amplitude map of horizon G draped on the variance attribute extraction in the middle part of MSU 1 (horizon G), reveals the presence of four narrow, winding features (labelled 1a, 2, 3 and 4 in Fig. 4A) located in the north-western and south-eastern parts of the study area. Compared to winding features 1a and 4, features 2 and 3 display elongated borders of moderate RMS amplitudes (Fig. 4A). Linear scars display trends that vary with the northeast-southwest and east-west orientations, dominate the northern part of the study area, while the radial patterns dominate the central part of the study area (Fig. 4A). A NE-SW grey area subdivides the study area into northern and southern halves (Fig. 4A). An irregular, rounded, chaotic area is visible in the SE corner of the study area (dashed black line in Fig. 4A). A seismic line (DDI) through the winding features 1a and 2, reveals the presence of a 1 km wide, 120 m deep relief, infilled with the chaotic, discontinuous to moderately continuous, high amplitude, Bh
and convergent/thinning, high to moderate amplitude, Cth seismic facies that also infill erosional
channels 1a and 2 (Fig. 4B).
Furthermore, a variance attribute extraction on the horizon I, in the middle of MSU 1 (above horizon G), reveals the presence of a 2.5 km wide, sinuous feature (labelled 1b) to the north, characterised by the presence of narrower, winding features in its central part (Fig. 5A). A chaotic area is visible on the outer side of the main sinuous feature to the northeast, which is characterised by smaller, linear or slightly curved features (Fig. 5A). A seismic line (BBI) crossing the main sinuous feature (Fig. 5A) reveals the presence of a 176 m deep relief corresponding to horizon I (Fig. 5B). The 2.5 km wide negative relief associated with horizon I and the enclosed narrower sinuous features are infilled with the chaotic, discontinuous low amplitude, Bl seismic facies, the convergent/thinning, high to moderate amplitude, Cth seismic
facies and the parallel continuous to slightly convergent, high amplitude, Cbh seismic facies that
18 generally disrupt the lateral continuity of the underlying Bl andthe Cth seismic facies (Fig. 5B).
These seismic facies are unconformably overlain by a negative relief corresponding to horizon J (Fig. 5B). In turn, horizon J is overlain by a 166 m deep narrow relief, infilled with the chaotic, discontinuous to moderately continuous, high amplitude Bh seismic facies, bordered by the
convergent/thinning, high to moderate amplitude Cth seismic facies (Fig. 5B). The entire system
is abruptly overlain by the chaotic, discontinuous low amplitude, Bl seismic facies, covered by
hemipelagic drape and display an overall convex-upward geometry (Fig. 5B).
Interpretation
The four narrow winding features associated with horizon G in (Fig. 4A) were interpreted as CLSs or channels forms, while the moderate amplitude zones that parallel the borders of the CLSs 2 and 3 were interpreted as channel belts (Fig. 4A). The NE-SW oriented grey area/seismic wipe-out zone corresponds to the area affected by mobile shale and/or erosion (Fig. 4A). The irregular chaotic area in the SE corner of the study area was interpreted as MTD (Fig. 4A). The 1 km wide, 120 m deep relief associated with horizon G was interpreted as erosional CLS (Fig. 4B). The chaotic, discontinuous to moderately continuous, high amplitude, Bh seismic facies and
the convergent/thinning, high to moderate amplitude, Cth seismic facies that respectively infill
and border the erosional CLS associated with horizon G, were interpreted as turbidite feeder channels/aggrading or meandering channel levee complexes and outer levee deposits. The presence of the Cth seismic facies (OL) deposits at nearly the same stratigraphic level as the infill
of the erosional CLSs (labelled 1a in Fig. 4B), suggests that sediment-gravity flows within the channel were unconfined (see Deptuck et al., 2003; Fig. 4B).
19 The 2.5 km wide, sinuous feature associated with horizon I (Fig. 5A) was interpreted as a sinuous, erosional submarine channel/erosional surface, while the smaller winding features within the erosional channel were interpreted as CLSs (Fig. 5B). The chaotic, discontinuous low amplitude, Bl seismic facies, the convergent/thinning, high to moderate amplitude, Cth seismic
facies and the parallel continuous to slightly convergent, high amplitude, Cbh seismic facies that
infill or border the erosional submarine channel and the channel forms were interpreted, respectively, as MTDs, channel levee deposits, and distributary channels/lobes (Figs. 2B, 5B). While the convergent/thinning, high to moderate amplitude, Cth seismic facies, confined to the
main erosional submarine channel (horizon I) was interpreted as inner levee (IL), the Cth seismic
facies on the outer bank of the erosional channels were interpreted as outer levee (OL) deposits (Figs. 2B, 5B). The presence of the IL deposit to the right of the main erosional submarine channel, coupled with the narrowing and lateral shifts of the enclosed CLSs/channel forms (red arrow in Fig. 5B), were interpreted as recording different stages of meandering/lateral aggradation of the system. The presence of OLs at every stage of the erosional submarine channel (Fig. 5B), suggests that sediment-gravity flows were not confined during the development of the system. The convex-upward geometry, displayed by the entire system, suggests that it was overfilled.
4.3.3 Upper part of MSU 1 (horizon K) Description
An RMS amplitude map draped on a variance attribute extraction in the upper part of MSU 1, (labelled horizon K in Fig. 6A), reveals the presence of a 1.8 km wide, bifurcating planform feature in the northern part of the study area (labelled 1c in Fig. 6A). The feature
20 displays an overall moderate RMS amplitude and is characterised by smaller, winding features with higher RMS amplitude (Fig. 6A). A linear relief is visible on the outer bend of the main system (Fig. 6A). A north-south seismic line (FFI) through the centre of the system reveals a 1.8 km wide, 90 m deep negative relief, infilled with the chaotic, discontinuous to moderately continuous, high amplitude, Bh seismic facies (Fig. 6B). The Bh seismic facies is unconformably
overlain by the chaotic, discontinuous low amplitude, Bl seismic facies, covered by hemipelagic
drape and display an overall convex-upward geometry (Fig. 6B). Interpretation
The 1.8 km wide, 90 m deep relief, characterised by moderate RMS amplitudes and the enclosed, narrow winding features that display higher RMS amplitudes were interpreted as an erosional submarine channel and CLSs, respectively (Fig. 6A, B). The chaotic, discontinuous to moderately continuous, high amplitude, Bh seismic facies which infill the erosional submarine
channel were interpreted as turbidite feeder channels/aggrading or meandering channel levee complexes, while the overlying, unconformable, Bl seismic facies were interpreted as MTDs
(Fig. 5B). The sharp relief at the outer bend of the erosional submarine channel was interpreted as a terrace (Fig. 6A, B). The fact this feature matches the earlier erosional submarine channels (labelled 1a-c in Figs. 4A, 5A and 6A), suggests that the feature has been active since the time equivalent to horizon E (Fig. 4A). Between the early stage (labelled 1a in Fig. 4A) and the late stage (labelled 1c in Fig. 6B), this erosional channel migrated more than 10 km NW-SE, with an overall increase in width and erosional efficiency until the age equivalent to that of horizon K, when it was truncated by the overlying, Bl seismic facies (MTDs; Fig. 6B). The convex-upward
geometry, displayed by the entire system, suggests that it was overfilled.
21 4.3.4 Base of MSU 2 (horizon Q)
Description
An RMS amplitude map at the base of MSU 2 draped on a variance attribute map (the horizon labelled Q in Fig. 3B), reveals the presence of a 2.5-km wide, sinuous NE-SW trending feature and smaller, NE-SW winding features (labelled 1, 2, 3 and 4, respectively, in Fig. 3D), all in the southern part of the study area. In the northern part of the study area, linear scars display east-west, northeast-southwest and radial patterns from the distal, central to proximal parts, respectively (Fig. 3D). Towards the northeast, two large dark rounded features (>1.5 km wide), characterised by low RMS amplitudes are flanked by smaller, dark rounded features (Fig. 3D). The large, dark rounded feature to the extreme north-east is marked at its centre by a 0.3 km wide, rounded feature (Fig. 3D). In the north-western part of the study area, a 1 km wide sinuous feature highlighted in grey, marks the northern limit of the small, dark rounded features (Fig. 3D). A north-south seismic line (CCI) crossing these features, illustrates their stratigraphic architecture (Fig. 3A, B).
Interpretation
The 2.5 km wide, NE-SW trending feature (labelled 1 in the southern part of Fig. 3B, D) and the sinuous feature highlighted in grey to the northwest, correspond to the eroded portion of the stratigraphy, while the narrow winding features (labelled 2, 3 and 4 in Fig. 3D) were interpreted as CLSs. The east-west and northeast-southwest trending as well as radial scars (Fig. 3D) that offset stratigraphy on seismic line (Fig. 3B), were interpreted as normal faults. The large and smaller, dark rounded features in the northern part of the study area were interpreted as mobile shales and fluid escape features, respectively (Fig. 3D). The 0.3 km wide, rounded
22 feature in the centre of the mobile shale to the northeast was interpreted as a giant pockmark (after Ribolout et al., 2012).
4.3.5 Middle part of MSU 2 (horizon R) Description
An RMS amplitude map in the middle of MSU 2 superimposed on a variance attribute extraction (the level of horizon R in Fig. 7C) reveals the presence of a NE-SW trending, 2.5 km wide sinuous feature, with low RMS amplitude (Fig. 7A, B). This sinuous feature increases in width downstream to the southwest and is characterised by many smaller winding features within the main system (Fig. 7A, B). Rounded relief features > 300 m wide are present on the middle outer bend of the system (Fig. 7A, B). Three narrow winding features are observed south of this sinuous feature, (Fig. 7A, B). Radial, NE-SW and E-W trending linear scars occur in the north, central and southern parts of the study area, respectively (Fig. 7A, B). To the north, two rounded, dark features with low RMS amplitudes are observed associated with the lower feature, flanked by smaller rounded, dark features which are confined within the NE-SW and E-W trending linear scars (Fig. 7A, B). A north-south seismic line (GGI) through the main sinuous feature, reveals the presence of a 185-m deep, negative relief, characterised by elevated margins and irregular scars to the right of the feature (Fig. 7C, D, E). The 185-m deep relief is infilled with chaotic, discontinuous to moderately continuous, high amplitude, Bh seismic facies, which in turn, are
unconformably overlain by the coherent/slightly inclined, moderate to high amplitude seismic facies (Fig. 7C, D, E). The infill of the relief associated with horizon R is unconformably overlain by a 180 m relief and a 100 m deep relief that correspond, respectively, to horizons V and W (Figs. 7C, D, E; 8D, E). These topographies are in turn infilled with chaotic,
23 discontinuous to moderately continuous, high amplitude, Bh seismic facies and coherent/slightly
inclined, moderate to high amplitude seismic facies (Fig. 7C, D, E). The entire system is overlain by an irregular seismic reflection (horizon X), which, in turn, is covered by transparent, parallel continuous, D seismic facies (Fig. 7C, D, E).
Interpretation
The 2.5 km wide, 185 m deep sinuous feature, associated with horizon R was interpreted as a sinuous erosional submarine channel (Fig. 7A-E). The chaotic, discontinuous to moderately continuous, high amplitude, Bh seismic facies and the coherent/slightly inclined, moderate to
high amplitude seismic facies that infill the erosional channels/erosional surfaces associated with horizons R, V and W (Fig. 7A-E) were interpreted as turbidite feeder channels/aggrading or meandering channel levee complexes and MTDs (slides/slump blocks?), respectively. These turbidite feeder channels/aggrading or meandering channel levee complexes resemble the highly incisional, high amplitude reflections (HARS) previously described on the western Niger Delta slope (e.g. Deptuck et al., 2003; Heiniö and Davies, 2007; Hansen et al., 2017) and elsewhere on the adjacent side of the equatorial Atlantic, the Rio Muni Basin (Equatorial Guinea) (see Jobe et
al., 2011). The transparent, parallel continuous, D seismic facies, which drape the entire system
was interpreted as a hemipelagic drape (Fig. 7C-E). The > 300 m wide, rounded features on the middle outer bend of the erosional submarine channel were interpreted as slides/slump scars (Fig. 2A, 7A, B). The narrow, winding features to the south of the main erosional channel were interpreted as sinuous CLSs or channel forms (see Deptuck et al., 2003; Fig. 7A, B). The lateral discontinuity of seismic reflections (e.g. the horizons P and Q) on the adjacent side of the erosional channel (Fig. 7C-E), demonstrates the erosional character of the sediment-gravity
24 flows that sculpted the channel. This interpretation is supported by the channel‟s deeply incised nature (185-m deep) and the presence of terraces (multiple slide/slump scars) along the elevated margins of the channel (Fig. 7C-E). The relatively confined nature of the erosional submarine channels, the dominance of channel infills by turbidite feeder channels/aggrading or meandering channel levee complexes within the channels and the presence of MTDs (slides/slumps?), distinguish the submarine channels observed in MSU 2 from those observed in MSU 1, where the channels are generally unconfined (e.g. Figs. 4B, 5B). The vertical superposition of erosional submarine channels with minor lateral migration (Fig. 7C-E), demonstrates the complex cut and fill architecture of the system with overall vertical aggradation (red arrow in Fig. 7E). The radial, E-W and NE-SW trending linear scars distributed in the north, central and southern part of the study area, were interpreted as normal faults (Fig. 7A-C). The rounded, dark features with low RMS amplitudes were interpreted as mobile shales, while the smaller, dark rounded features that flank the mobile shales were interpreted as fluid escape features (Fig. 7A, B). These mobile shales, mud volcanoes, fluid escape features, BSR and pockmarks (Figs. 1E, 3A, 8A, 9A), support fluid overpressure in the study area (see also Riboulot et al., 2011).
4.3.6 Upper part of the MSU 2 (horizons V and W) Description
An RMS amplitude map of horizon V draped on a variance attribute extraction at the upper part of MSU 2 reveals the presence of a 2.1 km wide, sinuous planform feature, characterised by moderate RMS amplitudes and smaller winding features within the main system (Fig. 8A, B). Smaller winding features also occur in the northern and southern parts of the study area (Fig. 8A, B). The borders of the main sinuous system are irregular and contain some
25 detached curved loops at its outer bends (Fig. 8A, B). North of the system, a NE-SW trending, wedge-shaped chaotic area of low RMS amplitude is observed (dashed black lines in Fig. 8A, B). Further to the north of the study area, two rounded, dark features with low RMS amplitudes are associated with smaller, dark rounded features (Fig. 8A, B). Some of the smaller, dark rounded features are confined within the NE-SW trending short and long linear scars (Fig. 7A, B). A NW-SE seismic line (HHI) illustrates a 105 m deep negative relief associated with the 2.1 km wide sinuous feature (Fig. 8C-E). This feature is infilled with chaotic, discontinuous to moderately continuous, high amplitude, Bh seismic facies which, in turn, are unconformably
overlain by the coherent/slightly inclined, moderate to high amplitude seismic facies (Fig. 8C-E). The infill of the erosional channel/surface associated with horizon V is abruptly overlain by another 100 m deep relief associated with the overlying horizon W (Figs. 7C-E; 8C, 9A). The topographies of horizons V and W respectively disrupt the lateral continuity of the relatively thick, convergent/thinning, high to moderate amplitude, Cth seismic facies, the parallel
continuous to slightly convergent, high amplitude, Cbh seismic facies, and the draping, D seismic
facies (Fig. 7C, 8C). Towards the right of Fig. 8C, thin, laterally confined, somewhat coherent, low to moderate reflectivity seismic reflections overlie horizon V (above the V-shaped, linear scars, that offset seismic reflections in Fig. 8A-C).
An RMS amplitude map superimposed on a variance attribute map (the level of the horizon W), just above (the horizon V), reveals the presence of a 2.5 km wide, sinuous planform feature with low RMS amplitudes and characterised by narrow winding features (Fig. 9A). South of the main sinuous system, two elongate features, characterised by high RMS amplitudes in the eastern and western parts of the study area are observed, with narrow, winding features crossing the eastern elongate feature (Fig. 9A). To the north, two rounded, dark features are flanked by
26 short and long linear scars that are in turn, flanked by smaller, dark rounded features (Fig. 9A). An irregular chaotic area with an overall low RMS amplitude to the northeast (dashed black line in Fig. 9A), occurs adjacent to the rounded, dark features (Fig. 9A). An E-W oriented seismic line (JJI) which crosses the elongated features with high RMS amplitudes in the southern part of the study area, shows their high reflectivity and onlapping geometry at the margin of the intraslope basin (yellow arrow in the top left-hand corner of Fig. 9B). Although our observations of the previous seismic lines show that the infills of negative topographies are generally chaotic and difficult to trace (e.g. Figs. 3A, B, 7C, D), the erosional surfaces (labelled horizons X and W in Fig. 8C-E), were locally correlated inside the negative relief.
Interpretation
The wide sinuous features associated with horizons V and W (Figs. 8A, B; 9A) were interpreted as meandering, erosional submarine channels, while the narrow winding features to the north and south of these features, were interpreted as sinuous CLSs or channel forms. (Figs. 8A, B; 9A, B). The chaotic, discontinuous to moderately continuous, high amplitude, Bh seismic
facies and the coherent/slightly inclined, moderate to high amplitude seismic facies that infill the erosional submarine channels associated with horizons V and W were respectively interpreted as turbidite feeder channels/aggrading or meandering channel levee complexes and MTDs (?slide blocks/slump deposits) (Fig. 8A-E). The occurrence of the slide/slump deposits at the same stratigraphic level as the laterally extensive MTDs that overlie the erosional surface (labelled horizon V; e.g. Fig.8C-E), suggests that the former may derive from failures of the latter during major sediment-gravity flows. The D seismic facies interpreted as hemipelagic drape/muddy turbidites, where preserved, generally drape the erosional submarine channels and their infilling
27 (Fig. 7C-E, 8C-E). The detached, curved loops on the outer bends of the erosional channel associated with horizon V were interpreted as abandoned meander loops (Fig. 8A, B). The chaotic areas with overall low RMS amplitudes north and northeast of the study area (Fig. 8A, B) were interpreted as MTDs. The moderate RMS amplitudes associated with the MTDs to the northeast of the rounded, dark features (mobile shales; Fig. 7A), suggest the presence of sands within the MTDs that were trapped within local topography associated with the mobile shales (Fig. 8A, B). The short, east-west trending linear scars, adjacent to the mobile shales and the associated small, dark rounded features, were interpreted as fault scars and fluid escape features, respectively (Fig. 8A). The longer linear scars confined within the shorter (fault scars), characterised by coherent/slightly deformed internal architecture with moderate to high reflectivity on the seismic line (e.g. Fig. 2B, 5A) were interpreted as mobile shale-derived MTDs (see Chima et al., 2019). The lateral confinement of these MTDs adjacent to the mobile shales (Figs. 8A, 9A), coupled with their somewhat coherent internal architecture and moderate to high RMS amplitudes, distinguish them from the regional MTDs (see Chima et al., 2019). The elongated features, characterised by high RMS amplitude in the southern part of the study area (Fig. 9A), were interpreted as transient fan/lobe deposits (after Adeobga et al., 2005). The winding features (CLSs) that cross the eastern transient fan/lobe suggest that sediment was bypassed on the eastern transient fan to a more distal setting beyond the limit of the 3D block we studied (Fig. 9A). The upward decrease in the thickness of slide/slump deposits from horizons R to W (Figs. 7C-E, 9C-E) suggests an overall decrease in the incisional ability of the sediment-gravity flows that sculpted the systems, or the gradual establishment of a local slope equilibrium profile in response to an overall decrease in shale tectonics. However, the upward decrease in the thickness of outer levees from the horizons R-W (Figs. 8C-E, 9C-E), suggests increased
28 confinement of sediment-gravity flows, or an overall decrease in the mud fraction of the former. The overall concave upward topography associated with erosional submarine channels in MSU 2, suggests that, prior to hemipelagic draping (e.g. Figs. 7C-E, 8C-E), they were underfilled compared to MSU 1, where erosional submarine channels were generally overfilled (e.g. Fig. 5B).
Based on the foregoing observations, three major changes occurred in the sedimentary records of the western Niger Delta intraslope basins over the last 5.5 Ma (see Figs. 3-10). These changes include (1) the lower part of MSU 1 at the transition between the late Messinian thick hemipelagic drape dated at 5.5 Ma (horizon M) to the overlying erosional surface (horizon A), characterised by relatively confined, erosional submarine channels, thin MTDs and channel levee deposits (e.g. Fig. 3A, B); (2) the upper part of MSU 1 at the transition between horizons G and I, dominated by thick, laterally extensive MTDs and partially confined, repetitive incisional submarine channels/erosional surfaces, with complex cut and architecture (e.g. Figs. 2A, 3A-C, 5A, B, 6A, B); (3) the transition between MSU 1 and MSU 2 (horizons P/Q), which marks the onset of repetitive, highly incisional, submarine channels/erosional surfaces that are infilled with aggrading/meandering channel levee complexes, thin MTDs and hemipelagic drapes (where preserved; see for e.g. Figs. 3A, B, 7C-E 8C-E).
4.4 Sequence stratigraphic interpretation of MSU 2
The preceding 3D geomorphological analysis reveals that MSU 1 and MSU 2 present different seismic facies and morphology (Figs. 3-10). Using the biostratigraphically constrained late Messinian (5.5 Ma), the modern seafloor (0 Ma), and taking the observed changes in the sedimentary architecture into account (Figs. 3-10), we suggest that the change at the transition
29 between MSU 1 and MSU 2 (P/Q) boundary could have occurred around 0.8-1.0 Ma during the Middle Pleistocene Transition (MPT) as described in the literature (0.8-0.9 Ma; Miller et al., 2005; Lisiecki and Raymo; 2007; Fig. 10B, C). The eight seismic reflections identified in MSU 2 (horizons Q to X in Figs. 3-10), could represent eight fifth-order erosional surfaces (sequence boundaries). The hemipelagic drape, which marks the transition between MSU 1 and MSU 2 (horizon P), correlates with the moderate oxygen isotope (3.5%) and moderate sea-level variations (~12.5 m), before the more pronounced sea-level cycles with amplitudes reaching 100 m (Fig. 10B, C). This hemipelagic drape (horizon P), like horizon M at the lower part of MSU 1, was inferred to have been deposited during an overall high relative-sea level (see Chima et al., 2019 and references therein). The assigned age (0.8-1.0 Ma) agrees with that attributed by Benjamin et al. (2015), who suggested that this conformable seismic surface belonged to the middle Pleistocene. The repetitive motifs consisting of vertically stacked erosional submarine channels, infilled with aggrading/meandering channel levee complexes (CLCs) and MTDs (slides/slumps?), and hemipelagic drapes (where preserved), e.g. (Figs. 3A, B; 7C-E; 8D, E), appear to record the regressive-transgressive cycles previously documented on the eastern Niger Delta continental shelf (e.g. Fatoke and Bhattacharya, 2010; Jermannaud et al., 2010; Riboulot et
al., 2011). Similar architectural elements have been documented in the deep-water setting,
offshore the Rio Muni Basin (Equatorial Guinea), where the development of submarine canyons and their infilling turbidite systems were linked to a combination of allocyclic (relative sea level, tropical storms and tectonics), and autocyclic forcing, linked to submarine channel avulsions (see Jobe et al., 2011). What is more, the submarine channels with similar architectural features described in this study (Figs. 3-10), have been recorded in the deep-water Bowser Basin,
30 Northern British Columbia (Canada), where slope gullies and their infilling turbidite systems were linked to relative sea-level changes and local slope failures (Ricketts and Evenchick, 1999).
From the foregoing observations, it is reasonable to infer that the erosional surfaces observed in MSU 2 (horizons Q-X), notably, the repetitive, highly incisional submarine channels associated with horizons R, S, V, W and X (e.g. Figs. 3A, B; 7C-E, 8C-E), could represent what we call „the falling stage erosional surfaces‟ (FSESs; Fig. 12), equivalent to the basal surface of forced regression (BSFR) that are generally observed on the continental shelf (see Jermannaud et
al., 2010; Roby et al., 2011; De Gasperi and Catuneanu, 2014; Catuneanu, 2020). Where deeply
incised, the FSESs are locally overlain by the previously described basal MTDs or the bypass facies (e.g. Fig. 5B), which we interpreted as the falling stage systems tracts (see Posamentier and Kolla, 2003; De Gasperi and Catuneanu, 2014; Catuneanu, 2020). The infilling, aggrading/meandering channel levee complexes (CLCs) and MTDs (slide/slumps?) (Figs. 3A, B; 7C-E; 8C-E), were interpreted as lowstand to early transgressive systems tracts, while the hemipelagic drapes that generally cover the entire system (where preserved) (e.g. Figs. 3A, B; 7C-E; 8C-E), were interpreted as late transgressive to highstand systems tracts (see Posamentier and Kolla, 2003; De Gasperi and Catuneanu, 2014; Catuneanu, 2020). These architectural elements are rarely completely preserved either inside or outside the erosional submarine channels due to incessant mass wasting on the western Niger Delta slope (e.g. Figs. 2-10).
The estimated duration of the sequence in MSU 2 (see section 4.6 below), suggests that these architectural elements may have been controlled by glacio-eustatic sea-level oscillations over the last circa 0.8-1.0 Ma (see Miller et al., 2005; Lisiecki and Raymo; 2007; Fig. 10B, C). The estimated age of the last erosional surface in MSU 2 (horizon X; Figs. 3A, 10B, C) was interpreted as the LGM, at around ~20 ka, as also suggested by Jobe et al., (2015; 2016).
31 4.5 Sequence stratigraphic interpretation of MSU 1
Based on the above interpretation of MSU 2, MSU 1 could correspond to a deposition between 5.5 Ma and 0.8 Ma (horizons M-P), with the 11 erosional surfaces (labelled A to K), representing 11 fourth-order FSESs (sequence boundaries; Fig. 10B, C). Although, we included the hemipelagic drape (horizon M, dated at 5.5 Ma) in MSU 1 for calibration of the lower part of the MSU 1, the overlying erosional surface (labelled horizon A), which marks the onset of MTDs and channel levee deposits (Fig. 3B), was interpreted as the actual basal limit of MSU 1. The erosional surface associated with horizon A correlates with a high oxygen isotope value (> 4.5%), and one of the highest falls in the relative sea-level (> 25 m) during the early Pliocene (Fig. 10B, C). We suggest an age of 4.9 Ma for this 185 m deep erosional surface, reasoning that it could be correlated with the first major fall in sea level just after the late Miocene (5.5 Ma) high sea level (see Miller et al., 2005; Lisiecki and Raymo, 2007; Raymo et al., 2018; Fig. 10B, C). The 4.9 Ma we propose for this erosional surface (horizon A in Fig. 10B, C), disagrees with the late Miocene proposed by Benjamin et al. (2015), who lacked biostratigraphic control. The occurrence of the A horizon just above the hemipelagic drape dated at 5.5 Ma, its erosional character (Fig. 3A-C, 7C-E, 8C-E), and association with MTDs and CLSs, further support its nomination as a possible candidate for the fall in sea level in the early Pliocene around 4.9 Ma (see Miller et al., 2005; Lisiecki and Raymo, 2007; Raymo et al., 2018; Fig. 10B, C).
The transition at the upper part of MSU 1 (the G/I interface), is an ~120-m deep erosional surface (e.g. Fig. 4B), which tentatively correlates with a (> 30) m fall in the relative sea level and relatively high oxygen isotope (> 3.5%) (Fig. 10B, C). The erosional character of this surface coupled with its association with multiple CLSs (e.g. Fig. 4A, B), suggest that it could
32 have developed during a lowering of the relative sea level. The 176 m deep relief associated with horizon I (just above horizon G in Fig. 5B) and its complex cut and fill architecture, resemble the erosional submarine channels observed in MSU 2 (e.g. horizons R, V, W in Figs. 7, 8, 9A). The 176 m deep erosional submarine channel associated with horizon I and the overlying basal MTDs (bypass facies; e.g. Fig. 5B), could be interpreted as the falling stage erosional surface (FSES) and falling stage systems tracts, respectively (see Posamentier and Kolla, 2003; De Gasperi and Catuneanu, 2014; Catuneanu, 2020. Similarly, the infilling turbidite feeder channels/aggrading or meandering CLCs (e.g. Fig. 5B) could be interpreted as lowstand to early transgressive systems tracts, while the overlying hemipelagic drape could represent the late transgressive to highstand systems tracts (e.g. 5B, 6B).
The transition from CLS dominated intervals to repetitive, highly incisional submarine channels and mass-wasting dominated intervals is visible around horizons G and I (e.g. Figs. 3, 4, 5). This change in the sedimentary architecture could be associated with a fall in the relative sea level probably during the early Pleistocene, following the Northern Hemisphere Glaciation (NHG), which, in the literature, is documented to have occurred around 2.6 Ma (see Miller et al., 2005; Lisiecki and Raymo, 2007; Gibbard et al., 2010; Head and Gibbard, 2015a, b; Gibbard and Lewin, 2016; Raymo et al., 2018; Fig. 10B, C). Hence, we propose erosional surfaces G and I as possible candidates for the early Pleistocene but favour the latter due to its repetitive, incisional and aggrading/meandering patterns that resemble those described in the deep-water western Niger Delta over the last circa 120 ka as controlled by glacio-eustatic sea-level oscillations and sediment supply (see Jobe et al., 2015; 2016).
4.6 Sequence duration and sedimentation rates in MSU 1 and MSU 2
33 Sequence duration measures the ratio of the time interval for seismic unit development to the number of enclosed seismic surfaces (see Zhang et al., 2019). Using the estimated ages above, the sequence duration for MSU 1 yields (5.5-0.8) Ma/13= ~0.4 Ma (~400 ka) and (0.8-0) Ma/8 = ~0.1 Ma (~100 ka) for MSU 2. Using an average velocity of 1253.2 m/s obtained from Well-1 (W1) (Fig. 1E), the estimated sedimentation rates in non-decompacted MSU 1 and 2 are132 m/Ma and 370 m/Ma, respectively.
5. Discussion
We discuss the Pliocene and Pleistocene stratigraphic evolution of the western Niger Delta intraslope basins over the last 5.5 Ma in relation to allocyclic (glacio-eustatic) sea-level and basin tectonic forcings, and propose a deep-water depositional model.
5.1 Allocyclic (glacio-eustatic) sea-level forcing
Allocyclic factors refer to controls that are unrelated to the depositional system; these include climate, eustasy, tectonics and sediment supply (Einsele et al., 1991). Orbital parameters, such as obliquity and eccentricity forcings control global sea level, climate, drainage basin erosion, sediment supply, and more locally, environmental energy, and consequently influence the architecture of sedimentary units and their bounding surfaces (Zecchin, 2007; 2010; 2012; Catuneanu and Zecchin, 2013).
High subsidence rates (350 m/Ma) offset by high sedimentation rates (36.5 cm/ka) have been shown to facilitate the preservation of eccentricity sequences of 100 ka on the eastern Niger Delta continental shelf over the last circa 0.5 Ma (Riboulot et al., 2012), in agreement with observations of the Mediterranean margin over the last circa 0.5 Ma, where subsidence rates as
34 high as 255 m/Ma, accompanied by high sedimentation rates, enabled preservation of 100 ka eccentricity sequences, linked to glacio-eustatic sea-level oscillations during the Quaternary (see Rabineau et al. 2006; Leroux et al., 2014). Although we did not estimate subsidence rates over the last circa 5.5 Ma, the overall increase in the sedimentation rates (x3) at the MPT (0.8-1.0 Ma), possibly accompanied by high subsidence rates (see Goudie, 2005), is inferred to have facilitated the preservation of the 100 ka sequences we observed in MSU 2. This interpretation is also in agreement with that of Gulick et al. (2012), who documented an overall increase in the sedimentation rates at a source-to-sink-scale on the New Jersey margin (USA), linked to glacio-eustatic changes in sea level over the last 0.7-1.2 Ma.
Although the 400 ka eccentricity sequences we propose for MSU 1 are recognized to have strongly influenced sedimentation in ocean basins (e.g. Pälike et al., 2006; Boulila et al., 2011), eccentricity has rarely been described in the deep basin architecture. MSU 1 displays a 400 ka sequence duration and is characterised by the ubiquity of discontinuous seismic reflections, the preponderance of regional MTDs and erosional surfaces, characterised by complex cut and fill architecture in the upper part of the unit (Fig. 3A, B, 5A, B). These architectural features resemble the fourth-order incised valleys/slope canyons on the Foz do Amazonas continental shelf that were biostratigraphically constrained and, based on seismic records, calibrated as 400 ka eccentricity sequences in the Pliocene (see Gorini et al., 2014). Based on the repetitive motifs of erosional surfaces, the infilling aggrading/meandering channel levee complexes, hemipelagic draping (Figs. 3-10) and the sequence durations estimated in MSU 1 and MSU 2, our interpretation is that depositional sequences in the two units were organised in 400 ka and 100 ka sequences, respectively (Fig. 10B, C).
35 The Pliocene and the Pleistocene stratigraphy of the western Niger Delta intraslope basins, respectively characterised by mass-wasting and turbidite sequences, and by hemipelagic drapes and turbidite sequences (Figs. 3-10), is also comparable with the Pliocene and the Pleistocene stratigraphy of the Ulleung Basin, East Sea (Japan), which is characterised by, respectively, debris-flows and turbidite sequences, and hemipelagic drapes and turbidites sequences (see Yoo et al., 2017). In the Ulleung Basin, the Pliocene stratigraphy is mainly linked to tectonic deformation, while the Pleistocene is linked to changes in the relative sea level (Yoo
et al., 2017). However, the Pliocene and Pleistocene stratigraphy described in the present study
contrasts with that of the northern Gulf of Mexico (GOM), where tectonic subsidence is reported to have facilitated thick hemipelagic sedimentation/muddy turbidites and thin MTDs during the Pliocene compared to the Pleistocene, which is dominated by thick MTDs and thin hemipelagic sediments (Madof et al., 2017; Wu et al., 2020; Catuneanu, 2020). Madof et al. (2017) and Wu
et al. (2020), showed that the stratigraphy of the northern Gulf of Mexico over last 3.7 Ma was
mainly controlled by differential sedimentation and associated salt-related subsidence, while the overall increase in sedimentation rates over the Pleistocene was largely controlled by the capture of the Ohio and Missouri Rivers by the Mississippi in the late Pleistocene (see also Prather et al., 1998).
Pliocene and Pleistocene stratigraphy in the western Niger Delta intraslope basins was controlled by a combination of glacio-eustasy and shale tectonics (see discussion below). The observed increase in the sedimentation rates at the MPT (0.8-1.0 Ma), could be linked to (i) glacio-eustatic sea-level forcing linked to the Milankovitch cycles; (ii) regional climate forcing associated with the West African Monsoon, which has been shown to have interacted with drainage basins, erosion, and the supply of sediment to the Niger Delta since the Plio-Quaternary