HAL Id: hal-01086501
https://hal.univ-grenoble-alpes.fr/hal-01086501
Submitted on 24 Nov 2014HAL is a multi-disciplinary open access archive for the deposit and dissemination of sci-entific research documents, whether they are pub-lished or not. The documents may come from teaching and research institutions in France or abroad, or from public or private research centers.
L’archive ouverte pluridisciplinaire HAL, est destinée au dépôt et à la diffusion de documents scientifiques de niveau recherche, publiés ou non, émanant des établissements d’enseignement et de recherche français ou étrangers, des laboratoires publics ou privés.
Rethinking the role of scenarios: Participatory scripting
of low-carbon scenarios for France
Sandrine Mathy, Meike Fink, Ruben Bibas
To cite this version:
Sandrine Mathy, Meike Fink, Ruben Bibas. Rethinking the role of scenarios: Participatory scripting of low-carbon scenarios for France. Energy Policy, Elsevier, 2015, 77, pp.176-190. �10.1016/j.enpol.2014.11.002�. �hal-01086501�
ÉCONOMIE DU DÉVELOPPEMENT DURABLE
ET DE L’ÉNERGIE
UMR PACTE - pôle EDDEN
BP 47 - 38040 Grenoble CEDEX 9 - France 1221 rue des Résidences - 38400 Saint Martin d'Hères Tél.: + 33 (0)4 76 82 56 92 - Télécopie : + 33 (0)4 56 52 85 71
http://edden.upmf-grenoble.fr
Rethinking the role of scenarios
participatory scripting low-carbon
scenarios for France
Sandrine Mathy
octobre 2014
Cahier de recherche EDDEN n° 9/2014
Rethinking the role of scenarios:
participatory scripting of low-carbon
scenarios for France
Sandrine Mathy, PACTE-EDDENa and CIRED a
PACTE-EDDEN, Univ.Grenoble Alpes, BP 47, F-38040 Grenoble, France, +33 4 56 52 85 95
b
CIRED, Jardin Tropical, 45bis Avenue de la Belle Gabrielle, 94736 Nogent sur Marne cedex, France
sandrine.mathy@upmf-grenoble.fr
October 2014
Abstract:
This article considers the usefulness of low-carbon scenarios in public decision-making. They may be useful as a product-oriented trajectory. The scenarios on the agenda of the 2013 Energy Debate in France belong to this category. But a scenario may also be process-oriented, in the sense that its scripting process helps build consensus and a minimum level of agreement. We have scripted scenarios using a codevelopment method, involving about 40 stakeholders from the private and public sectors, and from the state: NGOs, consumer groups, trade unions, banks and local
authorities. They selected policies they considered acceptable for achieving 75% greenhouse gases emission reductions in 2050. These policies were then integrated in the Imaclim-R France technico-economic simulation model, as part of a high or moderate acceptability scenario. In the first case emissions were cut by between 58% and 72% by 2050; in the second case by between 68% and 81%, depending on the energy price assumptions. All these measures benefited jobs and economic growth, swiftly and durably cutting household spending on energy services. This offers a solid basis for gaining acceptability for low carbon trajectories; the process constitutes also a framework for consolidating collective learning centring on the acceptability of climate policies.
1. Introduction
The energy trajectories for achieving France’s Factor-Four (F4) target – a fourfold cut in greenhouse gas (GHG) emissions by 2050 compared with 1990 – have prompted lively debate. As part of the energy debate in France in 2013, the second working group (Arditi et al., 2013) was tasked with comparing and assessing existing scenarios in order, if possible, to define a trajectory for energy transition. About 15 scenarios, developed by very diverse bodies1 with sometimes very conflicting
interests, were tabled. It proved impossible to reconcile their respective views so these exercises
1
were of little use to public decision-makers and had only limited value for raising awareness of the need for energy transition.
Starting from this observation, the present article seeks to review the usefulness of low-carbon scenarios. They may serve a wide range of goals, which fall into two main categories: product-oriented or process-product-oriented scenarios (Wilkinson and Eidinow, 2008; Hulme and Dessai, 2008; O’Neill et al, 2008; O’Neill and Nakicenovic, 2008). In the first case, the prime objective is the scenario itself and its content in terms of a technology and energy trajectory. In the second case, what matters is the process itself used to bring about the scenario, the aim being to achieve
consensus, minimum levels of agreement or at the very least a common understanding of the stakes. The scenarios debated in France in 2013 were tabled as finished products and belong in the first category. Framed by energy experts and engineers they focus largely on the technological aspects of transition (Mathy et al, 2011), about which the advocates and opponents of many ‘low-carbon’ technologies are in dispute. Controversy centres on wind power (Nadai and Labussière, 2009), biofuels, nuclear energy (Bonneval and Lacroix-Lanoë, 2011), shale gas (IFOP, 2013), carbon capture and sequestration (Ha Duong et al, 2009), and even electric vehicles (Thiel et al, 2012). Furthermore, a large number of low-carbon scenarios are based on the assumption of seamless penetration by the relevant technologies, guided when appropriate by a single, cross-the-board carbon price
(Söderholm et al, 2011).
Technological solutions are necessary but not sufficient to meet long-term low-carbon targets
(Edenhofer et al., 2010). Far-reaching shifts in energy demand are also needed, involving measures to control energy demand and improve energy efficiency, but also changes in urban planning. The price of carbon on its own cannot drive this transition and a mix of policies will be required (Fischer and Newell, 2004; Lécuyer and Quirion, 2013). Yet these too raise issues of acceptability which must be taken into account when assessing low-carbon trajectories, because poor acceptability can slow down deployment of such policies: witness the carbon tax (Hourcade, 2012), renewable-energy support mechanisms (Bökenkamp et al, 2008), demand-response policies (Wolsink, 2012) or restrictions on the use of private motor vehicles (De Groot and Steg, 2006), among others.
The concept of acceptability is based on individual factors, linked to psychology and value (Steg et al, 2005), but also institutional and procedural factors (Devine-Wright, 2008). Its scope may be enlarged by a better understanding of the subject, by co-development, compensation or redistribution systems. Greater transparency in the decision-making process is a pre-requisite, through participatory approaches involving the general public and stakeholders. These practices have developed in many fields of environmental protection (Renn, 1999; Van Asselt and Rijkens-Klomp, 2002; Wilcox, 2003; Hulse et al, 2004; Pahl-Wostl, 2002; Patel et al, 2007) particularly energy and climate change (Dorfman et al, 2013).
As recommended by Garb et al (2008), we propose here to use a co-development method to script low-carbon scenarios with stakeholders, focusing on the issue of the acceptability of policies and technologies. All the policies identified as being acceptable are then aggregated in the Imaclim-R-France general-equilibrium model, for quantitative economic and environmental assessment. Only a few examples of methodologies combining stakeholder panels and economic modelling exist and either they do not focus on climate policy acceptability (Schmid and Knopf, 2012) or there is no direct link between the participatory process and economic modelling (EC, 2011; de Perthuis et al., 2011).
Section 2 presents the methodology developed and the Imaclim-R-France model. Section 3 presents results concerning: (i) the acceptable policies considered by stakeholders; (ii) the scripting protocol to define a ‘high-acceptability’ (HA) scenario and a ‘moderate-acceptability’ (MA) scenario; and (iii) the quantitative assessment of the two scenarios. Section 4 discusses the way in which the process could evolve towards a set of acceptable policies of broader scope, more likely to achieve the Factor-Four target. Section 5 summarizes the main results, presents policy implications and concludes with a review of the pros and cons of the participatory process.
2. Methods
2.1. Collaborative scenario-scripting process
Three days of consultations (for residential, transport and electricity respectively) sought to gauge the degree of acceptability of low-carbon climate and technology policies for the various
stakeholders. The priority when selecting the latter was to engage stakeholders with sufficiently diverse and contrasting positions. Diversity is critical for enhancing learning processes on complex issues so it was important that a variety of perspectives, including marginal views, should be
presented in a balanced way2. The selection process was based on the grid developed by Mendelow
(1991), mapping their level of interest in action against their power, the aim being to bring together players from each of these sectors actively involved in deciding, implementing and funding policies, or in upholding end-user interests. As this approach cannot be applied in complete isolation, interviews with professionals from each sector were used to endorse the resulting matrix. Stakeholders included representatives of local authorities, consumer groups, professional
federations, public and private operators, banks and NGOs3. As the aim was to enable each of the
stakeholders to have a say, an upper limit of 15 participants was set for each workshop. The list of stakeholders is available in Appendix B. No document apart from the description of the project was sent to stakeholders before the workshop. Debate was fuelled by a presentation of the stakes for changing patterns of energy consumption and GHG emissions, with sector-specific studies of policies capable of altering existing dynamics. Drawing on a review of the scientific literature the project team selected measures and technologies to frame sector-specific questionnaires. The aim of these questionnaires was to assess the acceptability level of measures or technologies for each player but panellists had the opportunity to suggest measures outside these lists and other design options. Each measure was extensively debated and design options were discussed in such a way as to overcome obstacles for acceptability if possible. It was important that stakeholders should not see the concept of acceptability with a professional bias, but rather in a socially pro-active light: would a policy, depending on the yet-to-be-decided design options for its deployment (scope for compensation, for instance), have acceptable impacts for economic players and consumers in order to achieve the Factor-Four target? It is nevertheless hard to be certain that everyone’s answers reflected this stance. Given the number of stakeholders it was not possible to subject the answers to econometric
2 For example, for the power sector, stakeholders as contrasted as Electricité de France (incumbent operator)
and the CLER (NGO promoting renewables) were part of the process.
3
The same categories of stakeholders took part in the Grenelle de l’Environnement, an innovative political process initiated in 2007 in France in order to frame long-term decisions for the environment. It hosted discussions on ecology and sustainability between all the relevant social stakeholders.
processing, but the degree of agreement between stakeholders on the acceptability of the various measures was calculated. This was assessed by the proportion of stakeholders supporting a measure. Two levels were selected: high-acceptability with 75% stakeholder support; and
moderate-acceptability, with 50% support.
2.2. The Imaclim-R-France hybrid model
Imaclim-R-France4 is a computable general-equilibrium model belonging to the Imaclim family of
models developed by Cired (Waisman et al, 2012a; Sassi et al, 2010; Crassous et al, 2006). It is a hybrid model which represents, year by year from 2004 to 2050, simultaneous changes in technology systems and the economy. Given the limitations of inter-temporal equilibrium models, which
describe a stabilized economic trajectory, with optimal allocation of investments, Imaclim-R uses a recursive architecture to represent both the long-term growth engine (demographic growth and labour productivity) and the various forms of short-term friction which may arise (faulty forecasting, incomplete use of production factors, inertia at various levels – equipment, technology, preferences, trade or capital flows). Economic growth is thus described as a succession of static equilibriums, representing for each year an economic balance sheet (production, consumption, international trade) through a Walrasian equilibrium. The economy’s dynamic is represented by sector-specific models reflecting shifts in technology and stocks of production factors (capital, labour, natural resources), thus fuelling gradual growth between each static equilibrium (Figure 1).
Figure 1: The recursive and modular structure of the IMACLIM-R model
Each static equilibrium does not describe the collective optimum of production taking account of the available technology. On the contrary the equilibrium is constrained in a sub-optimal situation by the inertia of equipment and the imperfect allocation of investments between sectors, entailing for example surplus production capacity in some sectors and under-capacity in others, thus causing
tension on prices and volume, a lack of full employment due to insufficient flexibility in the labour market, distortions caused by previously existing taxes or indeed allowance for the behavioural routines of economic agents.
The dynamics of the economy is governed by endogenous descriptions of capital accumulation and technical change. Capital accumulation is given by investment by firms, household savings and international capital flows. The cross-sector distribution of investments is governed by expectations of sectoral profitability subject to imperfect foresight and technical conditions as described in sector-specific reduced forms of technology-rich models. Imperfect foresight is a consequence of
uncertainty about future relative prices, final demand and investment profitability, other non-energy prices (land and real estate) and non-economic determinants of public decisions in transportation and urban planning. At a given date, agents have limited information about the future and shape their expectations on the basis of past and current trends (adaptive expectations). Under such semi-myopic foresight, installed capital resulting from past investment decisions may not be suited to future economic conditions. However, it cannot be renewed overnight due to inertia and acts as a constraint on adaptability to variations in economic conditions (activity levels and prices).
The economy is broken down into 13 sectors: energy (crude oil, refined oil, gas, coal, electricity), transport (road transport of goods, shipping by sea and inland waters, air transport, collective passenger transport), construction, energy-intensive industry, agriculture and services. Energy is represented in values and physical quantities enabling the respective roles of each energy sector to be isolated, as well as their interaction with the rest of the economy. The use of physical variables (number of motor vehicles, collective dwellings or individual houses, annual energy efficiency of technologies, etc.) enables rigorous integration of sector-specific data related to the impact of economic incentives on final demand and technology systems, and dialogue with non-modellers. The agents represented displayed the following specific patterns of behaviour in the dynamic modules:
- In the residential sector the behaviour of the owners of dwellings is modelled using
generalized cost functions (Giraudet et al., 2012) taking into account investments in thermal retrofitting and new heating equipment, depending on the efficiency, resulting energy savings discounted over the equipment’s lifetime, and intangible costs reflecting the imperfect nature of information. Discount rates specific to each type of ownership (owner-occupier, landlords of individual or collective dwellings, social housing organizations) allow the ‘landlord-tenant dilemma’ to be represented, as well as the difficulty of renovating collective dwellings. The increase in the quantity and quality of renovation reflects changes in the relative return on various levels of ambition in thermal renovation, induced by rising energy prices and supported by falling renovation costs through learning-by-doing.
- The model of the electricity sector (Bibas and Mathy, 2011) represents development of additional capacity in line with forecasts of changing demand and the shape of the load profile, either from a planning perspective (overall cost minimization), or from that of project-owners (payback period minimization or return on investment maximization). The model represents a wide range of technologies (coal and gas with or without carbon capture and storage (CCS), nuclear, solar, wind, biomass and hydro) with their technical and
economic specifications, and an hourly load profile.
- Spatial mobility and share of transport modes (Waisman et al, 2012b) are the result of maximizing the utility function subject to the dual constraint of income and time-budget (Zahavi and Talvitie, 1980) to capture the connections between final demand, and
infrastructure and equipment availability. The possible modes are private cars, collective land and air transport, and green modes. Building new infrastructure for one of these transport modes reduces congestion and increases the speed of travel by this mode which is taken into account in the time-budget. The efficiency of the fleet of cars depends on which technology households choose when purchasing a vehicle and technical progress. The vehicle fleet is broken down into generations, depending on the year they entered service and five types of technology: conventional or hybrid (both of which may be efficient or standard), and electric. The specifications of each of these technologies vary over time in line with technical
advances. Each year, the technological make-up of the new generation of vehicles is the result of agents choosing from a range of explicit technologies, comparing for each available technology, the discounted average cost associated with producing one vehicle-kilometre. - Freight demand (Waisman et al, 2012b) is obtained by aggregating demand for goods
transport in each productive sector. It is directly related to modes of consumption and the structure of the economy, and only slightly sensitive to the price of energy, modal choices being dictated to a larger extent by logistic options and supply-chain organization. Changes in the energy efficiency of maritime or air transport are exogenous, whereas the energy
efficiency of land (road and rail) transport depends on a fuel-price elasticity of -0.4.
Variations in energy consumption simultaneously reflect technology changes, modal shifts (in particular freight shifting from road to rail) and changes affecting the sector’s structural components.
- In other sectors, in addition to autonomous technical progress calibrated on previous trends, variations in energy prices including a possible carbon tax induce (with imperfect foresight on energy-price evolution affecting investment decisions) additional gains in energy efficiency and energy substitution.
The model thus shows how climate policies such as carbon taxation, incentives for the thermal renovation of housing, energy-efficiency regulation for equipment or transport-infrastructure policies, among others, impact on the decisions and behaviour of agents. Incentive policies are directly integrated in investment costs and energy prices, while the energy-efficiency coefficients of the various generations of capital goods include the effects of regulation.
3. Results
3.1. Scenario definition
In this part we describe the sector-specific workshops with the stakeholders5, detailing the
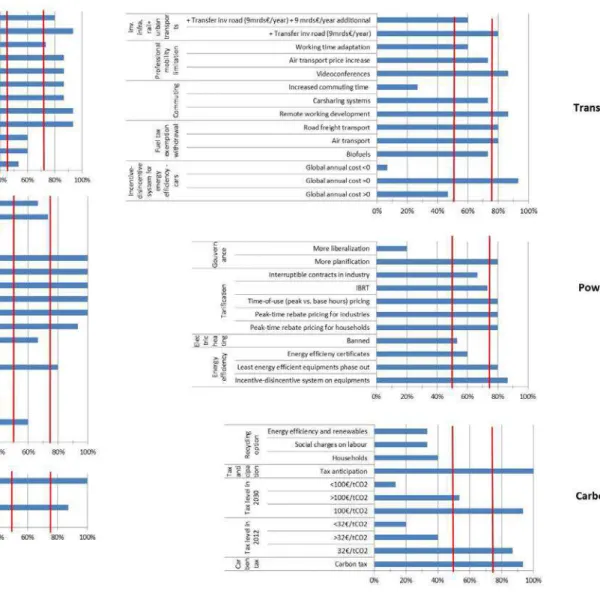
sector-specific issues addressed and analysis of the questionnaires. The latter reveal the degree of support for policies and technologies summarized in Figure 2, which leads to definition of the two scenarios.
5 These workshops did not deal with a paradigm shift in patterns of consumption such as the emergence of
generalized preferences for a more frugal way of life. Such considerations are beyond the notion of
acceptability as defined in the project. The resulting scenarios may consequently seem conservative compared with some visions describing a real paradigm shift.
3.1.1. Acceptable policies in the residential sector
In 2010 the residential sector in France was responsible for 30% of final-energy consumption, two-thirds of which were due to heating. More than half the existing housing stock dates from before the introduction of the first regulations on thermal-efficiency in 1975, but more than two-thirds of the housing stock which will be available in 2050 has already been built. The challenge for the
construction sector, over and above stricter thermal-efficiency regulations for new buildings, is to speed up and raise the targets for renovating existing buildings. Furthermore, with regard to new buildings, the Grenelle de l’Environnement6 approved ambitious thermal-efficiency regulations: low-energy buildings] starting in 2012 (50 kWh/m2/year) and low-energy-plus building certification starting in 2020.
The majority of stakeholders endorsed the conclusions of Giraudet et al. (2012), namely that incentive instruments alone (zero-interest loans for thermal retrofitting or tax credits for the purchase of energy-efficient equipment) would not be sufficient to achieve the ambitious energy consumption reduction required. Even if thermal-efficiency renovation ultimately shows a return, the priority for households is thermal comfort (Maresca et al., 2009). These incentive tools are
nevertheless necessary and the associated targets must be raised. Among others, we follow the proposals of Callonec and Nauleau (2012) for a 40% increase in the level of sustainable-development tax credits.
To fully understand the dynamics of action on thermal renovation the stakeholders recommend a specific approach for each type of dwelling.
- For individual houses compulsory retrofitting would be moderately acceptable for reasons of personal freedom; it would be more cost-effective to focus on dwellings with poorer energy performance. Stakeholders think it would be more acceptable and plausible to introduce more powerful incentive instruments, set up third-party funding systems, and provide better information on the benefits of thermal renovation.
- Compulsory retrofitting in collective dwellings would be more acceptable if combined with financial support and provisions for reducing financial risk (energy-performance contracts, compulsory retrofitting funds, etc.), and if it targeted the largest buildings and those with the poorest performance.
- Compulsory retrofitting does not seem necessary for social housing, providing dedicated financial instruments (third-party funding, energy-performance contracts and loans at preferential rates) are developed. Due to its governance and organisational structure this
6
part of the residential sector is the most suitable for a thermal renovation programme even with a 30-year return on investment.
Specific thermal-renovation programmes will be needed to combat fuel poverty, but incremental block tariffs (IBT)7 seem to be a suitable response.
3.1.2. Acceptable policies in the transport sector
Transport accounts for 34.2% of CO2 emissions in France (of which 93% is due to road transport),
with a 14.4% rise between 1990 and 2007. For several decades transport has registered the steepest growth in energy demand, with the dual feature of largely captive use of oil and low sensitivity to price signals (Goodwin et al, 2004), particularly in the short term. This observation highlights the limitations of any attempt to internalize the carbon constraint based exclusively on price signals. There is agreement in the literature that technological innovation has an important part to play in the post-carbon transition, but large-scale changes in modal structure and demand for mobility will also be necessary.
Speed/GDP elasticity is a good indicator for obtaining contrasting views of shifts in spatial mobility. With commuters travelling further, thanks to substantial growth in the road network over several decades, the time budget has remained almost constant. These trends are reflected in positive speed/GDP elasticity. However, perpetuating past trends at a time of carbon constraint, while keeping the time budget constant (i.e. positive speed/GDP elasticity), would entail costs developing infrastructure for ‘fast’ transport modes which seem unrealistic and unacceptable. On the other hand, with zero speed/GDP elasticity, greater spatial mobility must go hand-in-hand with an increase in the time budget, which stakeholders are reluctant to accept. Individual mobility can no longer progress as before and efforts must consequently be made to reduce the negative externalities of transport, by relocating activities and developing alternatives to road transport. The stakeholders largely acknowledge the need to shift investment from road transport to other modes, but the acceptable volume of investment is subject to caution, between simply transferring funds previously invested in roads (€9 billion a year) at exactly the same level, or the need to mobilize additional investment, over and above the basic transfer (worth €9 billion a year plus an additional €9 billion). The proposals submitted to stakeholders regarding the level of investment in infrastructure were taken from Lopez-Ruiz and Crozet (2010).
Stakeholders want a tariff scheme integrating the negative externalities of transport (withdrawal of fuel-tax exemption, tax on aviation fuel, eco-duty on heavy-goods vehicles and a carbon tax). Such measures gain acceptability among stakeholders if revenue from these new tariff policies is used to finance rail infrastructures and public transit. To support changes in behaviour, the drive to reduce the need for spatial mobility must also involve ‘soft’ measures, much as more widespread remote-working and car-sharing schemes.
There was consensus on the potential of technology: electric vehicles would be restricted to niche markets in urban areas, alongside the development of a functionality economy, with the rest of the
7 Under an IBT scheme the tariff rises as consumption increases. A lower price is charged for the first kWh
fleet consisting of conventional, internal-combustion powered vehicles and hybrid vehicles, of a significantly higher standard thanks to the support of an incentive-disincentive system (provided it came at no additional cost to the state).
3.1.3. Acceptable policies in the electricity sector
France is characterized by low emissions in the power sector (62 gCO2/kWh, compared with a
European average of 347 gCO2/kWh) due to the contribution of nuclear (77%) and hydro (11%)
energy. However, due to the weight of nuclear energy, renewable electricity (excluding hydro) currently represents only 2% of electricity generation. To diversify the energy mix and reduce dependency on nuclear energy, President Hollande decided the share of nuclear energy should be cut to 50% by 2025. As nuclear plants are on average nearly 30 years old, the question of replacing some of them with new nuclear plants, extending their service life, or indeed replacing them altogether with other technologies has prompted lively debate. A majority of stakeholders nevertheless considered that it would be acceptable to extend the service life of the most recent plants, while gradually downscaling the share of nuclear power in the energy mix, and encouraging and supporting greater use of renewable energy sources. Due to the problems posed by local acceptability there was no consensus on the level of development of onshore wind power. However there was demand for maintaining preferential feed-in tariffs to encourage take-up of renewables. There was broad agreement on the acceptability of improved energy efficiency and regulations should be drastically tightened up. To reduce the size of the rebound effect, following gains in the energy-efficiency of equipment, the introduction of IBT was considered acceptable.
Long-term investment planning and the development of demand-response tools (dynamic pricing such as peak-rebate or time-of-use pricing) will be needed to address the problems of balancing supply and demand under conditions of increasingly frequent spikes in consumption, production capacity failing to meet peak demand, and over or under-capacity.
3.1.4. Carbon-tax acceptability
Several attempts have been made to implement a carbon tax in France8 and several expert reports
(Quinet 2009, 2013; Rocard 2009) proposed guidelines for its implementation. The Quinet report (2009) recommended a carbon tax at a rate of €32 per tonne of CO2 in 2010, rising to €56 in 2020,
€100 in 2030 and between €200 and €350 in 2050. These values correspond to the implicit value of the constraints for reducing CO2 emissions entailed by the -20% target in 2020 and the Factor-Four
target in 2050.
The stakeholders largely supported the introduction of a carbon tax at the rates recommended by the Quinet report, highlighting the importance of the tax’s progressive nature being predetermined over time so that economic agents could allow for it in their decisions and investment choices. This result, which is very different from the state of public debate on the carbon tax, is certainly due to the bias embodied by the stakeholders taking part in the process, generally better informed and
8 In 2000 the Constitutional Court rejected an initial proposal. Following the Grenelle de l’Environnement a new
project was introduced in 2009 to tackle all the diffuse emissions not covered by the European Emissions Trading System. A number of discounts or exemptions were announced for industry and agriculture. France’s Constitutional Court ruled that it would violate principles of equality because of the range of industrial emissions exempted.
more aware of climate-change issues than the average person. It nevertheless bears out the basic challenge for the carbon tax: households and economic players must make allowance for this tax in their capital investments in order to reduce energy consumption and the corresponding bills.
Three options for recycling tax revenue were proposed: payment of a lump sum to households; lower social charges on labour; or support for renewables and energy efficiency. On the basis of the
responses to this question, it was not possible to single out a particular option.
3.2. Scripting protocol
The policies selected in the previous section were integrated in the Imaclim-R-France model as part of two scenarios: a high-acceptability scenario (HA) and a moderate-acceptability scenario (MA), respectively comprising the policies for which stakeholder support exceeded 75% and 50% (Figure 2). The high-acceptability scenario comprises:
- In the residential sector, a set of financial and non-financial incentive measures designed to lower the cost and share the risk for the decision-maker of thermal renovation work and IBT for electricity;
- In the transport sector, the penetration of energy-efficient and hybrid vehicles supported by an incentive-disincentive scheme – electric vehicles remaining restricted to niche markets – cross-the-board enforcement of fuel tax, a tariff scheme integrating the negative
externalities of transport, ‘soft’ measures to limit forced spatial mobility and a substantial transfer of investment from roads to rail and urban transit;
- In the electricity sector, measures to enhance the energy efficiency of equipment, to ‘smooth out’ the load profile, a reduction in nuclear power’s share of the energy mix coupled with the development of renewables and a 20-year extension of the service life of the most recent nuclear installed capacity amounting to 40 GW9;
- A carbon tax at the rate recommended by the Quinet report (2009), with anticipation of the tax rate and recycling of revenue in the form of green cheques for households10.
9 This option did not obtain 75% support but did poll the most votes. 10
The two other options under consideration – recycling to allow lower social charges on labour, or to support improved energy-efficiency and development of renewables – were also tested, but they made only a marginal difference to the results presented in the following part.
The moderate-acceptability scenario includes all the high-acceptability measures with, in addition, further investment in alternatives to road transport, compulsory retrofitting of the housing stock, starting with social housing, gradually extended to achieve a steady number of renovation projects over time, and greater development of onshore wind farms.
The baseline scenario (REF), with none of these policies, only includes the advances made by the Grenelle de l’Environnement with respect to energy-efficiency regulations for new buildings and the 20% renewable-energy targets for 2020. The remaining technological advances and gains in energy efficiency are governed, in addition to autonomous technical change, by imperfect foresight affecting energy-price assumptions.
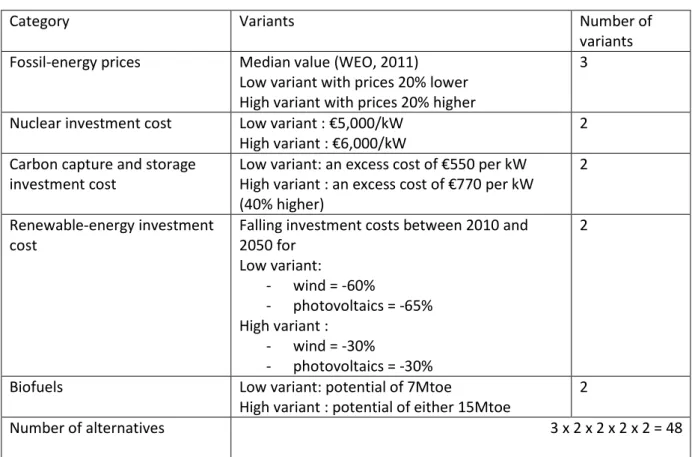
The scripting protocol uses three groups of scenarios (baseline (REF), high acceptability (HA) and moderate acceptability (MA)) each with a total of 48 alternatives (Table 1) in order to take into account uncertainty regarding technological progress and changes in fossil-fuel prices.
Table 1: Alternative assumptions for fossil-energy prices, technology costs and biofuels potential.
Category Variants Number of
variants Fossil-energy prices Median value (WEO, 2011)
Low variant with prices 20% lower High variant with prices 20% higher
3
Nuclear investment cost Low variant : €5,000/kW High variant : €6,000/kW
2 Carbon capture and storage
investment cost
Low variant: an excess cost of €550 per kW High variant : an excess cost of €770 per kW (40% higher)
2
Renewable-energy investment cost
Falling investment costs between 2010 and 2050 for Low variant: - wind = -60% - photovoltaics = -65% High variant : - wind = -30% - photovoltaics = -30% 2
Biofuels Low variant: potential of 7Mtoe
High variant : potential of either 15Mtoe
2
Number of alternatives 3 x 2 x 2 x 2 x 2 = 48
NB : Investment cost assumptions for nuclear, carbon capture and storage and renewable energies are adapted from the TECHPOL database that is used for technological assumptions of the POLES model, a dynamic partial equilibrium model, designed for the energy sector.
3.3. Modelling Results
3.3.1. CO2 emissions
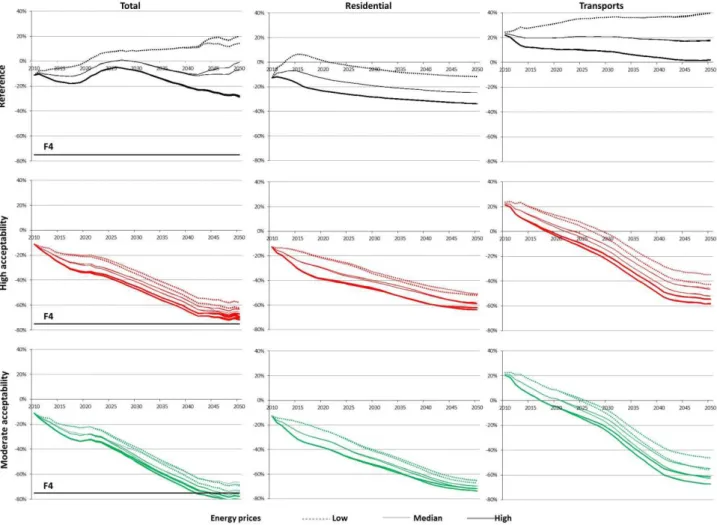
Taking all the combinations for implementing policies, dependent on the baseline, high or moderate-acceptability scenarios, leads to highly contrasting CO2 emission profiles, starting early in the 2010-50
period (Figure 3). Within each group of scenarios, the main determinant of the 48 alternatives is uncertainty regarding fossil-energy prices.
In the baseline scenario emissions in 2050 vary by a total of about 20% on either side of the 1990 figure, depending on energy-price assumptions. In the high-acceptability scenario, emissions drop by 2050 by between 58% and 72%; in the moderate-acceptability scenario by between 68% and 81%. So only the moderate-acceptability scenario can achieve the Factor-Four target, provided energy prices are not too low. Furthermore, starting in 2040, a surge in emissions in the electricity sector (see below) combined with the slowdown in emission-abatement in other sectors leads to stabilization of emissions between the high and moderate-acceptability scenarios.
For 2020 the main determinant in the degree of CO2 emission-abatement is not due to any difference
between the high and moderate-acceptability scenarios, but to energy-price assumptions: the smallest reductions are observed for low energy prices (down 22% on average), the largest reductions for high prices (down 33% on average), with a 28% drop in emissions for the median assumption.
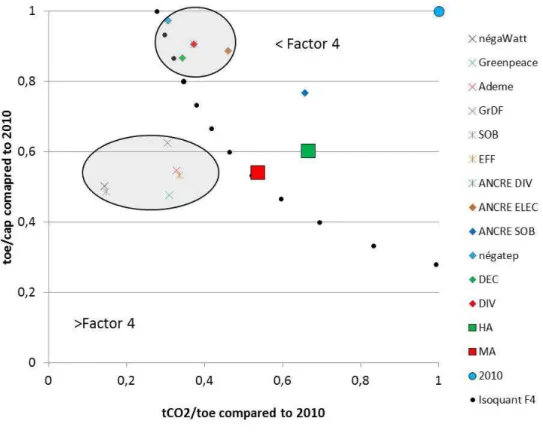
For simplicity’s sake, results in the following are presented for the median energy-price assumption, and for the most optimistic assumptions regarding technical advances, unless otherwise specified. Figure 4 assesses the emission-abatement trajectories of the high and moderate-acceptability scenarios in relation to French scenarios tabled during the 2013 energy debate. Two groups of scenarios stand out. The first group, located above the isoquant, comprises scenarios close to but not actually achieving the target with emission abatement largely due to high decarbonization of energy (50% to 70%) but only limited reduction in per capita final energy consumption. In the second group, the scenarios exceed the Factor-Four target and combine high decarbonization of energy (60% to 80%) and substantial reduction in per capita final energy consumption (about 50%). The
high-acceptability scenario does not belong to either of these groups, emission-abatement being too low. The moderate-acceptability scenario, straddling the isoquant, comes close to the second group of scenarios. Both the high and moderate-acceptability scenarios are on the same straight line
originating in 2012, representing equilibrium between emission-abatement due to decarbonization and energy efficiency. But both seem fairly conservative with regard to energy decarbonization. Figure 4: Distribution of emissions cuts between lower final-energy consumption and energy de-carbonization in relation to 2012
3.3.2. Residential sector
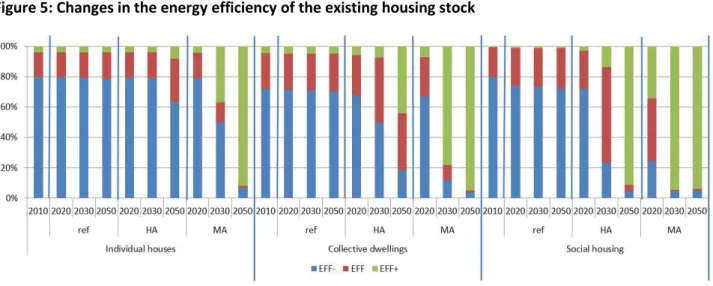
For each of the assumptions regarding energy prices, the policies integrated in the high-acceptability scenario result in cuts ranging from 50% to 60% compared with 1990 in the residential sector. Compulsory retrofitting cuts emissions by a further 15% by 2050. Under the high-acceptability scenario financial incentives and measures to limit the risks involved in funding renovation work are not sufficient to achieve a massive shift to the highest levels of energy performance in existing buildings, except in social housing where C-grade labels11 feature largely (Figure 5). On the other hand, with compulsory retrofitting under the moderate-acceptability scenario all segments of the housing stock qualify for B-grade labels. These results are consistent with the findings of Giraudet et al (2012): the only means of achieving the Factor-Four target would be to impose compulsory retrofitting, whereas incentives on their own would severely restrict emission reductions and the number of thermal renovation projects.
Figure 5: Changes in the energy efficiency of the existing housing stock
11
In France, energy efficiency in the residential sector is classified according to energy labels ranking from least efficient (G-label for energy consumption higher than 450 kWh/m2/year) to most efficient (A-label for energy consumption lower than 50 kWh/m2/year).
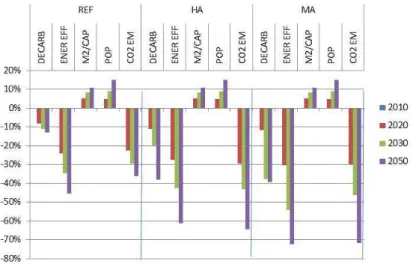
Figure 6: Breakdown of emission reductions (CO2 EM) in the residential sector (on 2010), between decarbonization of energy (DECARB), improved energy efficiency of the housing stock (ENER EFF), variations in population (POP) and per capita floorspace (M2/CAP). EFF- comprises G, F, E and D energy labels; EFF, C; and EFF+, B and A.
These emission reductions are due to the combined effects of the improved energy-efficiency of buildings, achieved through thermal renovation work, and more widespread construction of low-energy and low-energy-plus buildings, uptake of zero-carbon low-energy sources for residential heating, through the penetration of biogas, wood and electricity. Increases in per capita floorspace and population do not jeopardize these gains (Figure 6).
3.3.3. Transport sector
In the transport sector measures under the high-acceptability scenario reduce emissions in 2050 by between 37% and 58%, compared with 1990, depending on the assumptions for fossil energy prices. With the additional investment in infrastructure, other than roads, introduced under the moderate-acceptability scenario, emission reductions ranging from 47% to 68% are achieved by 2050.
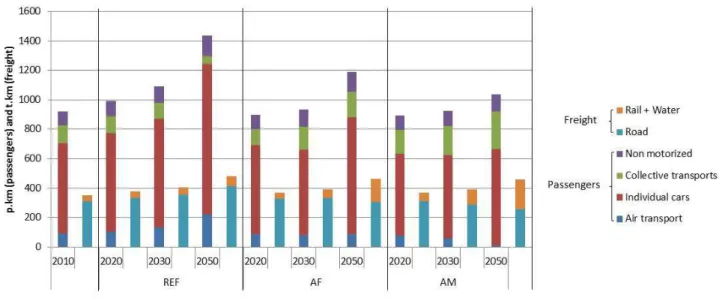
For passenger transport, overall emissions under the baseline scenario remain constant compared with 2010, due to the combined effect of increased individual mobility and improvements in the energy efficiency of motor vehicles. Modal shares are also largely the same as at present. The policies introduced under the high-acceptability scenario significantly contain rising demand for transport, while increasing the share of collective transport. Both the high and moderate acceptability scenarios integrate the assumption that use of biofuels and low-energy vehicles will increase. The higher investment involved in the moderate-acceptability scenario is directed to developing alternatives to road transport (Figure 7).
For goods transport, CO2 emissions drop by 13% by 2050 compared to 2010 in the baseline scenario,
by 45% in the high-acceptability scenario and by 55% in the moderate-acceptability scenario. These emission reductions do not reflect a radical paradigm shift, given that decoupling of freight demand in relation to production is only 15% between 2010 and 2050. This means that with a 50% increase in the production index in 2010-50, demand for goods transport in both emission-reduction scenarios increases by about 35%.
The other factors driving emission reductions are the penetration of biofuels which represent almost half the liquid fuel consumed in 2050, the enhanced energy efficiency of road transport per unit of transported goods driven by price signals (carbon tax, cross-the-board fuel tax and eco-duty on heavy-goods vehicles) and the modal shift to non-road transport induced by infrastructure investments. The additional gains registered by the moderate-acceptability scenario, over its high-acceptability counterpart, are also due to an even greater modal shift (Figure 7).
Figure 7: Trends for passenger and goods transport; modal distribution.
3.3.4. Electricity sector and energy system
The electricity sector is subject to a twin dynamic in the high and moderate-acceptability scenarios, compared with the baseline scenario: efficiency gains in the energy system as a whole and a significant rise in the share of electricity in the final-energy mix (Figure 8) driven by its increasingly competitive price compared to other energy sources in spite of the highest increase in electricity prices after 2035 in the high and moderate-acceptability scenarios compared to the baseline (Figures 9 and 10) whatever the alternative.
As a result the level of electricity production in the high and moderate-acceptability scenarios does not vary a great deal in relation to the present day, unlike the baseline scenario. The changes in the energy mix comply with stakeholder recommendations: powerful penetration by renewables, disappearance of coal, and a substantial drop in the share of nuclear power. From 2040 onwards increased use of gas is also made necessary. However at this point in time, given the cost
assumptions, CCS is not profitable. This explains why emission reductions bottom out towards the end of the period in both the high and moderate-acceptability scenarios. Several options could prevent this surge in CO2 emissions: a higher (explicit or implicit through regulation of emissions) carbon price in the power sector to favour CCS technology, the larger penetration of renewable energies (coupled with electricity storage), or greater demand-side management and smart-grid development through more regulation or higher price signals. These options could be investigated with the implementation of an iterative loop as described in the discussion section.
Figure 8: Energy-mix trends for electricity and final energy
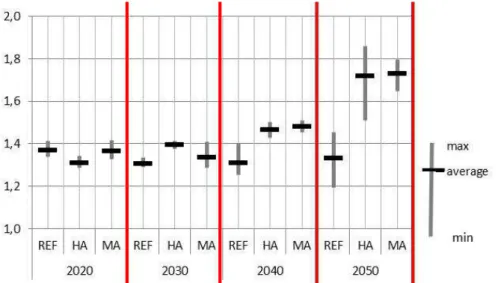
Figure 9: Evolution of electricity price in all alternatives of REF, HA and MA scenarios. Index 1= 2010. Full range in grey, average value in black.
Figure 10: Evolution of relative energy prices compared to electricity price in all alternatives of REF, HA and MA scenarios. Index 1= 2010. Full range in grey, average value in black.
3.3.5. Economic assessment
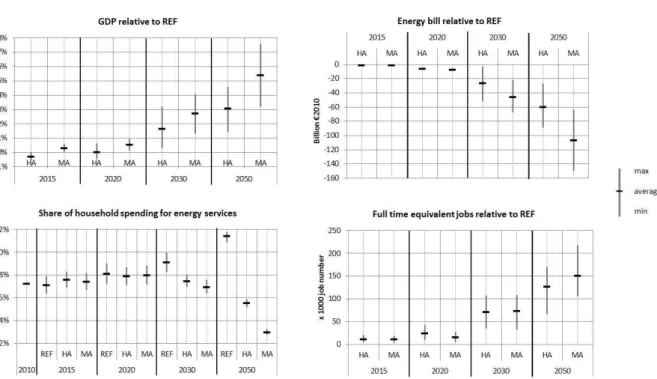
The economic impacts of the baseline, high and moderate-acceptability scenarios are shown in figure 11 for all the alternatives. Apart from the start of the reference period, under the high-acceptability scenario and assuming low energy prices, growth is always higher with the emission-reduction policies, more markedly so for the moderate-acceptability scenario than for its high-acceptability counterpart. These results are correlated with job creations. The drop in the share of household spending allocated to energy services (cost of thermal renovation, energy expenditure inside
dwellings, fuel for motor vehicles and spending on other forms of transport) is significant from 2030. The drop is greater for the moderate-acceptability scenario than for its high-acceptability
counterpart and for the upper energy-price assumption. In all cases household investment in emission-abatement is more than compensated by energy savings. However it is not possible on the basis of these aggregated results to assess the impact of the various policies on household budgets in different income categories. The issue of fuel poverty is consequently disregarded. On the other hand, the fall in energy consumption drastically reduces French energy imports, a drop which may reach €50 billion by 2030 and almost €100 billion in 2050.
Figure 11: Economic assessment of HA and MA scenarios
The economic gains are due to the combined positive effects of the climate policies considered in the high and moderate-acceptability scenarios which reduce the weight of energy in production costs and household budgets compared to the baseline.
- Early carbon pricing and the pre-established progressive nature of the tax partly correct the sub-optimal investment decisions in the baseline scenario in a context of steadily increasing
fossil fuel prices. This partly compensates for imperfect anticipation of increases in energy prices in the baseline scenario. It forces short-sighted decision-makers gradually to internalize constraints on fossil fuel prices and speed up learning-by-doing in carbon-mitigation techniques.
- Support schemes for low-carbon technologies supplement the effects of carbon pricing and foster early investments and endogenous improvements in low-carbon technologies. - Spatial planning-related policies and changes in investment decisions for long-life
infrastructure reduce the need for mobility and feed a shift to less fossil-fuel intensive transport modes at a time of rising energy prices. In the baseline scenario investments in infrastructure favour road transport and inertia locks the transport system into fossil-fuel-intensive transport modes.
- In the shorter term, soft measures on transportation also reduce the need for mobility.
Correcting the sub-optimalities in the baseline scenario thus opens the way for benefits from climate policies. Imperfect foresight leads to investment decisions ill-suited to future economic conditions (particularly rising energy prices) and inertia constrains adaptability to new economic conditions. In the high and moderate-acceptability scenarios, the overall impact of climate policies is to reduce the weight of energy in production costs and household budgets. This in turn boosts household
purchasing power, final demand for non-energy goods, and consequently production. This leads to higher employment (in an imperfect labour market) and an additional increase in household purchasing power through higher wages.
Such positive effects should be seen in perspective. Poorly designed climate policies could also exacerbate the distortions and sub-optimalities depicted in the model. This could be due to lack of flexibility in the labour market. This is particularly true for the need for new skills, on a very large scale and as quickly as possible, and for occupational retraining programmes for jobs in activities such as road freight transport. Credible answers for switching jobs are needed in order to avoid further labour-market inflexibility and energy-transition costs (Guivarch et al., 2011).
To avoid such problems, predetermining the progressive nature of the carbon tax will be decisive in stabilizing the expectations of economic agents when making decisions on low-carbon investment. One core issue is the balance between higher carbon prices and low-carbon investments costs, on the one hand, and energy efficiency and technical change, on the other. If energy-efficiency gains and technical change are slower than depicted in the scenarios (due to inertia, labour-market inflexibility, or inadequate support schemes), energy savings may not compensate for the impact of carbon pricing and the additional costs entailed by low-carbon technologies. Household energy
budgets and the weight of energy in production costs could therefore increase compared to the baseline scenario and lead to economic losses until energy-efficiency gains catch up.
4. Discussion
The results of the modelling process show that achieving the Factor-Four target will require more than just the high-acceptability policies. The following section assesses how this process could evolve into a broader set of acceptable policies, making it more likely to achieve the Factor-Four target. For this purpose we shall concentrate on the design and nature of such policies and the way new policies could be integrated in the process.
Predictably, stakeholders’ discussions confirm that incentives are thought to be more acceptable than coercive measures. This result is supported by several empirical studies (Eriksson et al., 2006, 2008; Joireman et al., 2001; Schuitema et al., 2011; de Groot and Schuitema, 2012). This is
particularly true for the building sector with the perceived acceptability of incentives versus compulsory retrofitting.
More ambitious, less acceptable policies must be implemented. The trickiest issues seem to concern compulsory retrofitting, the acceptable level of development of renewable energy, and the level of investment in rail infrastructures and collective transport.
However procedural factors and the design of policy such as participatory approaches, institutional arrangements, compensation for addressing fuel-poverty issues or the creation of specific funding tools may enhance the acceptability of low or moderately acceptable policies. Consistency between policies and the stability of policy targets are also important factors. Pricing policies gain acceptability if revenue is used to finance climate policy or projects related to climate mitigation. Acceptability should not be considered as a static, embedded characteristic of specific climate policies. For
example the design of the carbon tax is an essential factor determining its acceptability: stakeholders insisted on the importance of predetermining the progressive nature of the carbon tax over time so that economic agents could make allowance for it in their decisions and investment choices. In the building sector, financial support and provision for reducing financial risk are needed to enhance the acceptability of a national retrofitting programme. In the transport sector, the quality of public transport needs to improve significantly for it to become attractive. In the power sector even-handed procedures would be required throughout the planning and installation process, in order to deploy significant renewable electricity generation and transmission capacity. This should include legal provision for local communities to take part in such schemes, in particular financially.
Nevertheless, the consensus-building process can define a significant set of policies that could be implemented more easily or shape a common vision of what needs to be done in specific sectors. These policies could be deployed first and their efficiency could also leverage other less acceptable policies. For example, early deployment of energy-efficiency measures should yield energy savings and reduce the future impact of a carbon tax or incremental block tariff for electricity, thus
financial risk or early introduction of compulsory retrofitting of social housing could exert leverage on the future acceptability of cross-the-board compulsory retrofitting.
Figure 12: Iterative process for broadening the scope of all acceptable policies
An iterative loop could be added to the process (Figure 12) to adjust all the policies integrated in the high-acceptability scenario, on the basis of the results obtained from economic assessment of the policies integrated in the high and moderate-acceptability scenarios, and the gap between the resulting reductions and the Factor-Four target. Co-development yielding a set of acceptable policies with a certain degree of consensus thus constitutes a baseline starting from which new policies, initially thought to be less acceptable, could be reconsidered and found acceptable, then integrated in the high-acceptability scenario as part of a dynamic approach. This form of iterative loop would become part of reflexive governance (Brousseau and Dedeurwaerdere, 2012). This approach was not adopted for the present process due to time constraints.
5. Conclusions and policy implications
This section summarizes the main results, presents the implications for policy and concludes with a review of the pros and cons of the participatory process.
The point of departure for the research presented here was to question the goal of developing low-carbon scenarios. Over and above the content of the technico-economic trajectory described by these scenarios, interest may focus on the scenario-scripting process. Here we investigate this approach with a view to overcoming the opposition prompted by existing scenarios and building a consensus or a minimum level of agreement as a basis for developing a process-oriented scenario. A co-development process involving about 40 stakeholders focusing on the acceptability of low-carbon policies and technologies led to the selection of policies and technologies with high or
moderate acceptability. The high-acceptability scenario comprises (i) in the residential sector, a set of financial and non-financial incentives designed to lower the cost and share the risk for the decision-maker of thermal renovation work and incremental block tariffs for electricity; (ii) in the transport
Eco. and env. quantitative assessment Stakeholder dialogue Consensus on the acceptability of a set of policies Policies with a moderate level of acceptability
i=0
Dialogue with stakeholders on the acceptability of scenarios and of policiesSc HA
iSc MA
ii=i+1
sector, the penetration of energy-efficient and hybrid vehicles supported by an incentive-disincentive scheme, cross-the-board enforcement of fuel tax, a tariff scheme integrating the negative
externalities of transport, ‘soft’ measures to limit forced spatial mobility and a substantial transfer of investment from roads to rail and urban transit; (iii) in the electricity sector, measures to enhance the energy efficiency of equipment, to ‘smooth out’ the load profile, a diversification of the energy mix through the development of renewables and a reduction in nuclear power’s share; (iv) a carbon tax with anticipation of the tax level and recycling of revenue in the form of green cheques for households. The moderate-acceptability scenario includes all the high-acceptability measures with, in addition, further investment in alternatives to road transport, compulsory retrofitting of the entire housing stock, starting with social housing and gradually extended to achieve a steady number of renovation projects over time, and greater development of onshore wind farms.
By 2050 the high-acceptability scenario would yield emission reductions ranging from 58% to 72%, compared to 1990, depending on energy-price assumptions. Lowering the acceptability threshold to 50% opens the way for reductions of between 68% and 81%. In every case the economic impacts of reduction scenarios are positive for GDP, jobs and household spending, more markedly so with more ambitious levels of emission-reductions. All these measures benefit jobs and economic growth, swiftly and durably cutting household spending on energy services. This offers a solid basis for gaining acceptability for low-carbon trajectories.
The results of the modelling process show that more than just the high-acceptability policies will be required to achieve the Factor-Four target. Predictably, incentives are thought to be more acceptable than coercive measures. However procedural factors and the design of policy such as participatory approaches, institutional arrangements, compensation for addressing fuel-poverty issues or the creation of specific funding tools may enhance the acceptability of low or moderately acceptable policies. The trickiest issues are compulsory retrofitting, the level of investment in rail infrastructure and collective transport, and the level of renewable energy development.
Nevertheless, the consensus-building process defines a significant set of policies that could be implemented more easily. These policies could be implemented first and their efficiency could leverage other less acceptable policies
In terms of methodology an approach involving participatory scripting entails two main shortcomings. The first is the difficulty defining the notion of acceptability and the associated ambiguity due to conflicting corporatist, altruistic or individual points of view. The second relates to the small size of the panel. Results obtained with a panel with 15 stakeholders cannot be
representative of a whole population or even of the economic sector with several thousand companies. No methodology based on a participatory and deliberative process can do this.
But the present approach does include several very instructive aspects relevant to appraising climate policies, the role of scenarios and forms of governance. First of all the purpose of the
co-development process is to rise above the individual preferences of each of the players taking part by placing them in a situation requiring interaction and decision-making. Over and above the
dissemination of information, co-development encourages joint production of solutions and collective learning. Methodologies based on focus groups are particularly relevant here. This approach goes further than a simple list of individual positions (or even powerful opposition), enlarging the number of acceptable policies through discussion on the design options for deploying
measures. So, rather than adding yet another scenario to public debate, participatory scripting can confer broader legitimacy than other scenarios scripted by expert groups.
Such a framework could be experimented at government level to build future national low-carbon scenarios through an iterative process (Figure 12). It could also be tested with citizen focus groups but this would require additional time, given the need for training in climate change, energy and specific sectoral issues.
Acknowledgements
Some of this work was done as part of the FP7 ENCI LowCarb (213106) project. My thanks to Thomas Bolognesi for his comments and to the panellists for their input.
References
Arditi, M., et al., 2012. Quelle trajectoire pour atteindre le mix énergétique en 2025 ? Quels types de scénarios possibles à horizons 2030 et 2050, dans le respect des engagements climatiques de la France ? Rapport du groupe de travail n°2 du conseil national sur la transition énergétique. 72p. Bibas, R., Mathy, S., 2011. Dynamiques d'investissement et de maîtrise de la courbe de charge dans le système électrique français, presented at La journée de la chaire modélisation prospective 2011 Prospective pour les enjeux Energie-Climat, October 11th, Jardin Tropical, CIRED, Paris, France. Bökenkamp, G., Hohmeyer, O., Diakoulakib, D., Tourkoliasb, C., Porchia, R., Zhu, X., Jakobsen, K.T., Halsnaes, K., 2008. WP 9 Report on policy assessment of instruments to internalise environment related external costs in EU member states, via promotion of renewables, CASES – Costs Assessment For Sustainable Energy Markets Project No 518294 Ses6, Deliverable No. D.9.1.
Bonneval, L., Lacroix-Lanoë, C., 2011. L’opinion publique européenne et le nucléaire après Fukushima, note n° 101 - Fondation Jean-Jaurès - September 26th, 17pp.
Brousseau, E., Dedeurwaerdere, T., 2012. Global Public Goods: the Participatory Governance Challenges, in : Brousseau, E., Dedeurwaerdere, T., Siebenhüner, B. (Eds), Reflexive Governance and
Global Public Goods. Cambridge (MA), MIT Press, pp. 21-36.
Callonnec, G., Nauleau, M.L., 2012. Le modèle Energie et Fiscalité MENFIS , Journée PREBAT june 22nd, 2012 « Atteindrons-nous le facteur 4 en 2050 ? ».
Crassous, R., Hourcade, J.-C., Sassi, O., 2006. Endogenous structural change and climate targets : modeling experiments with Imaclim-R. Energy Journal. Special Issue on the Innovation Modeling Comparison Project.
Devine-Wright, P., 2008. Reconsidering public acceptance of renewable energy technologies: a critical review” in: Jamasb, T., Grubb M., Pollitt M. (Eds.), Delivering a Low Carbon Electricity System: Technologies, Economics and Policy, Department of Applied Economics Occasional Papers (No. 68) July 2008, Cambridge University Press.
Dorfman, P., Prikken, I,. Burrall, S., 2012. Future national energy mix scenarios: public engagement processes in the EU and elsewhere. Final Report, European Economic and Social Committee, EESC/COMM/05/2012, pp. 1-65
Edenhofer, O., Knopf, B., Leimbach, M., Bauer, N., 2010. (Eds) “The Economics of Low Stabilization”, The Energy Journal. Volume 31 (Special Issue 1).
Eriksson, L., Garvill, J., Nordlund, A.M., 2006. Acceptability of travel demand management measures: the importance of problem awareness, personal norm, freedom, and fairness. Journal of
Environmental Psychology 26, 15–26.
Eriksson, L., Garvill, J., Nordlund, A.M., 2008. Acceptability of single and combined transport policy measures: the importance of environmental and policy specific beliefs. Transportation Research Part A: Policy and Practice 42, 1117–1128.
European Commission, 2011. Impact Assessment Accompanying Document to “A Roadmap for Moving to a Competitive Low Carbon Economy in 2050.”. Communication of the European
Commission to the European Parliament, the Council, the European Economic and Social Committee and the Committee of the Regions.
Fischer, C., Newell, R., 2004. Environmental and technology policies for climate change and renewable energy. Resources for the Future.
Garb, Y., Pulver, S., VanDeveer, S.D., 2008. Scenarios in society, society in scenarios: toward a social scientific analysis of storyline-driven environmental modeling. Environ. Res. Lett. 3 045015 (8pp) Giraudet, L.-G., Guivarch, C., Quirion P., 2012. Exploring the potential for energy conservation in French households through hybrid modelling. Energy Economics. 34(2):426-445
Goodwin, P., Dargay, J., Hanly, M., 2004. Elasticities of Road Traffic and Fuel Consumption with 25 Respect to Price and Income: A Review. Transport Reviews. 24 (3), 275-292.
de Groot, J., Schuitema, G., 2012. How to make the unpopular popular? Policy characteristics, social norms and the acceptability of environmental policies, Environmental Science & Policy, 19–20: 100-107
de Groot, J., Steg, L., 2006. Impact of transport pricing on quality of life, acceptability, and intentions to reduce car use: An exploratory study in five European countries. Journal of Transport Geography. 14(6), 463-470.
Guivarch, C., Crassous, R., Sassi, O., Hallegatte, S., 2011. The costs of climate policies in a second-best world with labour market imperfections, Climate Policy, 11:1, 768-788.
Ha-Duong, M., Nadaï, A., Campos, A.S., 2009. A survey on the public perception of CCS in France.
International Journal of Greenhouse Gas Control. 3 (5):633-640, September. Hourcade, J. C., 2012. La taxe carbone, post-mortem. Projet. 5, pp.23-31.
Hulme, M., Dessai, S., 2008. Predicting, deciding, learning: can one evaluate the ‘success’ of national climate scenarios? Environ. Res. Lett. 3 045013
Hulse, D., Branscomb, W.A., Payne, S.G., 2004. Envisioning Alternatives: Using Citizen Guidance to Map Future Land and Water Use. Ecological Applications. 14, no. 2: 325–341.
IFOP, 2013. Les français et les gaz de schiste, opinion poll realized for Ecorpstim.
Joireman, J.A., Lasane, T.P., Bennett, J., Richards, D., Solaimani, S., 2001. Integrating social value orientation and the consideration of future consequences within the extended norm activation model of proenvironmental behaviour. British Journal of Social Psychology 40, 133–155.
Lecuyer, O., Quirion, P., 2013. Can Uncertainty Justify Overlapping Policy Instruments to Mitigate Emissions ? Ecological Economics. 93 : 177-191
Lopez-Ruiz, H.G., Crozet, Y., 2010. Sustainable transport in France: is a 75% reduction in CO2 emissions attainable? Transportation Research Record: Journal of the Transportation Research Board. 2163, 124-132.
Maresca, B., Dujin, A., Picard, R., 2009. La consommation d’énergie dans l’habitat entre recherche de confort et impératif écologique. Cahier De Recherche N°264, CREDOC.
Mathy, S., Fink, M., Bibas, R. 2011. Quel rôle pour les scénarios Facteur 4 dans la construction de la décision publique ? Développement Durable et territoires. 2 (1), 1-22.
Mendelow, A., 1991. Stakeholder mapping. Proceedings of second international conference on
information systems. Cambridge, MA.
Nadaï, A., Labussière, O., 2009. Windpower planning in France (Aveyron) ; from state regulation to local planning. Land Use Policy. 26(3): 744-754.
O’Neill, B.C, Pulver, S., VanDeveer, S., Garb, Y., 2008. Where next with global environmental scenarios? An introduction and overview. Environ. Res. Lett. 3 045012.
O'Neill, B.C., Nakicenovic, N., 2008. Learning from global emissions scenarios. Environ. Res. Lett. 3 045014.
Pahl-Wostl, C., 2002. Participative and Stakeholder-based Policy Design, Evaluation and Modeling Processes. Integrated Assessment. 3( 1): 3–14.
Patel, M., Kok, K., Rothman, D.S., 2007. Participatory Scenario Construction in Land Use Analysis: An Insight into the Experiences Created by Stakeholder Involvement in the Northern Mediterranean. Land Use Policy 24(3): 546–561.
de Perthuis, C., Buba, J., Million, A., Scapecchi, P., Teissier, O., 2011. Trajectoires 2020 - 2050 Vers
Une Économie Sobre En Carbone : Rapport Du Comité Présidé Par Christian de Perthuis. Ministère de
l’écologie, du développement durable, des transports et du logement.
Quinet, A., 2009. La valeur tutélaire du carbone, Rapport de la commission présidée par Alain Quinet. La documentation française, Rapport n°16, 424 pp.
Quinet, E., 2013. L’évaluation socio-économique en période de transition, Rapport du groupe de travail présidé par Émile Quinet, Commissariat général à la stratégie et à la prospective Tome I, Rapport final, Juin.
Renn, O., 1999. A Model for an Analytic-Deliberative Process in Risk Management. Environ. Sci. Technol. 33 (18): 3049-3055.
Rocard, M., 2009. Rapport de la conférence des experts et de la table ronde sur la contribution Climat et Énergie, 28 juillet 2009, 84pp.
Sassi, O., Crassous, R., Hourcade, J.-C., Gitz, V., Waisman, H., Guivarch, C., 2010. Imaclim-R : a
modelling framework to simulate sustainable development pathways. International Journal of Global Environmental Issues. Special Issue on Models for Sustainable Development for Resolving Global Environmental Issues. 10(1/2): 5–24.
Schmid, E., Knopf, B., 2012. Ambitious mitigation scenarios for Germany: A participatory approach, Energy Policy, 51(C), pp 662-672.
Schuitema, G., Steg, L., van Kruining, M., 2011. When are transport pricing policies fair and acceptable. Social Justice Research 24, 66–84.
Söderholm, P., Hildingsson, R., Johansson, B., Khan, J., Wilhelmsson, F., 2011. Governing the transition to low-carbon futures: a critical survey of energy scenarios for 2050. Futures. 43, 1105– 1116.
Steg, L., Dreijerink, L., Abrahamse, W., 2005. Factors influencing the acceptability of energy policies: A test of VBN theory. Journal of Environmental Psychology. 25(4), 415-425.
Thiel, C., Alemanno, A., Scarcella, G., Zubaryeva, A., Pasaoglu, G. 2012. Attitude of European car drivers towards electric vehicles: a survey. JRC report.
Van Asselt, M., Rijkens-Klomp, N., 2002. A Look in the Mirror: Reflection on Participation in
Integrated Assessment from a Methodological Perspective. Global Environmental Change. 12, no. 3: 167–184.
Waisman, H., Guivarch, C., Grazi, F. Hourcade, J.C., 2012a. The Imaclim-R model : infrastructures, technical inertia and the costs of low carbon futures under imperfect foresight, Climatic Change, 114(1).
Waisman, H, Guivarch, C., Lecocq, F, 2012b. The transportation sector and low-carbon growth pathways. Climate Policy. 13(1):107-130.
Wilkinson, A., Eidinow, E., 2008. Comparing scenarios for global environmental assessment with scenarios in organizational settings. Environ. Res. Lett. 3 045017
Wilcox, D., 2003. The Guide to Effective Participation. Partnership Books, Brighton.
Wolsink, M. , 2012. The research agenda on social acceptance of distributed generation in smart grids: Renewable as common pool resource. Renewable and Sustainable Energy Reviews. 16(1): 822-835.
Zahavi, Y., Talvitie, A., 1980. Regularities in Travel Time and Money Expenditures. Transportation Research Record. 750, pp. 13-19.
Appendices
Appendix A. List of scenarios in the French Energy Debate in 2013 Table A.1: List of scenarios in the French Energy Debate in 2013
Author Complete name Description
negaWatt Energy experts promoting nuclear phase out, energy efficiency
and renewables Global
Chance
Energy experts promoting nuclear phase out, energy efficiency and renewables
Greenpeace Environmental NGO
WWF World Wild Fund for Nature Environmental NGO
UFE Union Française de
l’électricité
Professional association of the electricity sector
negaTep Association of retired people from the CEA (Atomic Energy
Commission)
RTE Réseau de Transport de
l’Electricité
Public French Transmission System Operator
GRDF Gaz Réseau Distribution
France
Gas distribution company, 100% subsidiary of GDF SUEZ
ANCRE Alliance Nationale de
Coordination de la Recherche en Energie
French National Alliance for Energy Research Coordination, created by CEA (Atomic Energy Commission), CNRS (national Research Center) and IFP Energies Nouvelles (French Institute for Petroleum and new energies);
Ademe Agence de l’Environnement
et la Maîtrise de l’Energie
the French environmental and energy management agency
DGEC Direction Générale de
l’Energie et du Climat
French energy and climate department of the environment ministry
CIRED Centre International de
Recherche en Environnement et Développement
Public research institute on environmental and energy economics