Applications of Stochastic Inventory Control in
Market-Making and Robust Supply Chains
by
Miao Song
B.B.A., Xi'an Jiaotong Univerisity (2001)
S.M., National Univeristy of Singapore (2002)
[MASSACHUETTS INSTITUTE OF TECHN OLOCY
SEP
2
9 2010
RA IFS
Submitted to the Department of Civil and Environmental Engineering
in partial fulfillment of the requirements for the degree of
Doctor of Philosophy
at the
MASSACHUSETTS INSTITUTE OF TECHNOLOGY
September 2010
@
Massachusetts Institute of Technology 2010. All rights reserved.
A u th o r ...
Department of Civil and Environmental f1gineering
August 10, 2010
Certified by.
Accepted by
... . ... . .. . ...
David Simchi-Levi
Professor of Civil and Environmental Engineering
Thesis Supervisor
...
...
D
Daniele Veneziano
Chairman, Departmental Committee for Graduate Students
Applications of Stochastic Inventory Control in
Market-Making and Robust Supply Chains
by
Miao Song
Submitted to the Department of Civil and Environmental Engineering on August 10, 2010, in partial fulfillment of the
requirements for the degree of Doctor of Philosophy
Abstract
This dissertation extends the classical inventory control model to address stochastic inventory control problems raised in market-making and robust supply chains.
In the financial market, market-makers assume the role of a counterpart so tbat investors can trade any fixed amounts of assets at quoted bid or ask prices at any time. Market-makers )ellefit from the spread between the bid and ask prices. but they have to carry inventories of assets which expose them to potential losses when the market price moves in an undesirable direction. One approach to reduce the risk associated with price uncertainty is to actively trade with other mlarket-imakers at the
price of losing potential spread gain.
WVe propose a dynamic programming model to determine the optimal active trad-ing quantity., which mnaximnizes the imarket-imiaker's expected utility. For a strad-ingle-asset model. we show that a threshold inventory control policy is optimal with respect to both an exponential utility criterion and a mean-variance tradeoff objective. Spe-cial properties such as synmetry and monotonicity of the threshold levels are also investigated. For a miultiple-asset model. the imean-variance analysis suggests that there exists a connected no-trade region such that the imarket-illaker does not need to actively trade with other market-makers if the inventory falls in the no-trade re-gion. Outside the no-trade rere-gion. the optinal way to adjust inventory levels can be obtained from the boundaries of the no-trade region. These properties of the optimal policy lead to practically efficient algorithms to solve the problem.
The dissertation also considers the stochastic inventory control model in robust supply chain systems. Traditional approaches in inventory control first estimate the demand distribution among a predefined family of distributions based on data fitting of historical demand observations, and then optimize the inventory control policy using the estimated (listributions. which often leads to fragile solutions in case the preselected fainily of distributions was inadequate. In this work. we propose a inill-imax robust model that inltegrates data fitting and inventory optimization for the single iteim multi-period periodic review stochastic lot-sizing problem. Unlike the classical stochastic inventory models, where demand distribution is known, we
as-sume that histograms are part of the input. The robust model generalizes Bayesian model, and it can be interpreted as ininunizing history dependent risk measures. We prove that the optimal inventory control policies of the robust model share the same structure as the traditional stochastic dynamic programming counterpart. In partic-ular., we analyze the robust rnodels based on the chi-square goodness-of-fit test. If demand samples are obtained from a known distribution, the robust model converges
to the stochastic model with true distribution under general conditions.
Thesis Supervisor: David Simchi-Levi
Acknowledgments
First and foremost I owe my deepest gratitude to my Ph.D. advisor, Professor David
Simchi-Levi., who has supported me with his inspiration. knowledge and patience froni the very early stage of this research and given me extraordinary experiences throughout the work. Without his guidance and persistent help this dissertation
would not have been possible.
I gratefully acknowledge Professor David Gamarnik and Professor Georgia Perakis for serving as my thesis committee members.
I am indebted to all my collaborators., especially Professor Diego Klabjan and Professor Chung-Piaw Teo, for their valuable advices and contributions to the papers completed during my Ph.D. study.
Last but not least. I wish to thank all yiv family and friends., especially my parents.
Contents
1 Introduction 13
1.1 Market-Making... . . . . . . . . 15
1.2 Robust Stochastic Lot-Sizing. . . . . . . . . 20
2 Single-Asset Market-Making with Exponential Utility 23 2.1 Formulation... . . . . . . . 24
2.2 Optimality of the Threshold Policy... . . . . . . .. 27
2.3 Reduction of the State Space... . . . . . . . .. 44
2.4 Symmetric Threshold PolicY.. . . . .. 49
2.5 Extensions. . . . . . . . . 53
3 Single-Asset Market-Making with Mean-Variance Tradeoff 55 3.1 Mean-Variance Analysis.... . . . . . . . . 55
3.2 Optiniality of the Threshold Policy.. . . . . . 58
3.3 Reduction of the State Space.... . . . . . . . 64
3.4 Risk Neutral Model... . . . . . . . . .. 66
3.5 Symmetric Threshold Polic... . . . . . . . . 71
3.6 Monotone Properties of the Threshold Levels... . . . . . . .. 76
3.6.1 Monotonicity with Respect to the Risk Aversion Parameter . . 76
3.6.2 Monotonicity with Respect to the Spread . . . . 82
3.6.3 Monotoicity with Respect to the Mid Price . . . . 3.7 Extentions.. . . . . . . . 92
4 Multiple-Asset Market-Making with Mean-Variance Tradeoff 95
4.1 Literature Review. .. ... . 95
4.2 Form ulation . . . . 7
4.3 Single-PeriodI Multiple-Asset Model.. . . . . . . . 100
4.4 Multiple-Period Multiple-Asset Model . . . 104
4.4.1 Symmetric Optimal Control Policy . . . 113
4.4.2 Num erical Results . . . . 114
4.5 Extensions... . . . . . . . 118
5 Robust Stochastic Lot-Sizing by Means of Histogranis 121 5.1 Literature Review... . . . . . . . . . . . 121
5.2 Formulation of Robust Stochastic Lot-Sizing... . . . . . .. 124
5.3 Properties of Optimal Policies.. . . . . . . . 128
5.4 Robust Models Based on Chi-Square Test... . . . . .. 133
5.4.1 Computation of (s, S) Levels... . . . . .. 137
5.4.2 Convergence of Robust Models Based on Chi-Sqtuare Test . 139 5.5 Computational Results. . ... . . .. 154
5.6 Extensions.. . . . . . . . 164
List of Figures
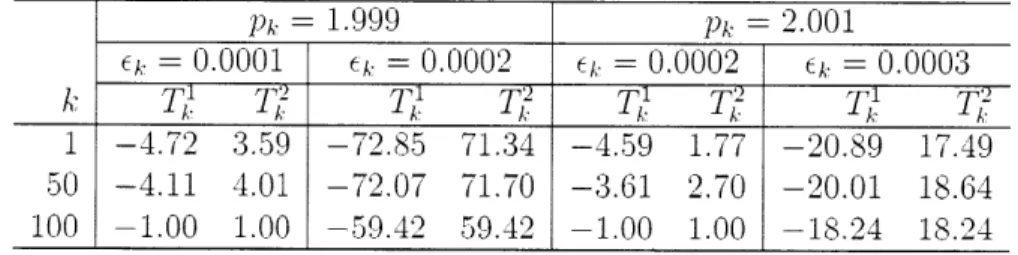
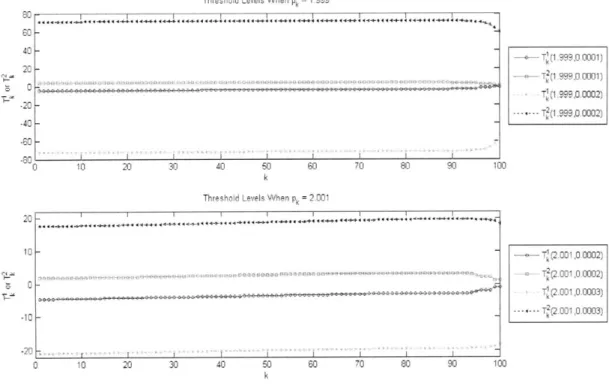
2-1 T7 (PA. e.) and T (pA, q) for Example 2.1 with p = 100 and TN+1
-~-C
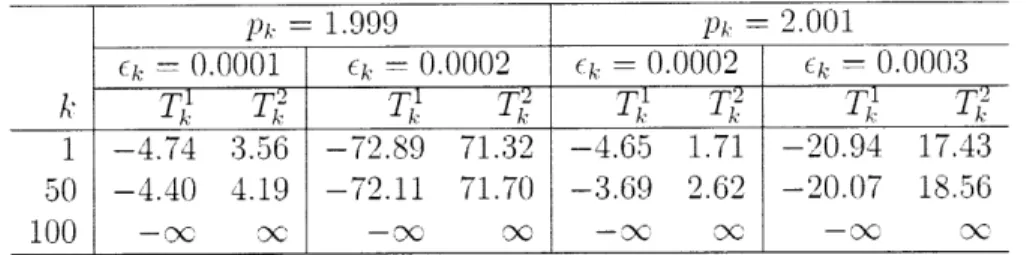
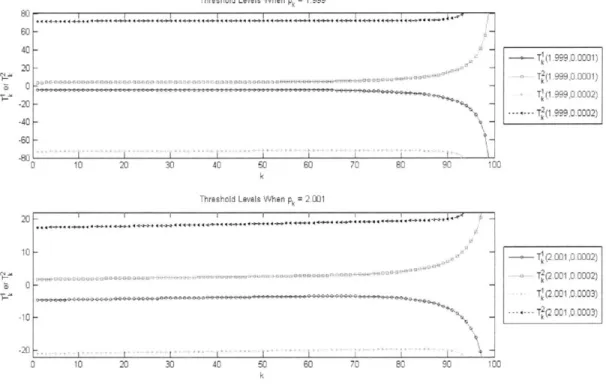
IxN 1il .* 412-2 T7(p.. ek) and T (pk, 6k) for Example 2.1 with p = 100 and -N1 44
2-3 T (e. ) and T 1 () for Example 2.2 with p = 100 . . . . 46
2-4 T (pk) and T (pe) for Example 2.3 with = 10- and p 100 . . .4
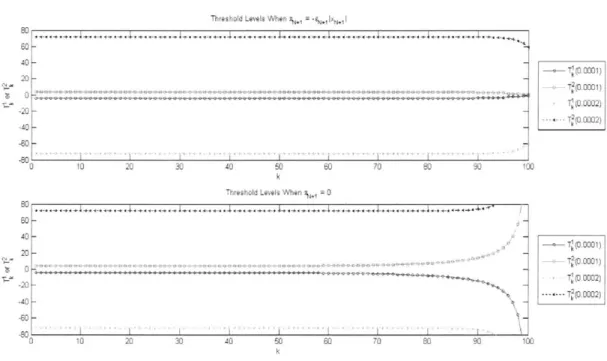
2-5 T (pk) and T (pk) for Example 2.3 with ;k = 2 x 10⁻⁴ and p = 100 . 48 2-6 T1 for Exam ple 2.4 . . . . 53
3-1 T (p... e) and TT(p,. 61) for Example 3.1 with A = 100 and N+ = 3-2 TA (pk, c.) and 'T7 (p., ,) for Example 3.1 with A - 100 and 7N+1 = 0 63 3-3 T(6) and T/(-k) for Example 3.2 with A = 100 . . . . 65
3-4 T (Pk) and T (pk) for Example 3.3 with Yk - 1 )-4 and A - 100 . . . 67
3-5 T,(pj) and T9(p..) for Example 3.3 with (1.= 2 x 10/ and A= 100 67 3-6 T, (pk, 6 ) and T (pk (k) for Example 3.5 . . . . 71
3-7 T for Exam ple 3.6 . . . . 75
4-1 Illustration of Optimal Solution for Single-Period Model . . . . 103
4-2 Illustration of Optimal Solution for Multiple-Period Model . . . . 107
4-3 Illustration of Optimal Solution for Multiple-Period -Model . . . . 115
4-4 Illustration of Optimal Solution for Multiple-Period Model . . . . 117
5-2 Demand Distributions Returned by the Robust Model with Bin Size = 3 and k2 = 3 . . . 157 5-3 Basestock Levels Computed Using Different Models.. . . . .. 159 5-1 The Stochastic M odel Using Best Fitted Distribution vs. the Robust
List of Tables
2.1 T7(pi..
c)
and T (pA., e,) for Example 2.1 with p = 100 and N-N+iv1N- - - - - 40
2.2 T (pA. .) and T (pk, e ) for Example 2.1 with p = 100 and 7N+1 0 43 2.3 T (k) and T7e) for Example 2.2 with p = 100 . . . . 45
2.4 T (pk) and T (ph) for Example 2.3 with "I - 1)-4 and p = 100 . . . 47
2.5 T (pA) and T (pk) for Example 2.3 with = 2x 10⁻⁴ and p 100 47 2.6 T for Exam ple 2.4 . . . . 53
3.1 T (pm. P ) and T(p, 6) for Example 3.1 with A = 100 and 7N+1
3.2 T (p,.. q) and T(pk, e ) for Example 3.1 with A = 100 and N - 0 63
3.3 T (e ) and TT(e) for Example 3.2 with A = 100 . . . . 65
3.4 T (pj) and T,(p') for Example 3.3 with p', 10-4 and A = 100 . . . 66 3.5 T (pk) and T7(p) for Example 3.3 with '= 2 x10 and A = 100 66 3.6 T (pk. e ) and T (pm', ek) for Example 35 . . . . 70 3.7 T for Example 3.6 . . . . 7 5.1 Performance of Different Models for the Instance in Figure 5-1 . . . . 160 5.2 Performance of Different Models in 10 Instances... . ... 161
Chapter 1
Introduction
In supply chain management. inventory refers to raw materials. work-in-process goods and finished products wlich are held available ini stock and will be used to satisfy
production needs or customer demands in the future. Inventory enables businesses to cover the needs for stock occurred during the manufacturing or delivery lead times. It also provides a )uffer to protect against fluctuations in customer demands as well as uncertainties in the supply process. These two aspects imply that inventory ensures satisfying demand from customers or downstream production processes. In addition., it enables taking advantage of economies of scale in purchasing, production. trans-portation and storage by ordering or producing more than immediate demands and storing the rest as inventory. That is. inventory management strategies can also con-tribute to reducing total supply chain costs. Indeed, according to the U.S. Census Bureau
[52].
nanufacturers' and trade inventories were estimated at81.35
trillion in April 2010. and this figure is 1.23 times the sales in that month.Unfortunately, it is usually costly to hold inventory. This cost includes the op-portunity cost associated with the capital invested in inventory, the cost of capital to finance inventorv. warehousing cost, handling cost. costs associated with obsolescence and shrinkage, and insurance and taxation. Atkinson
51
pointed out that the annual inventory holding cost is approximately 15~35% of the goods' actual value.Therefore, the key in inventory managelment is to achieve a tradeoff between the
amount of inventory at the right place and at the right time so as to balance
system-wide cost and the service level. The vast amount of money invested in inventory
-inventory holding cost is a significant percentage of the inventorv value - is critical to the success of any business. Indeed, the success stories of giants such as Wal-Mart. Dell or Amazon demonstrate the importance of effective inventory managenment strategies.
The literature on inventory theory can be dated back to the beginning of last century. It is widely believed that the first inventory model is the economic order quantity (EOQ) model attributed to Harris [22]. The EOQ model assumes a constant and deterministic demand, an d identifies a closed form solution which corresponds to the optimal tradeoff between an inventory holding cost and a fixed ordering cost representing economies of scale in ordering.
Wagner and Whitin [54] introduced the dynamic economic lot-size (DEL) model which considers an inventory systei with deterministic time-varying demands over a discrete finite planning horizon. The cost structure is similar to that in the EOQ
model and a shortest-path alguorithn is developed to solve the problem.
The seminal papers of Arrow et al. [3] and Dvoretzky et al. [16] explicitly model stochastic demands using discrete-time dynamic programming formulations. Most stochastic single-commodity single-location inventory models including those pro-posed in this dissertation c-an be regarded as extensions of this fundamental iodel. In particular, Scarf [4'7] studies a stochastic counterpart of the DEL model in Wagner and Whitin [54]. He shows that an (s. S) policy is optimal by introducing and apply-ing the notion of K-convexity. In such a policy. whenever the inventory level drops below s, an order is placed to raise the inventory level to S. Otherwise, no action is required.
Other influential research, especially those studying multiple-location inventory models., include but not limited to Roundy [39] which develops a 98% optimal strategy for the single warehouse multiple-retailer inventory system under assumptions similar to the EOQ model, and Clark and Scarf [15] which establish the optimal policy for a serial system with stochastic demands. Detailed surveys in inventory theory are
provided in Porteus
[42],
Sinichi-Levi et al. [49] and Zipkin [55].In this dissertation, we extend the line of research in stochastic inventory control started by Arrow et al. [3] and Dvoretzky et al. [16] to investigate inventory problems associated with market-making in finance and robust systems in supply chains. Sim-ilar to the early works, we adopt the discrete-tune dynanic programming framework to formulate these problems. Our objective is to identify the structures of optimal control policy in each case, and investigate properties of these policies so that efficient algoritlins can be developed.
The thesis is organized as follows. Inventory management problems in market-making are analyzed in Chapter 2. where we focus on a single asset with an expo-nential utility objective function, Chapter 3, where we consider a single asset with a variance objective function, and Chapter 4, where the focus is on the mean-variance analysis for multiple assets with correlated price mo vements. Chapter 5 considers the applications of inventory model in robust supply chains where the coi-plete information about demand distributions, i.e., the cumulative distribution func-tions of the demands, is unknown. We conclude the dissertation in Chapter 63 with a
discussion of possible directions for future research.
In the rest of this chapter., we introduce the background and motivation for this research as well as our contribution in each area: market-making and robust supply chains.
1.1
Market-Making
Investors trade foreign currencies, securities and other financial products frequently. Unfortunately. there is no guarantee that every investor who wishes to buy (or sell) a certain amount of asset will find a counterparty willing to sell (or buy) the same amount at that time. This is exactly the objective of the so-called "nmarket-makers": to facilitate the trading process for most financial products. That is, the market-maker is ready to assume the role of a counterparty when one wishes to buy or sell financial products. For example, each stock traded on the New York Stock Exchange
(NYSE) has a market-maker called "specialist", whose sole responsibility is to serve as a market-maker for this particular stock.
Typically. market-nakers quote a pair of bid/ask prices to clients and have the obligation to buy/sell at the quoted prices if their clients wish to deal at these prices. Over time., market-makers buy at bid price and sell at ask price, which is higher than the bid price at any given instant. Their objective is to profit from the "spread" between bid and ask prices. not from price movements. In that regard. they are different from ordinary investors, who seek to profit by betting on price moves.
Market-makers encounter difficulties when receiving consecutive trades in the same direction. For example., suppose a foreign currency market-maker holds no foreign currency initially and receives a series of sell orders afterwards (i.e., the clients sell to the narket-maker), the market-maker's holding position becomes very large and positive.' This is potentially very risky because if the foreign currency depreciates. the market-maker will lose a considerable amount. For a risk-averse market-maker. this is certainly undesirable. Thus. he cannot simply wait for the arrival of a client (who wishes to buy the foreign currency from him) and sell to this client to bring his holding position back to zero.
To reduce the risk and avoid such situations, the market-maker may consider selling certain amount of the foreign currency to other market-makers to lower his position instead of waiting for sell orders. This option is available when there are multiple market-makers providing liquidity for the same asset, which is true for the foreign currency markel and some stock markets. e.g.. National Association of Secu-rities Dealers Automated Quotations (NASDAQ). Of course, when the market-maker adjusts its position by selling to other market-makers, he becomes their client and has to sell at others' bid prices. As a result. he forgoes the possibility of selling to his own clients at the ask price and taking the spread. More importantly., when doing an adjustment, the market-maker will sell at the other market-makers' bid prices and
'Although at the beginning of this chapter we define inventoiry in supply chains as physical
commodities held in stock. inventory also refers to the assets held or short sold by a financial
institute or an individual in finance. In this particular example, the foreign currencies held or short sold by the market-maker can be regarded as inventory.
buy at the other narket-nakers' ask prices, thus is likely to encounter a loss. So here we have a typical trade-off between profit and risk. Our goal in this research is
to apply dynamic programming techniqjues in order to investigate when and by how much a market-maker should sacrifice profit to reduce risk.
The observation that market-makers may carry unwanted inventories has long
caught the attention of the research community, and most previous work investigates how inventories influence the market-makers' behavior when quoting bid and ask prices, in other words. it studies how to control inventory via pricing decisions. The
theoretical analysis in Ho and Stoll [241 shows that risk-averse market-makers will actively induce movements toward a desirable inventory level by setting favorable
bid/ask prices. Stoikov and Saglam [50] considers a market-maker in both an option
and its underlying stock, and analyze the role of the derivatives of option price on
the bid/ask quotes of both the option and the stock.
Empirical studies suggest that the impact of inventory levels on pricing is rather weak compared with the impact of other components such as asymmetric information (c.f. Stoll
[51],
Madhavan and Smidt [33]. Foster and Vishwanathan (18], and Mad-havan and Smidt [34]). In a later paper., Ho and Stoll [25] introduces a model that includes both the ability to change the bid/ask prices as well as opportunities to trade with other market-makers. The result suggests that trades among market-makers are necessary under certain conditions. Unfortunately, their solution is for models with only two periods.A survey of US foreign exchange traders (c.f. Cheung and Chinn [13]) indicates that the market norm is an important determinant of the bid-ask spread and only a small proportion of bid-ask spreads differ from the conventional spread. Specifically, only 2% of the respondents in that survey reported that inventory related factors have an impact on their bid-ask spreads. This is because quoting volatile bid/ask spread may damage the market-maker's reputation and drive away potential trading opportunities. Also., many of the traders reported that they are reluctant to reveal adverse positions by quoting non-conventional spread. Thus, this empirical study implies that at least in the foreign exchange market., inventory is not managed by
quoting bid/ask prices. Rather, it is controlled by trading with other market-makers. This is also supported by other evidence,. for example trading volume. Indeed. trading volume is extremely high in the foreign exchange market and is believed to be a result of market-makers passing unwanted inventory from one to another (c.f. Lyons [:32]). Finally, the survey of Cheuncg and Chinn [131 also states that more than half of respondents believe that large players dominate dollar-pound and dollar-Swiss franc markets. Therefore. many small and medium-sized players have no market power, i.e., they have no impact on future price movements when actively trading with other market-mlakers.
Our study is motivated by a practical problem faced by a major investment bank. Here we consider an electronic market-maker in the foreign exchange market which serves small retail orders. Since the market-maker only captures a very small fraction of the entire foreign exchalnge rnarket, it quotes the conventional spread and has no market power. In this case, the primary decision the mlarket-inaker needs to make is how much to trade with other narket-imakers in order to limit its market exposure.
Thus., our objective is to identify effective strategies for a imarket-iaker who does not control prices and can merely adjust inventory through active trading. In this sense., the market-making problem shares some important features with the classical inventory control problem. W e need to determine the amount of assets to buy or sell during market-iaking process. which is analogous to the ordering (uantity in inventory control. Indeed, in our case, the risk induced by inventory is analogous to the inventory holding cost. and the sacrificed spread profit due to active trading plays a similar role to the linear ordering cost. The sacrificed spread profit is the loss of spread encountered by a mlarket-maker who sells/buys a unit of inventory to other iarket-makers (at their own prices) rather than holding that unit of inventory and profiting from the spread in the future. Of course, there are somie important
differences: in the classical inventory control model. the order quantity niust be non-negative and the unit inventory holding cost is deterministic. which as we shall see.,
are essentially different frorn the mlarket-mnaking situation.
is defined by two parameters, an upper limit and a lower limit. Whenever the inven-tory is higher (lower) than the upper (lower) limit. the market-maker will decrease (increase) the inventory to the upper (lower) limit. Otherwise, i.e., when inventory level is between the two limits, the imarket-maker will not change its position. Ve call the region where the market-maker does not adjust its inventory, the "no-trade region." When the inventory of the iarket-iaker falls in the no-trade region. the market-maker will not actively trade with other market-makers, but will still accept trades from its customers. Our contributions are summarized as follows.
When the market-maker nianlages a single asset. we propose dynamic programming models for the narket-making inventory control problem, where an exponential utility function or a mean-variance utility are used - utilities that have been applied to model risk averse decision makers. Threshold policies are proved to be optimal for both models, and the special properties of the threshold levels are also analyzed. In particular, we identify conditions under which the threshold policy is symmetric, investigate the risk neutral model. and establish various monotonicity properties of
the optimal threshold levels for the mean-variance analysis.
When the market-maker manages multiple assets simultaneously, we focus on the dynamic programming formulation which optimizes the linear tradeoff of mean and variance. The optimal policy shows that there exists a simply connected no-trade region for each period and the optimal adjustment quantity is obtained directly from the no-trade reg-ion. In addition, we identify conditions under which the the no-trade region is symmetric with respect to 0.
Based on these structural properties of the optimal policy, we develop efficient algorithmiis to solve the corresponding dynamic program wiose computational coi-plexity is linear in the number of periods. Numerical results are also presented to illustrate properties of the optimal policies.
1.2
Robust Stochastic Lot-Sizing
The stochastic lot-sizing model has been extensively studied in the inventory litera-ture. Most of the research has focused on models with complete information about the distribution of customer demand. However, in most real-world situations., the demand distribution is not known; only historical data is available. A common ap-proach is to hypothesize a family of demand distributions and then to estimate the parameters specifying the distribution using the historical data. Once the probability distribution has been identified, the inventory problem is solved following this esti-mated distribution. This implies that the inventory policy is determined under the assumption of a perfect demand distribution.
We consider a different approach recognizing that the estimated demand distri-bution iay nut be accurate. We analyze the single-item stochastic finite-horizon periodic review lot-sizing model, under the assumption that demand is subject to an unknown distribut ion and only historical demand observations (given by histograms) are available. Rather than first estimating the demand distribution and then op-tinizing inventory decisions, as is the case in the classical approaches. we combine these two steps to minimize the worst case expected cost over a set of all possible distributions that satisfy a certain goodness-of-fit constraint. In this way, we combine distribution fitting and inventory optinization, and characterize a robust inzentory control policy based on the historical data.
The novelty of our approach is the starting point of histograms. All practitioners in inventory control start with histograms and then they fit an underlying demand distribution (e.g.. Crystal Ball from Decisioneering, Inc. allows selecting a distribution family among several listed families). Finally, based on the fitted distribution. the lot-sizing problem is solved.
The problem, of course, is that this distribution may not be the correct one. For this purpose., we develop a. model that integrates both distribution fitting and lot-sizing - we refer to this model as the robust lot-sizing model. This novel idea of using histograms as a source of input and concurrently considering replenishment
quantities and distributions leads to interesting insights. For example, as in the classical stochastic inventory setting., our results indicate that an (s. S) policy is optimal for the robust model as well. We also discuss the inipact of the sample size on model performance.
The main contributions of our work are as follows
1. W\e develop a robust minimax model that only requires historical data., and allows correlated dernand. Note that most miniax models (see. e.g., Notzon [38] and Ahmed et al. [1]) as well as Bayesian inventory models (e.g., updating the demand distributions in the way provided in Igleliart [27]) in tie literature could be interpreted as special cases of our framework.
2. The optimal policy of the robust model has the same structure as the
corre-sponding policy in the classical stochastic lot-sizing model. In particular,. the optimal policy is a state-dependent base-stock policy for the multi-period in-ventory problem without fixed procurement costs., and a state-dependent (S, S) policy if the fixed procurement cost is considered.
3. To illustrate the general framework. we consider the special case when the set of deniand distributions is directly related to the chi-square goodness-of-fit test.
This set can be defined by a set of second order cone constraints.
We also prove that the robust model converges to the stochastic model with true demand distribution if samples are drawn from this distribution and sample size grows to infinity. In particular. if the demand distributions are discrete, the robust nodel converges to the stochastic model with the true demand distribution as the number of independent samples drawn from the true distribution for each period tends to infinity. Moreover, the rate of convergence is in the order of 1/V/k. where k is the number of samples. Slightly weaker results are obtained for contimuous distributions.
The performance of the robust model is illustrated by means of computational experiments. We argue that the robust model outperforms the traditional approach, which optimizes the inventory decisions by using fitted distributions. We also provide
insights on the performance of the robust model with different parameters and sample sizes.
Chapter 2
Single-Asset Market-Making with
Exponential Utility
As we mentioned in Chapter 1., the multi-period stochastic imventory control problem
has been extensively stu(ie(l since 1950's. see Zipkin [55] for a detailed review of risk-neutral models. In the last two decades., a, number of papers have been devotedl to risk
aversion in inventory nanageient. Bouakiz and Sobel ['10] focuses on minimizing the
expected exponential utility of the linear ordering costs and inventory holding costs incurred during a finite or infinite planning horizon, and proves that a base stock policy is optimal. Chen et al. 11] considers risk-averse inventory (and pricing) models where the utility functions are time-separable. They show that the structure of the optimal policy is alnost identical to the structure of the optimal policy in the risk-neutral counterpart. see also Simchi-Levi et al. [49].
In this chapter, we study the inventory problem in market-making introduced in Section 1.1 under the assumption that the decision maker manages a single asset and has an exponential utility function. WNe introduce the stochastic inputs and decision variables for the market-making inventory control problem in Section 2.1. Section 2.2 presents the dynamic program which maximizing the exponential utility throughout the planning horizon, and proves that a threshold poicv is optimal for the general model. Furthermore, we discuss the special cases where the dimensions of the states determining the threshold levels can be reduced in Section 2.3. and identify sufficient
conditions for the threshold policy to be symmetric in Section 2.4. Finally., Section
-.5 concludes this chapter.
2.1
Formulation
In this chapter. we consider a time horizon of one day, which reflects the observation
that market-makers tend to "go home flat", i.e., market-makers prefer clearing then inventory at the end of the trading day in order to avoid significant market price movements overnight (c.f. Hasbrouck (23]). We divide the trading day into N discrete
small time intervals.
The sequence of events is as follows: At the beginning of period k, we observe the
current inventory level xk. tUnlike the classical inventory model, xk can be negative as the market-maker can take a short position. Next, the bid and ask prices quoted by the dominant player, pb and p are observed. After that, we adjust the inventory by the amount qA, which is the decision variable. Note that p. represents the amount the market-maker buys or sells (to other market-makers) at that period. We let
qk be positive if the market-maker buys q units of asset, and q. is negative if the market-maker sells jqkl. The markel-maker, as a price follower, the same bid1uote and ask prices ph and p( as the dominant player. Clients arrive and they sell s. and buy dk units of the asset to/from the market-maker. Obviously the inventory at the beginning of period k + is xk+1 = x + q k - +
Similar to Stoikov and Saglam [50], we consider the dynamics of the mid price
k
(p"
-Ip.)/ 2 k k - ... N +1 . which is the average of the bid and ask prices. Letthe mid price at period k + 1, be Pk+1 = ph + 6k- can be dependent on the mid price Pk. and we assume that
ok
conditional on Pk is independlent of(4
conditional on pT for any k -f k. Note that a large family of stochastic processes satisfies this assumption. For example, suppose that ph, follows a geometric random walk,i.e-Pk-1 = pk exp(p - 6k) where p is the drift component and
o.
is i.i.d. distributedfor any k. It is straightforward that = Pk ph (exp(p + 6) - I) conditional on ph is independlently distributed for any k. Of course, a random walk is also a special case
of the mid price model if we assume that
ok
is i.d.d. distributed for any k. Within a day., the geometric random walk is almost the same as an ordinary random walk ifthe price change at each stage is small (e" 1+ x if
Ixz
<
1).We introduce another parameter ek to model the bid and ask prices. For any period k, Ck is defined such that the bid and ask prices at period k for any market-maker are p'= pA. - rA' and p" = pA + EA respectively. Note that eA. is the transaction
cost
theclient
pays when he or she trade one unit of the asset with the market-maker, or the transaction cost the market-makers pays when it trade one unit with other market-makers to control its inventory. We also refer to eq as the transaction cost in period k. For any period k, (k must be strictly positive so that the bid priceis always lower than the ask price. Simimlar to the price miovement ., we also assume that Ck conditional omn Pk is independent for any k. For example, we can choose
. = Qk(pa.) + p. where 'A(pA.) is a given function and -A is an independent random
variable for any k. When &I = 0, Ck - 0A(p) becomes a constant once pk is known., e.g., cA can choose to be 0.01% of the mid price. Moreover, if all the foreign exchange market-makers quote the conventional spread, then A = .A, is a constant equal to a
half of the conventional spread.
To model orders froim clients, we use the random variables SA, and dA. to denote the amounts the clients buy from and sell to the market-maker in perio(d k respectively. We also refer to Sk and d(. as the supply and demand from the clients respectively.,
since these aimounts increase or decrease our inventory levels. Both sAi and dA. should be nonnegative, and sk and dk can be correlated for a given period k. For the time being, we assume that sA. and dA. conditional on pA. are independent for each period k. but we allow non-stationary dlistributions for sk and dk across different period k in order to model the intraday pattern in the trading volume. e.g., the trading volume is higher when the market opens or closes.
So far we have defined two randomn processes: (i) Pk anld 6k which jointly define
the bid and ask prices of the underlying asset and (ii) sE and dk to model the orders from clients. These two processes can be dependent on each other in order to capture the correlations between the trading volumes and price movements, i.e.. the four
random variables (k, 6ks d conditional on pk can be correlated for any given
k.
For example. if we observe that the amount of sell orders sA, is significantly higher than the amount of buy orders dk. we expect that the market price is more likely to go down, i.e., the probability that 6k is negative should be higher than the case when the reverse is true. In addition, all these random variables can also depend on pl. for any k as we stated in their definition.
In any period k, the profit we obtain from the bid-ask spread by trading with our clients is (dk + s06k. Note that we trade |qkI at the price quoted by other market-makers, and hence the transaction cost is qkleh. In addition, the market-maker's
inventory is subject to the risk of price uncertainty, and hence it may incurred a
profit or loss of the amount (x.- + qA. - dk. + s5)1,. As a result, the one-period profit
at period k,
k
= 1, ..., N is7k = (Xk + -k - + Sk)k s4 (dk + Sk - gqkj)(k.
To simplify the notation, let Lk -- x - qk be the inventory level after adjustment,
Sk= dA
+
s. and Zk =sk -dk..
Then7A = (LA_ + Ak>k + (Sk - LA. - xje)E. (2.1)
Note that here we do not consider the fee the market-maker pays to short the asset. This is because the fee is neglectable for liquid assets. e.g.., foreign currency. In addition., the structure of our problem remains the same and the optinality of the threshold policy still holds even if we consider a linear short fee.
We let 7N -N+1) U(xN+1v denote the profit or loss at end of the planning horizon, where v(xN+1, dN+ 1 ) is a concave function with respect to XN+1. Note that
LN also depends on PN>+1 if t:N-+1 depends on PN+1. If the positions at the end of
the trading day can be clear at the mid price, or we mark to the mid price at the end of the day, then 7rN+1 = 0. If the inventory position at the end of the day. xN-1
is cleared at the price quoted by other market-makers, the market-maker incurs a salvage cost of rlN+1LXN+11L
i.e..
TN+1 =-eN+1N+1-We adopt two approaches to characterize the risk-averse attitude of the decision maker: exponential utility function and mean-variance analysis. The objective func-tions as well as the properties of the optimal control policies under the exponential utility criterion are presented in the remaining part of this chapter., and we discuss
the corresponding results for the mean-variance analysis model in Chapter 3.
Before we end this section, we would like to point out that most of our results are not restricted by the assumptions we present here. and the generalizations are discussed in details in Section 3.7. For example, we can also allow auto-correlations
in the movements of prominent bid/ask prices as well as the client orders., i.e..,
o,
k, 5kd Ck conditional on pk can be correlated across the period k. Furthermore. the
bid/ask spread a market-maker charges its clients can be different from the spread charged by other makers. i.e.. the bid and ask prices quote by other
market-makers are p,- pm - q. and p" =P -i- e while the bid and ask prices we quote to our clients are -=p - and p = Pk + (-.
2.2
Optimality of the Threshold Policy
Suppose that the market-maker has an exponential utility function U(w), i.e..
U() =- exp(-)7T). where p > 0 denote the risk-aversion parameter.
Note that large p implies higher risk aversion. Since the time horizon is one day, the market-maker does not care how much profit a particular strategy generates in the due process. Instead, lie only looks at the profit at the end of the day. We should choose the amount qk to maximize the expected utility of the total profit generated in the day, i.e.. the objective function is
Note that Bouakiz and Sobel [10] considers a similar objective function for the classical inventory model. As a result. the corresponding Bellman equation is
Jk.(X., Pk, k.) = min E
{
Jlk1 (xhA + qK - dk + sK, pi +oK
ei+1) p8, e.qk)
for any k= 1.N, and JV+1(xN+1,pAN+1 (N+1)
=
exp(-pN+1). The state in the dynamicprogramming
model consists of Xk, pk and ekbecause
we observe the inventory position x1. as well as the bid and ask prices defined by Pk and e. beforewe decide the adjustment quantity qk, which is our decision variable. Note that we consider the expectation conditional on pk and ek
because
the distributions of 4o, 5k and AK depends Oil Pk and q..Similar to (2.1), we define LA. = x + qA, Sk = dK- k Sk and Ak = sk - dk. Inserting in (2.1), the Bellmnan's equation is reduced to
JA. (i,x
J A, A
enmin E e
6K -I~ pm£ ((GLk 4- Ak) k-+(Sk L kX- k 1xJA.+ (Lk Ak , Pk-bokAek1) p. A}k, (2k
for all k = 1.. N.
Under the exponential utility objective function in (2.2), we obtain the following optimal inventory control policy.
Theorem 2.1. The optlimal control policy for the dynamic programming m'odel in
(2.2) is as follows. For aniy period k, there exist threshold lerels, independent of the
iventory xA , TI (A
A
,)
and T1: (pA,.cK)
where TA(p, eK) > T7 (pA. K) for anygiven p, s'ch that the optimal order quantity q -A, (Pk (A 6k) -k If 3'k T(pk, (k)
(I= TK(pK, eK) -- X, if xrA. > TF(pK., -A) and qK = 0 otherwtiSc.
In other words, given the current mid price Pk and the half of the spread (-k., which
specify the miarket bid and ask prices, the optimal policy is to keep the inventory level 3rk within a certain interval [T(p. "K) (Pk -k)]. When xk < T' (pK, eI) the
inventory level is too low and the mmarket-maker will lose a significant amount if
increase the inventory upto T7(p., EA). Similarly, if the inventory level is too high, i.e., 16 >
Tj(p,
Ck), the market-maker should decrease its inventory to T"(p6, ek) so as toprotect against the case that the market price decreases drastically. Otherwise, the inventory is contained in the interval [T (p6 ), T (pA, ek)] and no action is required. i.e., the market-maker only needs to accept the orders from its clients and carry the inventory to the next period. We refer to the interval
(AT.j
i ). TT (p, 6-)] as thenio-trade region, where it is optimal not to actively trade with other market-makers.
In the rest of this section, we prove Theorem 2.1 by induction on the number of periods, k, and illustrate it using a numerical example.
Before we jump into the technical details of the proof of Theorem 2.1, let us first introduce the following notation, which will be used in the remaining part of Chapters 2 and 3. Since the functions we consider here may not be differentiable everywhere, e.g., the absolute value function., for any function f(x). we let f'(x) denote its left-hand derivative, i.e..
. f(x) - f(x - d)
f ,() = hm
d.10 d
which always exists if f(x) is convex.
Futhermore, for a multivariate function
f
(x. 2 ... ,, ), we use ((, x, ... , X to denote the left-hand derivative of f(x1. x2,..,,) with respect to the variable ri,Another important property for convex functions is that we can interchange the expectation and differentiatio)n operators. To be precise, suppose that f(x. y) is a
convex function with respect to x, Y is a random variable., and g(x) = Ef(xr Y)] is well-defined. According to the monotone convergence theorem, we have g'(x)
E[
f(x, Y)], see also Bouakiz and Sobel [ 10).
To prove Theorem 2.1 by induction, we start by assuming that
(Al) JA+ 1(x, p. () is nonnegative for any x, p and e,
(A2) eLJ6 41(L - A, p, e) is a convex function in L for any given a, A. p and 6.
also satisfies the induction assumptions (Al) and (A2). The proof is complete once we establish that JN+1(xN 1 ,pN+1. &N+1) has the properties (Al) and (A2).
Note that in the classical inventory problems. e.g., Scarf [47] and Bouakiz and Sobel [10], the initial inventory position Xk clefines the constraint that the order upto level is greater than x.., but it does not appear in the objective function of the
Bellman equation. However, in our Bellman equation (2.3), we cannot pull xA. out of the objective function because it is included in an absolute value function.
Let us define the functions f0(LA..pA., -A) and f"(LpA. e ) as
f j ( pp, eC-p Ls, e (=LE A' k, sk +(g -k-Lk, je(k+ k kpk k +1 kk
fk (Lk, Pk. (k) - E 1pk-nk+(5+L)) k+1 (Lk + -A k Pk + (5k (k+ 1) Pk, ek
17A
(Lk. Ak Ck) E £C e(L.~.O--S-L))JA--
(Lk + .~ PA (-4-1 A1) Pk! (kA (2.4) It is easy to show that the Bellman equation (2.3) is equivalent toA Imin min -fXkk k f(Lk p, .6, min e41kk'/, k,p
P)))
=Min e" min fj(Lka,(k) ,eC min fT (L~k k .
L k ::>xK L k <-xk
(2.5)
After reformulating the Bellman equation, we decompose it into three sequential opti-imization problems. The problems minmjh
f(LA,
PA, e,) and minL - (Lk, p, (-) minimize a single variate function subject to a single constraint, whose structure is the same as the optimization problemns in the classical inventory control models. How-ever, we have another minimization operator which compares the optimal solution of these two problems. In this sense, the problem in (2.5) is more challenging than those in the classical inventory models.For any given Pk and (, let T7(pk, -k) and Tr(p, 6k) be the global minimizers of
f1(L
PA. -Ae) andfJ(LA.
pA, EA.) respectively, i.e..T(PA: e (-= arg min
f
(LA,. ) and T (pA, A) arg min.f!
( LA, pa. A).Lk woul like t eai te fo L k PA, A)
f,(LA!pA.
P, e.) as well as the minimizers T (pte 6.) and Tk(pA. ,4).Lemma 2.1. Sutppose that Jk+.1(xk+1. pk+1 Ek+1)
satusfies the
7In(Achon asUinptions (Al) and (A 2). Then (i ) f7 (LA. pk. ei) andfT(LA.,
pA,. eA) are convexfnrctions
withrespect to Lk, and (ii) T'((Ek) K T(pkek)
for
any given pA and -i.Proof. Let us consider these two functions
hI'(Lk, p4 k Ak, Pk k k k +) = e-p(+o)-eA)L. I k+1 ( Ak 14 pk +
o
k61)hk(LLk, p, &k, APkk -, 6k+1) ~- e ((kk+(k)L:AI+ (L Ak, P+ , k+1)
According to (A2), h(Lk, Pk, (k, Ak, (k (k+1) and h 2(Lk, Pk, eA Ak- k, A, +1) are convex in Lk.
If we rnultiply both functions by e-P(Akkk-1ke), we have
__. -')(LAkC1- -kI)k-s-h e)J~ L A.A-~.~
g (Lkp, 6k, -Sk Ak.e Ck+1) eP(sko±sCkeh](Lkp k ek. Ak. (5k, 1)
_ -((Lyk o+4+(Sk - Lk) jek I+ kp k k1
- )~.~(S--~ -) JA--iLA kPA- A., A,1)
gT k L , , sk, Sk, k, (5k +1 - R s+ "*h, ( Lk, p- PkF, Ak -,ok, 6k+t1)
e pA +Ls 1o+SL (a Lk+ Ok + k, Pk (5k
Ck,k1-Note that e P(Ak5k+Sk k ) does not depend on LA.. Hence, g1(LA, pj. eA. Sk, Ak. (4, ek.i)
and gk(L p P k-, 'ak , Ak 5k,' Ik+1) are convex functions with respect to LA.
By definition. we have
g (Lk.A,, EkSe~k~ e1 =A e 5A -21Ck~k g '(LA- pl, cA S,. A.. , () 1).
Since both functions are convex in LA, their left-hand derivatives with respect to LA. exist. Therefore.
-l9; (LpA. pk, (ASk, 76-1) -- 2p ke-2-,L. Pk, -k! kA o -k+)
+ eLk P2k kA, k,
Sk,
k6k+1
non-negative by the assumption (Al). It follows directly that
(Lk
p,ck.,
S, kk (Lk , 1) ep ( LOLk OLk
According to (2.4), it is straightforward that
f7
(Lp. PA CA) = E[g
(LA-, p]4.k Sk. A-A.]kX +1) pA.f(Lk,
-kp, - = E [g2 (Lk~p!, k, Sk, Ak ek+1) pk 6k]-Recall that both gj(LkpA, ek, Sk Ac,
o9,
ek.±) and gk(LApk, ek, Sk, Ak, 4, Ek+1) areconvex in Lk. Therefore. f7(Lk, pc. ek) and fl(Lk, p, ek) are also convex in Lk. which implies that
L> ye ) = E L & p(-e., S. LA. ,ek1 pV. c,6 cl-) c C.
a L
e-2pe (LkE -,PA -(L k pS k Sk, k , pAk)e
OLA /
where the inequality is obtained from (2.6). Since e-2,JkLk > 0, it follows directly
that AL0 (Lk- Pk. C) < 0 if a (Lk. Pk e() < 0.
Consider any given pA: and q,. According to the convexity of
j(LA, p-,
6k) inLA. and the definition of Tk (pA.. eA.), we know that
fr
(LA., pA eA) < 0 for any LA..
xT7(pc.,C)]. Consequently.
(
L Ck) 0 for any Lkc
(-c ,T(p ,ek)1,i.e., f (LA.pA. k) is decreasing in Lk E (-ocTj}p1.k)]. Note that T<(pc.eA) K T(pk, c() is the global minimizer of fl(Lc, pc, Ce) with given PA and (A., we obtain that T j(pk, Ek) < TpA, A)
Next. we are going to show the optimal policy for period k under the assumptions
(Al) and (A2).
Proposition 2.1. Suppose that Jk.+1 +1 pk+1., Ek-+ sa1) sati.sjics thc i-d5uction
(2.3) is
T7(Pk., 6k)
if
Xk<
T(pi.
ek)L*. = x if T(P p k) < x < Ti(pA, 6k ) (2-7)
T (pk, 6k) if Xk > T(pk 6k)
and the correspondling optimal value is
e-,(kfkl(T Pp -k).pk 6k) 'if X k < TA(pk 6k),
JA- (Xis k. Pk) 0
fA!,
( k k) A C") JkfX, Pk- - k)P-'Zk
f
)if
xx> T2(p
) k .k Tf~~lb A2(T,'(P k 6k) P k. k) -k.> 71P.k
(2.8)
Proof. It is equivalent to show that the results defined in (2.7) and (2.8) hold for the
optimization problem in (2.5). Let us consider the following three cases.
* Suppose that xk < TApk, -k).
We proved in Lemma 2.1 that
fj7(LA,
Pk-, Ck) is convex in Lk. Therefore, for theoptimization p~robl~1em1 mnL 6 X
f;>Lk,
pA, (k), the optimal solution is T7(Pk, ek)and the corresponding objective value is
fj
(T(pk, k), Pk 4).Lemma 2.1 also shows that
fA2(Lk,P
k,( A) is a convex function with respectto LA. and T(p, 6k) T 7>(pA., 6,e). As a result. for the optinization problem minL,, fT(Lki Pk- k), the optimal solution is xk and the corresponding
objec-tive value is fT(xk, Pk-, (k).
The definition of f7(Lk, pA., 6k) and fk(LkpA, ek) in (2.4) suggests that
e-Prks"f7 (xA, pakeC) =A- ek(x, PA- A)
Note that e-P'k t > 0 and
f7
(x k- Pk. k) >fi
(T (pk, ek), PAk ek) by the definitionof TJ (pk. Ek). It follows directly that
i.e., the optimal solution to (2.5) is Tj(pp., eA,) and the value of JA.(XA., PA., e) is e-PXkEkfl (T (p, 6k)-Pk, k).
* Suppose that T (Pk-, 6k) < 3 ; TA (pk, ek). The results of Lemma 2.1 show that
the optimal solution for both minLg y>,
fk
R (Lk, p 4, e ) and minL k-f
(Lkpk , ek)is yk. It follows immediately that the optimal solution to (2.5) is zk and the
corresponding value of
JA(x,
pA,(.)
is e -,'kx kkfIx,
pE, ) eI* kf (Lp. 6 A,)* Suppose that Xk > T(pa, eA). The result can be established by an arguement similar to that in the case Xo < T7 (pk, e). D
Note that LA. is defined as xj-
+qA.
Therefore, the optimal inventory control policy shown in Proposition 2.1 is exactly the same as that in Theorem 2.1. However, in order to complete the induction proof for Theorem 2.1, we need to show that the value function J(Xk, Pk*, e6) satisfies the assumptions (Al) and (A2).Proposition 2.2. Suppse> tha,0t Jk+1 (xk+1pk+1, -k+1) satisfies the induction (assuamp-tions (A1) and (A2). Then (i) JA(X.p.e) is nonnegatite
for
any x, p and 6, (ii)eaLJ (L -- A, p, e) is a con vex function in L for any g!iv'Ve1n a, A. p and a .
Proof. The part (i) of Proposition 2.2 follows from the definition of JA.(XA.P, t) in
(2.8). the definition of
f
(Lk, pA, (k) andf (Lk-pk,
ek) in (2.4). the assumption (A1)and the fact that the exponential function is nonnegative.
For the part (ii), given a, A. p and 6, let us consider the functions hI(L), h2(L)
and
h3(L) such thathi1
(L)
aL-pL+A ( .h2(L) =eLL- p > fl(L + A.p c) =, eL-r)L1g f (L Ap, p+ c)
hs(L) =P eaPp!a
Note that
fi(T,(p,
c), p. e) is a constant, and the exponential function is convex.Next, we would like to prove that h2(L) is convex. In this case, h2~ o(L= )EL-p+[6 ,)f(L + A, p, ) =L e+-g~n e +
i-
,!+
j,+ (5;,-
Jk+1 (L -+- A 1Ak 1 + 5k, ek41) P . F P, . (2.9) The assumption (A2) shows thate(a-p-)L Jk1 (L -A , p 6k + e+1)
is convex in L. Since e"((a'104 +se' is independent of L.
P((a+Ak)oAk~s5,(a_ PA)LJ _+1 (L + A + Ak + k, (k+ 1)
is also convex in L. The definition of h2(L) in (2.9) immediately yields its convexity in L.
Let us define h(L) = e"L JA(L + A, p, ). According to (2.8), we have
h(L) = e"JA(L +'A.pe)
hi (L) if L + A < T(p, e)
h,(L) if Tj(p,) < L -- A T (p),
h3(L) if L+A > T(pT (x ).
We would like to prove the convexity of h(L) by showing that its left-hand derivative
is non-decreasing, i.e., h'(L) < h'(L) for any L < L. It is sufficient to consiler tile
following five cases.
* Suppose that L -+ A < T (p, 6) and L + A < T (p, e). The definition of h(L) in (2.10) implies that h'(L) - h'1(L) and h'(L) = h'(L). We obtain h'(L) < h'(L)
since h'1 (L) h'(L) by the convexity of hI(L).
* Suppose that L-A < T (p. c) and T (p, ) <
IAL
K T7(p. 6). We have hi'(L) =hl (L) by the definition of h(L) in (2.10). Moreover. since Tj, (p, ) - A < I the
AL. k+S) A(a-p )L (L + A
- Ak - P -k , p k (,ke 1)
(2.10)