HAL Id: hal-01004318
https://hal.archives-ouvertes.fr/hal-01004318
Submitted on 28 May 2020
HAL is a multi-disciplinary open access
archive for the deposit and dissemination of
sci-entific research documents, whether they are
pub-lished or not. The documents may come from
teaching and research institutions in France or
abroad, or from public or private research centers.
L’archive ouverte pluridisciplinaire HAL, est
destinée au dépôt et à la diffusion de documents
scientifiques de niveau recherche, publiés ou non,
émanant des établissements d’enseignement et de
recherche français ou étrangers, des laboratoires
publics ou privés.
Why wheat farmers could reduce chemical inputs:
evidence from social, economic, and agronomic analysis
Stéfanie Nave, Florence Jacquet, Marie-Helene Jeuffroy
To cite this version:
Stéfanie Nave, Florence Jacquet, Marie-Helene Jeuffroy. Why wheat farmers could reduce chemical
inputs: evidence from social, economic, and agronomic analysis. Agronomy for Sustainable
Develop-ment, Springer Verlag/EDP Sciences/INRA, 2013, 33 (4), pp.795 - 807. �10.1007/s13593-013-0144-y�.
�hal-01004318�
RESEARCH ARTICLE
Why wheat farmers could reduce chemical inputs: evidence
from social, economic, and agronomic analysis
Stéfanie Nave&Florence Jacquet&Marie-Hélène Jeuffroy
Accepted: 22 March 2013 / Published online: 19 April 2013 # INRA and Springer-Verlag France 2013
Abstract Though European policies recommend pesticide reduction, most farmers still manage their crops with a high level of chemical inputs, notably in arable crop-based sys-tems. Factors influencing farmers’ practices and the reasons why they do not adopt alternative techniques are not well-known. Actual reports on that topic are based on monodisciplinary analyses either in agronomy, sociology, or economics, whereas farmers’ motives are most probably manifold. Therefore, we surveyed winter wheat agricultural practices to understand the factors influencing the choice of crop management plans implemented by farmers. We interviewed 71 farmers in the French Department of Eure-et-Loir. Results revealed three main types of practices depending on inputs and wheat yield: (1) 29 % of farmers use low levels of inputs and get low yield, (2) 38 % of farmers use medium levels of inputs and get high yield, (3) 33 % of farmers use high levels of inputs and get medium yield. We found that the medium-input type is the most efficient with better economic results whatever the wheat price. On the other hand, the high-input type has a lower economic performance. We showed that farm profile, indi-vidual motives, and social commitments explain the level of
input use. High-input practices are often implemented by farmers who have less family labor availability and who rarely join extension groups, whereas low-input practices are conducted by farmers bearing civic responsibilities and showing environmental awareness. The novelty of our study is to use a multidisciplinary analysis to take into account agronomic, social, and economic factors.
Keywords Crop management plan . Low-input systems . Winter wheat . Farmer typology
1 Introduction
The amount of pesticides and nitrogen used in European Agriculture has shown little decrease during the last 30 years (Aubertot et al.2005) even though several European Union initiatives (Council Directive 75/440/EEC and follow-ups concerning surface water quality) have been implemented in order to encourage the member states to strongly reduce nitrogen and pesticide use in agriculture. The Common Agricultural Policy (CAP) reforms in 1992 and 2003 do not seem to have achieved their objectives in terms of modifying farmers’ practices towards more sustainable farming and cropping systems. In recent years, because of growing concerns of citizens about the effects of chemical inputs on human health and the environment, European public policies have been strengthened and set ambitious objectives to reduce pesticide use in agriculture.
France is the third worldwide and the first European con-sumer of pesticides (Aubertot et al.2005), and around 70 % of pesticides expenses are allocated to arable crops, which cover around 46 % of the total agricultural area (Butault et al.2010). Arable crop-based systems require high levels of inputs per hectare since these systems are more and more specialized, mainly based on wheat and oilseed rape, and are therefore
S. Nave (*)
INRA UMR Economie Publique, av. Lucien Brétignières, 78850 Thiverval-Grignon, France
e-mail: stefanie.nave@gmail.com F. Jacquet
INRA UMR 1110 Moisa, 2 Place Viala, 34000 Montpellier, France
M.-H. Jeuffroy
INRA UMR 211 Agronomie, av. Lucien Brétignières, 78850 Thiverval-Grignon, France
M.-H. Jeuffroy
AgroParisTech UMR 211 Agronomie, av. Lucien Brétignières, 78850 Thiverval-Grignon, France
highly dependent on chemical inputs (Meynard and Girardin
1991) (Fig.1). A strong social and political willingness was displayed in 2008, in a large social forum tracing the objec-tives of the environmental policy of the country (known as the “Grenelle de l’environnement”). Ambitious targets were set: the objective of reducing, if possible, the use of pesticides by half by 2018 was announced, and specific targets for water catchment areas were established. In these areas, financial incentives were offered to farmers to modify their practices, namely the territorialized agri-environmental measures (AEMt) introduced in the 2007–2013 French implementation of the CAP second pillar. However, these measures have hardly been used in the intensive arable crop regions that are yet dramatically affected by water pollution.
According to agronomists, alternative crop production techniques exist that allow a significant decrease in the amount of nitrogen and pesticides used (Loyce et al.2012; Chikowo et al.2009). They are based on the combination of several cultural control methods aiming at reducing the crop nitrogen requirement, the occurrence and development of diseases, and the lodging risk (Loyce et al.2008), such as the choice of disease-resistant varieties, the reduction of sowing density and nitrogen fertilizer rate (mainly in the first application) (Vereijken1989; Eltun et al.2002; Charles et al.2006). Focusing on wheat, studies show that in France, these alternative practices are very close to conventional practices in terms of profitability for prices which prevailed during the 1992–2006 period (Loyce et al.2012).
In agricultural practices, factors that could explain the di-versity of crop management plans and help to identify the conditions favoring a decrease in input use are not well-known. This is partly due to the inconsistency of the various data needed for this analysis. In France, detailed field-scale data on practices applied on arable crops are available through a national survey conducted every 4 years by the French Ministry of Agriculture (“enquêtes pratiques culturales” from the Service de la Statistique et de la Prospective, which is the department of statistics of the Ministry of Agriculture, carried out in 1994, 2001, 2006, and 2010). At the farm level, data on
input use, production, and incomes are available from the Farm Accountancy Data Network, but they are not disaggregated for each crop and cannot be linked with field practices. These two databases show that there is a wide diversity of input use between farmers, but they do not give any information on the reasons for it. Agro-economic studies allowed identifying sev-eral crop management systems (Jacquet et al.2011) but did not reveal the reasons why they could be adopted by farmers. Thus, our work is structured around two main steps: (1) characterizing the existing crop management plans adopted by farmers and their performances in real agricultural condi-tions and (2) understanding the factors that influence the adoption of the crop management plans described.
The originality of our approach is to take into consider-ation simultaneously the agronomic consistency of farmers’ practices and social and economic reasons for agricultural input levels, through a survey addressing both topics. In order to better understand the reasons why some farmers prefer low-input systems whereas others use high levels, it is necessary to combine information on field practices and on their explanatory factors at the farm level. We surmise that several interlinked types of factors can explain farmers’ choices. Thus our study attempts to characterize various agricultural practices according to their level of inputs, and then to analyze factors that influence farmers in their tech-nical choices. As it appeared impossible to combine data on practices and adoption factors at the national scale, we chose to perform this analysis in a region with a large area of winter wheat, regularly reaching high yields for this crop, characterized by similar soil and climatic conditions, and seriously concerned with environmental problems, such as high levels of nitrate or pesticides in underground water.
2 Materials and methods 2.1 Sampling and data collection
Data were collected from 71 farmers using face-to-face in-terviews conducted between October 2010 and February 2011. As we chose to conduct a survey in a French arable region and to focus on wheat crop management, the surveyed farms were located in the department of Eure-et-Loir in the Centre region of France (around 100–140 km southwest of Paris). This department is ranked first in France for cereals and oilseed production, since 75 % of the farms are specialized in arable crop systems. This is linked to the favorable soil and climatic conditions of this region, characterized by loamy soils of high agronomic potential. Moreover, Eure-et-Loir is the third French Department for wheat production, which covers 60 % of the cereal acreage and 40 % of the arable crop acreage. In Eure-et-Loir, groundwater quality is degraded, mainly due to diffuse pollution from agricultural practices,
Fig. 1 Sprayer in wheat crop. In Eure-et-Loir, agricultural systems are mainly based on wheat and oilseed rape and are still highly dependent on chemical inputs
and numerous water catchments are affected by high nitrogen and pesticide contents (Région Centre2010). In these catch-ment areas, AEMt are offered to farmers to promote environmentally friendly practices in order to improve water quality. We could therefore assume that farmers in these areas are aware of low-input crop management and that we could expect to find a range of levels of input use in this region.
Unlike studies dealing with specific practices such as or-ganic farming or integrated pest management (Bürger et al.
2012; Burton et al.1999), we aim to have a representative approach of actual farming systems. So we did not specifically target farmers already involved in radical changes of agricul-tural practices. We made a random sampling among all farmers located in 15 municipalities concerned by diffuse pollution (pesticides and nitrogen) in their water catchments. Water catchments straddle several municipalities and their boundaries do not exactly match those of the municipalities. Hence, some farmers in our sample drawn in a municipality do not necessarily cultivate land in a water catchment (75 % of farmers have at least one plot in a water catchment). Our sample is essentially composed of arable farms, since 86 % of the farmers are specialized in cereals and oilseeds, 6 % in other crops (such as sugar beet, potatoes or orchards) and only 5 % in livestock (cattle or poultry). There are no organic farms among those sampled for this study (in Eure-et-Loir, organic farming covers only 0.4 % of the agricultural area). Concerning sources of information and advice, the farmers interviewed are connected both with local cooperatives (to buy and sell agricultural products) and public extension ser-vices from the Chamber of Agriculture (which is an operator for the development of AEMt contracts).
Two types of data were collected. First we surveyed farmers about their winter wheat crop management (technical operations used during the year, crop rotations, yields obtained, etc.). They were asked to describe their average practices on a typical field of their farm grown with wheat during the 2009–2010 crop, and to say whether there were any major differences in other wheat fields. Secondly, data were collected about farmers (age, education experience, etc.), farms (areas, crops, equipment, etc.), households (other in-come sources, spouses and children, etc.), farmers’ objectives and preferences, and their sources of information and advice. Data were also collected on farmers’ perceptions of risks, environmental issues, and pesticide use. Perceptions were recorded using five-point Likert-type scales, with which re-spondents specify their level of agreement for different state-ments (Bagheri et al.2008; Tatlidil et al.2009).
2.2 Data analysis
Our choice to proceed in several steps (classification, com-parison, identification of significant differences between
groups) is usual among authors who aim to explain the diversity of agricultural practices (Blazy et al.2009; Joffre and Bosma 2009). Nevertheless, contrary to these authors, we did not use all variables describing farm production systems to perform the typology, since we aimed at classi-fying crop management plans according to their level of inputs, before analyzing agronomic consistency and the links with the other crop management factors. Thus our data analysis proceeded in three steps: (1) we made a classifica-tion of wheat crop management plans using a selecclassifica-tion of a few variables related to input use; (2) for each group of farms revealed by the classification, practices for wheat crop management were described and analyzed; (3) illustrative variables were used to explain the diversity of practices obtained by the typology. All data analyses were performed on Stata 11.0 (Kohler and Kreuter2012).
2.2.1 Classification
Since we want to classify actual crop management systems, not farm production systems, the number of variables used in the typology was restricted to quantitative variables re-lated to input levels and winter wheat yields. These selected variables allowed us to establish a typology of farmers according to their efficiency of input use. Previous studies also proceed to a classification of farms according to pesticide use intensity, using few quantitative input vari-ables (Bürger et al. 2012). Others variables related to agronomic consistency and economic performances were used as explanatory variables, so as to compare crop management plans.
Here, pesticide use was characterized with the treatment frequency index (TFI), which measures the quantity of pesticides applied to a crop during an agricultural campaign. It is considered a good indicator of pesticide use intensity (Pingault et al. 2009). It was calculated as the sum of the ratios of the applied dose per hectare to the recommended dose for each commercial product. For each farmer of the survey, the TFI indicators of the winter wheat crop were calculated per type of product (fungicides, insecticides, and herbicides). The total TFI is the sum of these three TFI. As weed management is more often linked to the rotation, while the use of other chemical inputs is more dependent on the crop, we distinguished herbicide TFI from non-herbicide TFI. The total nitrogen fertilizer rate applied was calculated from the sum of the rates of the various applications. Finally, we used five continuous variables for the classification, consistent with those observed by Loyce et al. (2012): herbicide TFI, non-herbicide TFI, total nitrogen rate applied in kilograms of nitrogen per hectare, sowing density in plants per square meter, and average yield in tons per hectare. Table 2 provides the values of these variables for the total sample.
The first step of the classification consisted of a principal component analysis (PCA) in order to convert correlated variables into linearly uncorrelated variables. In a second step, the new composite variables (components) thus created were used as input variables for the classification using an agglomerative hierarchical clustering (AHC) technique (Ward’s method). This method measures the distance be-tween individuals, using the squared Euclidean dissimilarity option, and creates homogeneous clusters. The AHC results in a clustering tree, and the Calinski–Harabasz pseudo-F index stopping rule, described by Everitt et al. (2011), was used to determine the number of clusters to keep.
2.2.2 Comparison of wheat crop management types The agronomic analysis of the crop management plans obtained by the classification was conducted using variables that describe agricultural practices. We were interested not only in input quantities, but also in other indicators such as varieties, soil tillage, sowing dates, and crop rotations that can explain the consistency of farmers’ technical choices. Economic results were also estimated on the basis of aver-age input prices and under different wheat price scenarios so as to compare crop management plans. Input costs per hectare were calculated for each category of input, as the doses of products applied multiplied by their price. Prices of products were estimated thanks to a departmental price database established in 2008 by CERFRANCE Alliance Centre, listing input costs (pesticides, fertilizers, and seed costs). Wheat gross margin was calculated as the difference between sale revenue (average yield for the last 5 years× average wheat price) and total input costs. In this calcula-tion, we did not consider work costs, land costs, or any subsidies, which are rather considered to estimate farm profit. Moreover, since these data were collected at farm level it was not possible to reallocate them specifically to wheat production. Here, the gross margin is used as a tool to estimate the likely returns or losses of wheat crop manage-ment plans, taking into account direct input costs.
2.2.3 Identification of significant differences in farm types For a long time, studies have been made on farmers’ behavior in the adoption of new technologies. The literature already lists factors that influence farmers in their decision-making process (see Edwards-Jones 2006 for a review) or in the adoption of innovations (Feder et al.1985), in particular in relation to sustainable practices (Burton et al.1999; De Souza Filho et al.1999). Hence, in order to explain the adoption of the different types of practices revealed by the classification, we chose variables (described in Table1) which were related to farm and farmer profile, to the farmer’s professional net-work, preferences, and beliefs. After classification, these
illustrative variables were analyzed using analysis of variance for quantitative variables and Chi2tests for qualitative ones, to identify significant differences between clusters.
3 Results and discussion 3.1 Results of the classification
Due to a lack of data for 5 farmers, we classify 66 out of 71 individuals. Given the results of the PCA (data not shown), and according to Kaiser’s criterion, we chose to retain the first three factors (i.e., factors for which eigenvalues, that represent the quantity of information saved, were above 1), explaining 75.8 % of the total observed variation. Based on the calculation of the Calinski–Harabasz pseudo-F index, the most distinct clustering from the AHC analysis was a classification into three groups, indicated by the largest value of the index.
Descriptive statistics for each variable initially chosen for the classification and other TFIs are presented in the first part of Table2. We can observe a gradient of levels of input use, which characterizes the three crop management plans. The first farm type has the most extensive practices (“low input”); the second includes farmers who adopt intermediate input use with TFIs and nitrogen rate close to the sample average (“medium input”); and the third has the highest level of inputs (“high input”). Analysis of variance shows that all these variables, except herbicide TFI, differ signifi-cantly between groups. This indicates that the three types differ significantly from each other, mainly in pesticides use. Type 1 differs significantly from types 2 and 3 in total nitrogen rate, since it has the lowest rate applied, whereas types 2 and 3 apply similar, above-average, nitrogen rates. It contrasts with sowing density, for which type 3 has a sig-nificantly higher density than the others. Finally, in spite of their difference in input use, types 1 and 3 give a similar, below-average, yield, whereas type 2 has a higher yield. These yields are consistent with the average yield observed in the Eure-et-Loir Department, which was of 7.8 t/ha in 2010.
3.2 Wheat crop management plans and associated performance
3.2.1 Description of the wheat crop management plans and rotations for the three farm types
The description of the three types of farming practices refers to the results presented in Table3. Farmers of type 1 mainly sow multi-resistant cultivars (74 %), compared to type 3 (32 %). This is consistent with the main criterion for cultivar choice declared by type: type 1 prefers the resistance to
diseases, while type 3 prefers the yield potential. Moreover, on average, farmers of type 1 sow at a lower density than those of type 3, although there is wide variability for this variable within both types. Although sowing dates are quite similar, the earliest sowing dates are
observed for types 2 and 3, since farmers of type 1 never start before October. Yet, the choice to use multi-resistant cultivars, to reduce sowing density, and to delay sowing date allows reducing the risk of disease and lodging (Colbach et al. 1997).
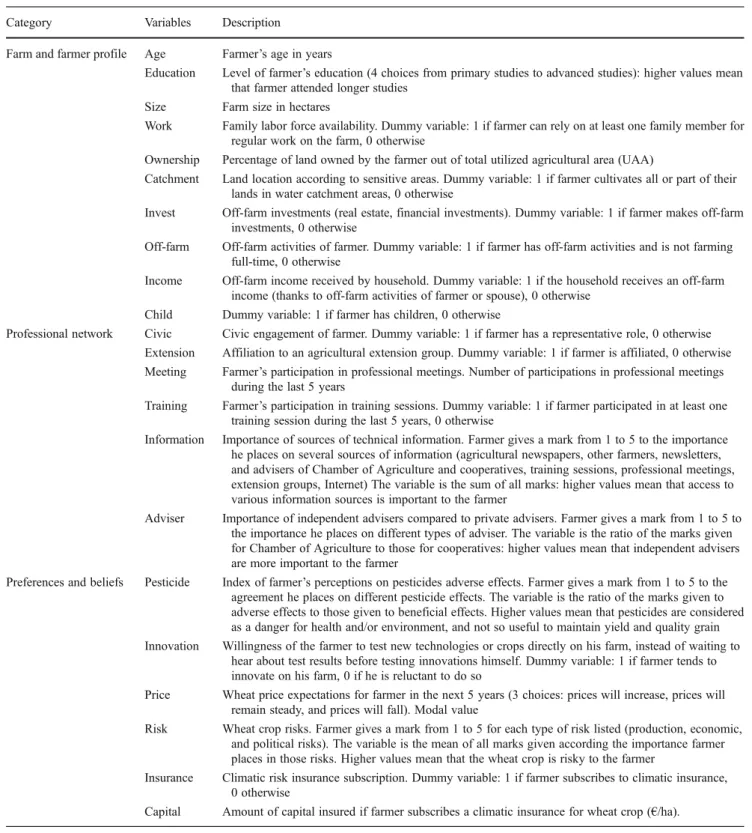
Table 1 Description of illustrative variables considered in the analysis of the determinants of winter wheat crop management types identified in the classification
Category Variables Description
Farm and farmer profile Age Farmer’s age in years
Education Level of farmer’s education (4 choices from primary studies to advanced studies): higher values mean that farmer attended longer studies
Size Farm size in hectares
Work Family labor force availability. Dummy variable: 1 if farmer can rely on at least one family member for regular work on the farm, 0 otherwise
Ownership Percentage of land owned by the farmer out of total utilized agricultural area (UAA)
Catchment Land location according to sensitive areas. Dummy variable: 1 if farmer cultivates all or part of their lands in water catchment areas, 0 otherwise
Invest Off-farm investments (real estate, financial investments). Dummy variable: 1 if farmer makes off-farm investments, 0 otherwise
Off-farm Off-farm activities of farmer. Dummy variable: 1 if farmer has off-farm activities and is not farming full-time, 0 otherwise
Income Off-farm income received by household. Dummy variable: 1 if the household receives an off-farm income (thanks to off-farm activities of farmer or spouse), 0 otherwise
Child Dummy variable: 1 if farmer has children, 0 otherwise
Professional network Civic Civic engagement of farmer. Dummy variable: 1 if farmer has a representative role, 0 otherwise Extension Affiliation to an agricultural extension group. Dummy variable: 1 if farmer is affiliated, 0 otherwise Meeting Farmer’s participation in professional meetings. Number of participations in professional meetings
during the last 5 years
Training Farmer’s participation in training sessions. Dummy variable: 1 if farmer participated in at least one training session during the last 5 years, 0 otherwise
Information Importance of sources of technical information. Farmer gives a mark from 1 to 5 to the importance he places on several sources of information (agricultural newspapers, other farmers, newsletters, and advisers of Chamber of Agriculture and cooperatives, training sessions, professional meetings, extension groups, Internet) The variable is the sum of all marks: higher values mean that access to various information sources is important to the farmer
Adviser Importance of independent advisers compared to private advisers. Farmer gives a mark from 1 to 5 to the importance he places on different types of adviser. The variable is the ratio of the marks given for Chamber of Agriculture to those for cooperatives: higher values mean that independent advisers are more important to the farmer
Preferences and beliefs Pesticide Index of farmer’s perceptions on pesticides adverse effects. Farmer gives a mark from 1 to 5 to the agreement he places on different pesticide effects. The variable is the ratio of the marks given to adverse effects to those given to beneficial effects. Higher values mean that pesticides are considered as a danger for health and/or environment, and not so useful to maintain yield and quality grain Innovation Willingness of the farmer to test new technologies or crops directly on his farm, instead of waiting to
hear about test results before testing innovations himself. Dummy variable: 1 if farmer tends to innovate on his farm, 0 if he is reluctant to do so
Price Wheat price expectations for farmer in the next 5 years (3 choices: prices will increase, prices will remain steady, and prices will fall). Modal value
Risk Wheat crop risks. Farmer gives a mark from 1 to 5 for each type of risk listed (production, economic, and political risks). The variable is the mean of all marks given according the importance farmer places in those risks. Higher values mean that the wheat crop is risky to the farmer
Insurance Climatic risk insurance subscription. Dummy variable: 1 if farmer subscribes to climatic insurance, 0 otherwise
While farmers of types 2 and 3 apply more than one fungicide treatment, 16 % of those of type 1 apply less than one on average. Conversely, 73 % of the farmers of type 3 apply more than two fungicide treatments, while only 21 % of type 1 do so, type 2 falling between these two groups with 52 % applying more than two fungicide treatments. This can be explained by the fact that type 1 farmers adjust their fungicide program more frequently to plots (68 % of them, against 56 and 59 % for type 2 and 3), essentially depending on wheat cultivar and field observations, whereas farmers of types 2 and 3 who adjust their fungicide practices do so depending on wheat cultivar and previous crops. In the same way, insecticide use is unusual for type 1, whereas farmers of type 3 invariably apply one or two insecticide treatments. This is the only group for which most farmers apply more than one treatment. Almost all farmers of types 2 and 3 apply a growth regulator on their wheat crop, whereas 32 % of the farmers of type1 do not use one.
Strategies for fertilization are different for the three types. Farmers of type 1 apply the smallest quantities of nitrogen fertilizers (168 kg of nitrogen per hectare on average), while the mean rates applied by types 2 and 3 are similar (195 and 202 kg of nitrogen per hectare, respectively). All farmers of type 1 use decision support tools for N fertilization, whereas
these tools are much less used by farmers of type 3. Farmers with intermediate practices consider that they do not over-fertilize since the amount of nitrogen they apply matches the crop nutrient requirements.
Weeding practices are quite similar for the three types since results did not reveal significant differences in weeding variables. Indeed, herbicide TFI is not significantly different among farm types (Table 2); most of the farmers proceed to one to two herbicide treatments (Table 3), and less than 10 % of farmers of each type use mechanical weeding. This is not surprising that we found no difference in weeding practices between the three crop management plans, since weeding practices are managed according to cropping sequences.
In all groups, farmers produce mainly arable crops whose proportion of their arable area varies from 93 to 95 % and does not differ significantly among types. The proportion of farmers growing legumes differs significantly among types: 79 % for type 1, 56 % for type 2, and 41 % for type 3. The proportion of arable area sown with legumes also decreases from type 1 (11 %) to type 3 (6 %). According to farmer’s affirmations, over the last 10 years, the environmental inter-est in input and tillage reduction has increased. Indeed, 59 % of all the farmers in our sample altered their practices in
Table 2 Quantitative variables describing input use, yields, and inputs costs, in wheat crop management for total sample and for each crop management type
Variables Type 1 (low input) Type 2 (medium input ) Type 3 (high input) Total sample
Mean SD Mean SD Mean SD Mean SD Min Max
Total TFI ** 2.95 a 0.90 3.77 b 0.80 4.79 c 1.26 3.87 1.23 1 6.78
Herbicide TFI 1.75 0.65 1.69 0.45 1.93 0.67 1.79 0.58 0.80 3.00
Non-herbicide TFI ** 1.20 a 0.64 2.08 b 0.68 2.85 c 0.89 2.08 0.98 0.00 4.47
Fungicide TFI ** 1.01 a 0.57 1.58 b 0.41 1.93 c 0.55 1.53 0.62 0.00 2.90
Insecticide TFI * 0.19 a 0.41 0.50 a 0.57 0.92 b 0.67 0.55 0.63 0.00 2.00
Total nitrogen rate (kg N/ha) ** 168 a 15 195 b 12 201 b 18 189 20 130 235
Sowing density (plants/m2) ** 241 a 26 250 a 28 303 b 29 265 39 180 350
Average yield (t/ha)a** 7.6 a 0.53 8.4 b 0.40 7.9 a 0.59 8 0.60 6.9 9.1
Yield 2010 (t/ha) * 7.4 a 0.77 8.4 b 0.84 8.0 ab 0.72 8.0 0.90 6.2 9.8
Total input costs (€/ha) ** 375 a 56.3 419 b 41.4 460 c 55.9 421 60.1 303 562
Fertilizer costs (€/ha) * 177 a 22.9 201 b 221.6 202 b 20.9 194 24.2 141 256
Seed costs (€/ha) ** 64 a 7.4 66 a 7.9 77 b 13 69 11.3 48 103
Non-herbicide costs (€/ha) ** 49 a 23.2 77 b 16.1 86 b 33.2 72 28.9 14 150
Herbicide costs (€/ha) * 80 a 29.2 75 a 26.4 85 a 30.5 80 28.5 34 156
Gross marginb(€/ha) ** 782 a 102 849 b 72.9 715 a 93 786 104 579 999
Number of observations 19 25 22 66
Cluster values in one row with no lowercase letter (a, b, c) in common are significantly different (p<0.05) TFI Treatment frequency index, SD standard deviation, Min minimum, Max maximum
**p<0.0001, *p<0.0005 level of significance a
Average yield for the last 5 years, except the two unusual years b
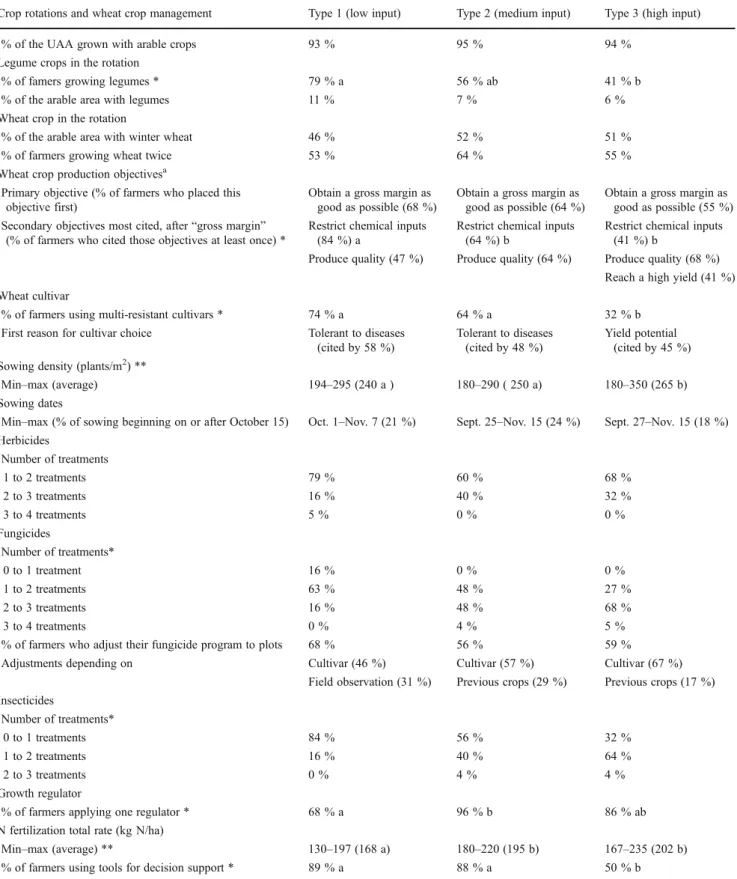
Table 3 Description of crop rotations and wheat crop management plans, by farm type (percentages or modal values)
Crop rotations and wheat crop management Type 1 (low input) Type 2 (medium input) Type 3 (high input)
% of the UAA grown with arable crops 93 % 95 % 94 %
Legume crops in the rotation
% of famers growing legumes * 79 % a 56 % ab 41 % b
% of the arable area with legumes 11 % 7 % 6 %
Wheat crop in the rotation
% of the arable area with winter wheat 46 % 52 % 51 %
% of farmers growing wheat twice 53 % 64 % 55 %
Wheat crop production objectivesa
Primary objective (% of farmers who placed this objective first)
Obtain a gross margin as good as possible (68 %)
Obtain a gross margin as good as possible (64 %)
Obtain a gross margin as good as possible (55 %) Secondary objectives most cited, after“gross margin”
(% of farmers who cited those objectives at least once) *
Restrict chemical inputs (84 %) a
Restrict chemical inputs (64 %) b
Restrict chemical inputs (41 %) b
Produce quality (47 %) Produce quality (64 %) Produce quality (68 %) Reach a high yield (41 %) Wheat cultivar
% of farmers using multi-resistant cultivars * 74 % a 64 % a 32 % b
First reason for cultivar choice Tolerant to diseases (cited by 58 %)
Tolerant to diseases (cited by 48 %)
Yield potential (cited by 45 %) Sowing density (plants/m2) **
Min–max (average) 194–295 (240 a ) 180–290 ( 250 a) 180–350 (265 b)
Sowing dates
Min–max (% of sowing beginning on or after October 15) Oct. 1–Nov. 7 (21 %) Sept. 25–Nov. 15 (24 %) Sept. 27–Nov. 15 (18 %) Herbicides Number of treatments 1 to 2 treatments 79 % 60 % 68 % 2 to 3 treatments 16 % 40 % 32 % 3 to 4 treatments 5 % 0 % 0 % Fungicides Number of treatments* 0 to 1 treatment 16 % 0 % 0 % 1 to 2 treatments 63 % 48 % 27 % 2 to 3 treatments 16 % 48 % 68 % 3 to 4 treatments 0 % 4 % 5 %
% of farmers who adjust their fungicide program to plots 68 % 56 % 59 %
Adjustments depending on Cultivar (46 %) Cultivar (57 %) Cultivar (67 %)
Field observation (31 %) Previous crops (29 %) Previous crops (17 %) Insecticides Number of treatments* 0 to 1 treatments 84 % 56 % 32 % 1 to 2 treatments 16 % 40 % 64 % 2 to 3 treatments 0 % 4 % 4 % Growth regulator
% of farmers applying one regulator * 68 % a 96 % b 86 % ab
N fertilization total rate (kg N/ha)
Min–max (average) ** 130–197 (168 a) 180–220 (195 b) 167–235 (202 b)
% of farmers using tools for decision support * 89 % a 88 % a 50 % b
Cluster values in one row with no lowercase letter (a, b, c) in common are significantly different (p<0.05) UAA utilized agricultural area
**p<0.001, *p<0.05 level of significance a
ways which differed between types: 42 % of farmers of type 1 declared having reduced their inputs (only 37 and 27 % in types 2 and 3, respectively), whereas 64 % of farmers of type 3 declared having reduced soil tillage (only 25 and 31 % in types 1 and 2, respectively).
There is agronomic consistency in the three types of crop management plans, and farmers’ technical choices are con-sistent with their stated objectives (Table 3). Indeed, the main objective of farmers of type 1 for their wheat crop is to reduce the use of chemical inputs. Thus they implement practices in order to reduce the risk of diseases: sowing dates not too early, choice of multi-resistant cultivars, lower sowing densities, lower N fertilization, and a more diversi-fied rotation (which includes legumes). These practices al-low them to reduce the pesticide and growth regulator use, maintaining quite a high grain yield, and they are similar to those suggested by agronomists (see for instance Loyce et al. 2012). On the other hand, farmers of type 3 adopt a consistent strategy aiming for the highest yield, thus increas-ing the crop nitrogen requirement and the risk of diseases, which results in the application of a high level of pesticides and nitrogen. Farmers of type 2 seem to adopt intermediate strategy to optimize their gross margin. They have to man-age the trade-off between two objectives: restricting input use while maintaining quality. Although all techniques are consistent with the targeted yield, intensive farmers obtained significantly lower yields than those of type 2 (7.9 t/ha compared to 8.4 t/ha, Table2) and similar yields to type 1 (only 0.3 t/ha higher, Table2), so it seems that they failed to reach their objective of achieving high yields (Table3). This was previously observed in high-input conditions, due to the difficulty to limit all pests and nitrogen deficiencies (Loyce et al. 2008). Based on the pesticide use efficiency (ratio yield/total TFI), farmers of type 3 appear technically less efficient than type 2, as we notice no significant difference in soil potentials between farm types (over 80 % of farmers in each type cultivate lands on similar clay loams of medium agronomic potential). This inefficiency could be due to a lack of control of the higher risks of limiting factors attributable to the intensive crop management plan (Loyce et al. 2008). High density, high nitrogen fertili-zation rate, and disease-susceptible varieties, which characterize these crop management plans, lead to higher risks of disease and lodging, and higher N re-quirements. If the application of the required inputs is not precisely adapted to the dynamics of these risks, yields may fail to reach their target. As shown by Loyce et al. (2012), inputs are more efficiently used in low-input systems, if associated with an appropriate multi-resistant cultivar. Aiming at reaching maximum yields, farmers of type 3 apply high level of inputs which are not totally recovered by the crop, explaining that they could achieve more variable yields.
3.2.2 Economic performance of wheat crop management plans
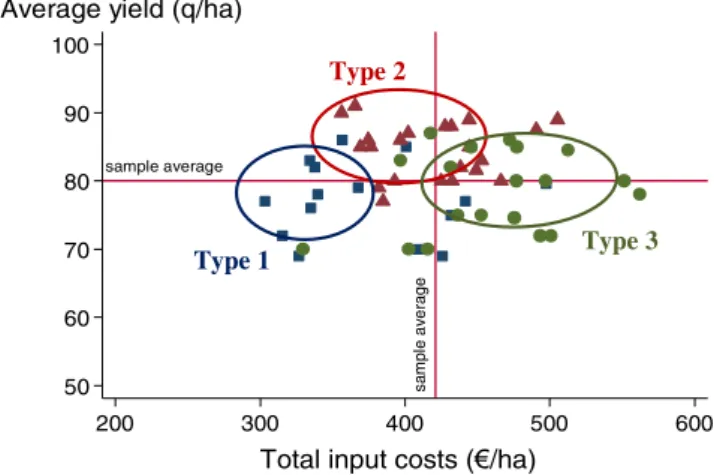
Statistical tests in the second part of Table2show that input costs and gross margins are significantly different between the three farm types. Farmers of type 2 distinguish from others thanks to their higher gross margin, whereas farmers of type 3, who have yet the highest input costs, obtain a gross margin similar to type 1. On Fig.2, almost all farmers of type 3 have above-average total input costs, whereas these individuals are quite scattered around the average yield. This figure also confirms the technical and econom-ical efficiency of “medium input” crop management since farmers of type 2 obtain above-average yield with medium-input costs.
Calculations of gross margin with wheat prices ranging from 100 to 300€/t (data not shown) demonstrated that type 2 differs distinctly from both others: this type obtains the highest gross margin whatever the wheat price. Besides, the higher the wheat price, the larger the gap between type 2 and the two others. Despite their low yield and thanks to the low expenses incurred in wheat production, farmers of type 1 obtain a gross margin higher than intensive farmers (type 3), even more in a context of low prices.
Our survey results show that 61 % of farmers of type 1 signed an AEMt contract and therefore received a grant for it. For an AEMt contract, grants perceived by farmers vary from 74 to 257€/ha, depending on the commitments chosen (i.e., reducing fertilizers or pesticides or both), provided that efforts are similar for other crops on the plot engaged for 5 years. If“low input” farmers comply with such contracts,
sample average sa m p le av er a g e 50 60 70 80 90 100
Average yield (q/ha)
200 300 400 500 600
Total input costs ( /ha)
Type 1
Type 2
Type 3
Fig. 2 Yield according to total input costs for each individual of the three crop management types. Horizontal and vertical lines represent the average yield and costs of the whole sample. Type 1=low input, Type 2=medium input, Type 3=high input. Type 2 is the crop man-agement plan that allows reaching highest yields with medium level of input costs. Types 1 and 3 reach the same level of yields, in spite of high input costs incurred by type 3. Crop management of type 2 appears to be the most efficient
even with lower yields, their gross margin could be close to that of type 2 farmers and even greater when the wheat price is low.
Comparing these three strategies, we show that an intensive crop management plan does not ensure the highest income. Indeed, farmers of type 3 do not reach the highest gross margin whereas they aimed for a high yield. Other studies from economists (Jacquet et al.
2011; Boussemart et al. 2011) have led to similar con-clusions. Our economic results are also consistent with those obtained from a large experimental network com-paring four crop management types for wheat (Loyce et al. 2012). According to these experimental results, in a context of low grain prices, combining an intensive crop management system and high-yielding cultivars is not economically optimal, whereas extensive strategies, based on a consistent choice of the techniques that allow reduced inputs without loss of grain yield, are more profitable. This study also point out that the highest incomes are not necessarily reached for crop management plans that achieve the highest yields.
3.3 Factors of the diversity observed in wheat crop management plans and input use levels
The following analysis refers to Table 4, which indicates mean or modal values of illustrative variables (described in Table 1) and results of statistical analyses by farm types. Among the 22 variables analyzed, 14 have a significantly different value between farm types (two variables at 1 % level, eight variables at 5 % level, and four variables at 10 % level). Depending on the variables, it is not always the same farm type which significantly distinguishes it from others. For example, type 1 particularly differs regarding land own-ership, presence of children, sources of advice, and capital insured for climatic risks, while type 3 significantly differs from others regarding type of labor force, land location relative to catchment areas, and sources of information. 3.3.1 Farm and farmer profiles
In our study, the age of the farmer (age) and the level of education (education) are not significantly related to any
Table 4 Mean or modal values of illustrative variables split by farm types and results of statistical analyses
Category Variables Type 1
(low input) Type 2 (medium input) Type 3 (high input) Total sample
Mean Min Max
Farm and farmer profile Age 47 45 48 47 30 63
Education 3.1 3 2.7 2.9 1 4 Size 147 ha 143 ha 129 ha 139 ha 20.5 ha 330 ha Work ** 0.63 a 0.56 a 0.27 b 0.48 0 1 Ownership ** 44 % a 27 % b 21 % b 30 % 0 % 100 % Catchment *** 0.84 a 0.88 a 0.50 b 0.74 0 1 Invest * 0.26 a 0.36 ab 0.59 b 0.41 0 1 Off-farm 0.37 0.36 0.36 0.36 0 1 Income 0.89 0.68 0.68 0.74 0 1 Child ** 1 a 0.80 b 0.68 b 0.82 0 1
Professional network Civic ** 0.53 a 0.12 b 0.32 ab 0.30 0 1
Extension* 0.53 a 0.36 ab 0.18 b 0.35 0 1
Meeting *** 4.9 ab 7.3 a 2.6 b 5.1 0 20
Training 0.63 0.60 0.50 0.58 0 1
Information ** 26.1 a 25.6 a 23.2 b 24.9 17 35
Adviser * 1.35 a 0.83 b 0.85 b 0.99 0.20 5
Preferences and beliefs Pesticide ** 12 a 9 b 10 ab 10 3 20
Innovation * 0.42 ab 0.56 a 0.23 b 0.41 0 1
Price ** Decrease (54 %) Increase (50 %) Stable (67 %) Stable (40 %)
Risk 3.38 3.57 3.60 3.52 2 5
Insurance 0.95 1 0.95 0.97 0 1
Capital ** 793€/ha a 988€/ha b 1,003€/ha b 933€/ha 300€/ha 1,400€/ha Cluster values in one row with no lowercase letter (a, b, c) in common are significantly different (p<0.05)
Min minimum, Max maximum
category of practices, contrary to previous studies which showed that young farmers or farmers with a higher level of education are more likely to adopt new technologies and sustainable practices (Bagheri et al. 2008; Comer et al.
1999). However, in a study on adoption of organic farming, Burton et al. (1999) did not find any significant relation between education and this kind of adoption.
The availability of family labor force (work) has significant influence on the likelihood of belonging to types 1 and 2. Farmers who cannot rely on family members are more likely to have intensive practices. This can be explained by the fact that extensive practices could lead to increased labor demand (e.g., more observations to monitor pests). De Souza Filho et al. (1999) found similar results for the adoption of sustainable agricultural technologies and Abadi Ghadim and Pannell (1999) found that farms with additional working family mem-bers are more likely to try innovations, since it helps to face peak labor demand. The presence of family members on the farm is also helpful to acquire the technical knowledge and experiences required to trial innovative practices. Note that all farm types hire salaried workers and do not differ from each other on this point.
Ownership of cultivated lands (ownership) significantly dif-ferentiates type 1 from others. A farmer who owns the lands he cultivates is more likely to use fewer inputs. This is in line with the results of Tatlidil et al. (2009), which show that farmers who cultivate their own land are more environmentally conscious, and the results of Carolan (2005) that show that owners are more likely to adopt techniques which preserve their land to ensure future generations’ resources. Arellanes and Lee (2003) argue that ownership provides a land security necessary to make the long-term investments required to adopt alternative agricultural techniques.
Results also show that having children (child) seems to influence agricultural practices, since farmers of type 1 who adopt the most extensive practices are significantly different from others: 100 % of type 1 have children, against 80 % of type 2, and 68 % of type 3. Farmers of this type probably care about future generations, and having children make them more aware of environmental issues, which can ex-plain why they use fewer inputs (Bagheri et al. 2008; Carolan2005).
In our study, farm size (size) was unrelated to the choice of low-input strategies. But studies on adoption of agricul-tural innovations showed conflicting results about farm size: according De Souza Filho et al. (1999), adopters of sustain-able agricultural technologies have smaller farms, but to Feder et al. (1985), farm size is not necessarily an explan-atory factor of adoption of innovations, since it depends on the nature of the innovation and economic constraints.
The variable catchment significantly influences the level of input use. Indeed, types 1 and 2, which have lower input use, cultivate more acreage in water catchment areas (84 % of
farmers of type 1 have at least one plot in these areas, 88 % of type 2, and only 50 % of type 3). Farmers who have the majority of their lands in these areas are probably more concerned than type 3 farmers by the environmental awareness actions induced by public policies. Finally, invest is significant and shows that farmers with the highest level of inputs make financial or real estate investments, unlike those of type1.
3.3.2 Farmer’s preferences and beliefs
First, the variable pesticide has a positive influence on the choice of a low-input crop management plan: results show that farmers who are aware of the harmful effects of pesti-cides on health or the environment (type 1), and who do not consider chemical inputs indispensable to maintain quality, rationally tend to have a low level of inputs. Other studies support this (Hubbell and Carlson1998; De Souza Filho et al.1999).
In many studies, risk aversion appears to be negatively correlated with the adoption of innovative techniques. We found no significant difference between groups for the var-iable risk, which results from direct questions to farmers about their risk attitudes, whereas the variable capital, which is a way to measure their attitude to risk, is signifi-cant. In our sample, the subscription rate of climatic risk insurance is high for every type (from 95 to 100 %), but the amount of capital insured for the wheat crop is significantly less for type 1 than for types 2 and 3. We can assume that farmers who insure a greater amount of capital show greater risk aversion and are more likely to adopt medium or inten-sive practices than low-input strategy.
The variable price is significantly different for each type. This means that farmers who expect to get a high price for the wheat they produce are likely to seek a trade-off between limiting inputs and producing high yields to optimize their gross margin as in type 2, whereas farmers who expect a low price adopt a low-input system. This is coherent with pre-vious results presented in Section3.2.2, showing that there is a relative interest in adopting agricultural practices of type 1 in a context of low wheat prices, whereas it seems advan-tageous to belong to type 2 if wheat prices are high. Then, it appears that technical choices of farmers are consistent with their prices anticipation.
Finally, the variable innovation is significant and shows that intensive farmers are not used to testing innovative techniques on their farms. They first need to observe success in trials on other farms before adopting an innovation, or wait until the technology is more widespread. Abadi Ghadim and Pannell (1999) explained this attitude by saying that they are pessimistic about the profitability of innova-tions. Contrary to type 1, type 2 categorized itself as “inno-vative” and as we previously pointed out, technical choices
of farmers of type 2 allow them to produce a higher gross margin while limiting pesticide use.
3.3.3 Professional network
The relation of the farmers with their professional network can influence the type of practices they choose. Results indicate that farmers who have a representative role tend to adopt more extensive practices (for the variable civic, types 1 and 2 are significantly different). It appears that a farmer with civic engagements is more aware of local issues, such as environmental ones, and as a representative, is likely to set an example for others.
Results show that being affiliated to an agricultural ex-tension group encourages low-input systems: indeed, farmers of types 1 and 2 are more likely to participate in extension groups (extension). On the one hand, extension groups or farming events influence farmers’ perceptions of sustainability (Tatlidil et al. 2009; Bagheri et al. 2008; Comer et al.1999). On the other hand, trials and learning provide information that reduces uncertainty (Marra et al.
2003; Abadi Ghadim and Pannell1999). This is why many studies highlight the key role of the acquisition of informa-tion in the adopinforma-tion of sustainable practices.
However, in our study the access to training sessions (training) did not appear as determining technical choices. But the three groups differ according to their participation in professional meetings (meeting): type 2 participates in more than seven meetings in 5 years on average, whereas type 3 participates in less than three meetings on average. This is in line with what we said earlier about the key role of the acquisition of information, and confirms that collective ex-changes allow sharing of expertise and are useful for farmers to learn about agro-environmental innovations (Rivaud and Mathé2011).
The variable information is also significant and shows that famers of types 1 and 2 seek a diversity of information resources, unlike those of type 3. It confirms that access to a great diversity of information sources influences the adop-tion of technical changes on a farm, as shown by Cerf et al. (2011) and Lamine et al. (2010). Finally, we can see that unlike farmers with low-intensity practices, farmers of types 2 and 3 seek advice from cooperatives rather than from independent advisers such as Chamber of Agriculture (ad-viser). Since cooperatives also sell phytosanitary products, it is often said that there could be a bias in providing neutral advice to farmers. Other studies such as the one of Burton et al. (1999) on organic farming adoption, showed a negative influence of this kind of advisory service. It confirms that the nature of advisory services plays an important role in the adoption of sustainable practices, particularly in the present situation where advisory services evolve because of public policies favoring low-input agriculture (Cerf et al.2011).
4 Conclusion
Our study showed coexisting cropping systems with different input levels, from low input to intensive systems, even in a small region quite uniform in terms of soil and climatic conditions, farm structures, and crops grown. Farmers of type 1 (low input), driven by their objective of reducing input use, implement consistent practices so as to reduce the risk of diseases and lodging. This strategy allows them to achieve medium gross margins thanks to the low expenses incurred in wheat production. Farmers of type 2 adopt a“medium-input” strategy in order to be the most efficient, optimizing their gross margin. Farmers of type 3 (high input) choose a“safety” crop management plan, applying high level of inputs to reach higher yields. Since they could fail to achieve their targeted yields, they obtain low gross margins and appear to be the less efficient group. Whatever the wheat price, the group with an intermediate level of inputs showed the best economic results, whereas the one with the most intensive practices had the worst. Low-input practices seemed as profitable as the best ones in terms of economic results when including agri-environmental subsidies. Distinguishing these three groups of wheat crop management plans allowed us to show that this diversity cannot be explained solely by economic factors. Our results show that the groups of farmers, differing in their crop management plans, are also very different in their motivations and the social network in which they find information. Indeed, intensive farmers were rarely linked with public extension groups and their main source of advice is technical advisers of cooperatives. Access to diverse sources of information and involvement in a large professional network, by reducing uncertainty, encourage adoption of low-input systems. We also identified a positive impact of environmental policies, since farmers who cultivate land within water catchment areas have a lower level of inputs than those outside such areas. Finally, environmental preferences and public or civic engage-ment seemed also to play a role in adopting low-input tech-niques, as the most extensive farmers declare themselves to be environmental conscious, aware of adverse effects of pesti-cides and bear civic responsibilities. Taking into consideration the diversity of preferences and motivations of farmers rela-tive to their level of input use suggests that public policies should take this heterogeneity into account and target individ-ual farmers differently. Type 2 (medium input) which is the most efficient would not change its practices unless public policies implement strong economic incentives such as pesti-cides taxes or subsidies for low-input farming. The AEMt contracts, which seem attractive to encourage farmers to try low-input systems, are not highly regarded even by farmers of type 1 who have already low-input strategy. These contracts suffer from administrative and implementation inadequacies that are considered by farmers as strong barriers to their adoption (Kuhfuss et al.2012; Ducos et al.2009). The need
for a redesign of policies and particularly the agri-environmental payments scheme should be considered in this perspective. Type 3 (high input) reveals that inefficiencies in the use of inputs still exist and shows that it is still possible to decrease the level of inputs used by farmers by a reduction of those inefficiencies, through an enhancement of information and extension policies.
Acknowledgments The authors thank the students from the DA AGRECINA (ecology and agronomic innovations) of Agricultural Engi-neering Schools of ESA Angers and ISARA Lyon, who conducted the surveys, and their professor Marie Mawois, as well as local institutions (cooperatives, Chamber of Agriculture, and advice organizations) for giving their time to students, and farmers who took part in the survey. We also want to thank Claire Lamine and Marianne Cerf for their contribution to this work. This research was done with the financial support of ANR Systerra—Popsy program (ANR 08-STRA 12).
References
Abadi Ghadim AK, Pannell DJ (1999) A conceptual framework of adoption of an agricultural innovation. Agric Econ 21:145–154. doi:10.1016/S0169-5150(99)00023-7
Arellanes P, Lee DR (2003) The determinants of adoption of sustain-able agriculture technologies: evidence from the hillsides of Honduras. Proceedings of the 25th International Conference of Agricultural Economists (IAAE). 16–22 August 2003, Durban, South Africa
Aubertot JN, Barbier JM, Carpentier A, Gril JJ, Guichard L, Lucas P, Savary S, Savini I, Voltz M (2005) Pesticides, agriculture and the environment. Reducing the use of pesticides and limiting their environmental impact. Summary of the Collective Scientific Expert Report INRA and Cemagref, France
Bagheri A, Shabanali Fami H, Rezvanfar A, Asadi A, Yazdani S (2008) Perceptions of paddy farmers towards sustainable agricultural technologies: case of Haraz catchments area in Mazandaran province of Iran. Am J Applied Sci 5(10):1384– 1391. doi:10.3844/ajassp.2008.1384.1391
Blazy JM, Ozier-Lafontaine H, Doré T, Thomas A, Wery J (2009) A methodological framework that accounts for farm diversity in the prototyping of crop management systems. Application to banana-based systems in Guadeloupe. Agric Syst 101:30–41. doi:10.1016/j.agsy.2009.02.004
Boussemart JP, Leleu H, Ojo O (2011) Could society’s willingness to reduce pesticide use be aligned with farmers’ economic self-interest? Ecolog Econ 70:1797–1804. doi:10.1016/j.ecolecon.2011.05.005
Bürger J, de Mol F, Gerowitt B (2012) Influence of cropping system factors on pesticide use intensity—a multivariate analysis of on-farm data in North East Germany. Eur J Agron 40:54–63. doi:10.1016/j.eja.2012.02.008
Burton M, Rigby D, Young T (1999) Analysis of the determinants of adoption of organic horticultural techniques in the UK. J Agr Econ 50(1):47–63. doi:10.1111/j.1477-9552.1999.tb00794.x
Butault JP, Dedryver CA, Gary C, Guichard L, Jacquet F, Meynard JM, Nicot P, Pitrat M, Reau R, Sauphanor B, Savini I, Volay T (2010) Écophyto R&D. Quelles voies pour réduire l’usage des pesticides ? Synthèse du rapport d’étude, INRA Editeur (France), 90 p. Carolan MS (2005) Barriers to the adoption or sustainable agriculture
on rented land: an examination of contesting social fields. Rural Sociol 70(3):387–413. doi:10.1526/0036011054831233
Cerf M, Guillot MN, Olry P (2011) Acting as a change agent in supporting sustainable agriculture: how to cope with new profes-sional situations? The J Agr Educ Ext 17(1):7–19. doi:10.1080/ 1389224X.2011.536340
Charles R, Jolliet O, Gaillard G, Pellet D (2006) Environmental anal-ysis of intensity level in wheat crop production using life cycle assessment. Agr Ecosyst Environ 113:216–225. doi:10.1016/ j.agee.2005.09.014
Chikowo R, Faloya V, Petit S, Munier-Jolain NM (2009) Integrated Weed Management systems allow reduced reliance on herbicides and long-term weed control. Agr Ecosyst Environ 132:237–242. doi:10.1016/j.agee.2009.04.009
Colbach N, Lucas P, Meynard JM (1997) Influence of wheat crop management on take-all development and infection cycles. Phytopathology 87:26–32
Comer S, Ekanem E, Muhammad S, Singh SP, Tegegne F (1999) Sustainable and conventional farmers: a comparison of socio-economic characteristics, attitude and beliefs. J Sustain Agr 15(1):29–45. doi:10.1300/J064v15n01_04
Ducos G, Dupraz P, Bonnieux F (2009) Agri-environment contract adoption under fixed and variable compliance costs. J envir Plann Mgmt 52(5):669–687
De Souza Filho HM, Young T, Burton MP (1999) Factors influencing the adoption of sustainable agricultural technologies: evidence from the State of Espı́rito Santo, Brazil. Technol Forecast Soc Change 60:97–112. doi:10.1016/S0040-1625(98)00040-7
Edwards-Jones G (2006) Modelling farmer decision-making: concepts, progress and challenges. Anim Sci 82:783–790. doi:10.1017/ ASC2006112
Eltun R, Korsæth A, Nordheim O (2002) A comparison of environ-mental, soil fertility, yield, and economical effects in six cropping systems based on an 8-year experiment in Norway. Agr Ecosyst Environ 90:155–168. doi:10.1016/S0167-8809(01)00198-0
Everitt BS, Landau S, Leese M, Stahl D (2011) Cluster analysis, 5th edn. Wiley, New York
Feder G, Just RE, Zilberman D (1985) Adoption of agricultural in-novations in developing countries: a survey. Econ Devel Cult Change 33(2):255–298
Hubbell BJ, Carlson GA (1998) Effects of insecticide attributes on within-season insecticide product and rate choices: the case of U.S. apple growers. Amer J Agr Econ 80:382–396. doi:10.2307/1244510
Jacquet F, Butault JP, Guichard L (2011) An economic analysis of the possibility of reducing pesticides in French field crops. Ecolog Econ 70:1638–1648. doi:10.1016/j.ecolecon.2011.04.003
Joffre OM, Bosma RH (2009) Typology of shrimp farming in Bac Lieu Province, Mekong Delta, using multivariate statistics. Agr Ecosyst Environ 132:153–159. doi:10.1016/j.agee.2009.03.010
Kohler U, Kreuter F (2012) Data Analysis Using Stata, 3rd edn. Stata Press, College Station
Kuhfuss L, Jacquet F, Préget R, Thoyer S (2012) Le dispositif des MAEt: une fausse bonne idée ? Revue d’Etude en Agriculture et Environnement 93(4):395–411
Lamine C, Meynard JM, Bui S, Messéan A (2010) Réductions d’intrants: des changements techniques, et après? Effets de verrouillage et voies d’évolution à l’échelle du système agri-alimentaire. Innovations Agronomiques 8:121–134
Loyce C, Meynard JM, Bouchard C, Rolland B, Lonnet P, Bataillon P, Bernicot MH, Bonnefoy M, Charrier X, Debote B, Demarquet T, Duperrier B, Félix I, Heddadj D, Leblanc O, Leleu M, Mangin P, Méausoone M, Doussinault G (2008) Interaction between cultivar and crop management effects on winter wheat diseases, lodging, and yield. Crop Prot 27:1131–1142. doi:10.1016/j.cropro.2008.02.001
Loyce C, Meynard JM, Bouchard C, Rolland B, Lonnet P, Bataillon P, Bernicot M, Bonnefoy M, Charrier X, Debote B, Demarquet T, Duperrier B, Félix I, Heddadj D, Leblanc O, Leleu M, Mangin P, Méausoone M, Doussinault G (2012) Growing winter wheat cultivars
under different management intensities in France: a multicriteria assessment based on economic, energetic and environmental indica-tors. Field Crops Res 125:167–178. doi:10.1016/j.fcr.2011.08.007
Marra M, Pannell DJ, Abadi Ghadim A (2003) The economics of risk, uncertainty and learning in the adoption of new agricultural tech-nologies: where are we on the learning curve? Agric Sys 75:215– 234. doi:10.1016/S0308-521X(02)00066-5
Meynard JM, Girardin P (1991) Produire autrement. Courrier de la Cellule Environnement INRA 15:1–19
Pingault N, Pleyber E, Champeaux C, Guichard L, Omon B (2009) Produits phytosanitaires et protection intégrée des cultures: l’indicateur de fréquence de traitement (IFT). Agreste - Notes et études socio-économiques 32:61–94
Région Centre (2010) Document régional de développement rural (DRDR). Programme de développement rural 2007–2013. Version 4, p 345
Rivaud A, Mathé J (2011) Les enjeux cognitifs du défi environnemental dans les exploitations agricoles. Econ Rurale 323:21–35
Tatlidil FF, Boz I, Tatlidil H (2009) Farmers’ perception of sustainable agriculture and its determinants: a case study in Kahramanmaras province of Turkey. Environ Dev Sustain 11(6):1091–1106. doi:10.1111/j.1574-0864.2005.00305.x
Vereijken P (1989) From integrated control to integrated farming, an experimental approach. Agr Ecosyst Environ 26:37–43. doi:10.1016/0167-8809(89)90036-4