An Analytical and Experimental Study of Mechanisms Critical
to the Failure of Notched Graphite/Epoxy Laminates
by
Richard Andr6 Kroes
S.B., Massachusetts Institute of Technology (1992)
Submitted to the Department of Aeronautics and Astronautics in Partial Fulfillment of the Requirements for the Degree of
Master of Science
at the
Massachusetts Institute of Technology
February 1994
© 1994 Massachusetts Institute of Technology All rights reserved
Signature of Author
Certified by
Accepted by
Department of Aeronautics and Astronautics January 14, 1994
Professoi Hugh L. McManus
/
n/',, / / Thesis Supervisor. rofessor Harold Y. Wachman Chairman, Departmental Graduate Committee
MASSACHUSETTS INSTITUTE
FEB 17
1994
An Analytical and Experimental Study of Mechanisms Critical
to the Failure of Notched Graphite/Epoxy Laminate
by
Richard Andr6 Kroes
Submitted to the Department of Aeronautics and Astronautics on January 14, 1994 in partial fulfillment of the requirements for the
degree of Master of Science
ABSTRACT
Experimental results and a numerical study were used to investigate the mechanisms critical to the failure of notched graphite/epoxy laminates. Experimental results from the Boeing/NASA ATCAS program were reviewed and reduced to give insight into the growth of damage from the tips of notches in tensile specimens. A finite element model was constructed to model the specimens, and a damaged based modeling approach used to investigate the effects of this damage. Properties of the elements in a region at the notch tips were altered to simulate damage. Matrix failure and fiber failure were modeled by reducing the material properties in these elements. Delaminations were modeled using a
2-D stacked membrane approach. The damage types were impregnated into the finite
element model individually and in various combinations, and the changes in the stress and strain distributions in the model examined. Most calculations were linear. A geometrically non-linear model was used to examine buckling observed above and below the notch in large specimens. The experimental results confirmed the importance of the role of progressive damage growing from the notch tip in the failure of the laminate. Such damage can actually increase the strength of the laminate by relieving the stress concentration at the notch tip. The numerical results showed that modeled matrix failure and delaminations had very small effects individually, but significant effects when combined. Fiber failure had a large effect. Only models incorporating severe damage, including delaminations, matrix cracking, and substantial fiber failure, could correlate to the large changes in strain distribution observed to accompany damage in the test specimens. The non-linear analyses replicated the observed buckling above and below the notch. It was found to have a major effect on the stresses near the notch tip. This study shows that it is possible to model the effects of damage on the stress field in a notched composite laminate; that such models are sensitive to modeling details such as interactions of damage types; that the damage observed during tests is severe; and that buckling near the notch tip can have profound effects.
Thesis Supervisor: Professor Hugh L. McManus
Title: Boeing Assistant Professor, Department of
Aeronautics and Astronautics, Massachusetts Institute of Technology
ACKNOWLEDGMENTS
I would like to thank Professor Hugh McManus for his invaluable guidance during my quest to produce this thesis. His genuine interest in the research that is ongoing around him and those that are involved with it has left a great impression on me. It was great getting to know him as my advisor and as a friend.
I would sincerely like to thank Dr. Narendra Bhat and (soon to be Dr.) Wilson Tsang for their help and support. They are two of the nicest and most considerate people that I have ever met. I am also indebted to Hari Budiman, who shared with me his great understanding of finite element coding, especially in the early phases of this work. Finally, I would like to thank Cecelia, Brian, Tracy, and everybody else who has helped me to stay sane during this experience. I wish everybody the best of luck in the future.
FOREWORD
This research was completed at the Technology Laboratory for Advanced Composites at the Massachusetts Institute of Technology. The work was partially funded by a Richard C. DuPont Research Fellowship, The Boeing Company (Purchase Order Number FX-282568-0755N), and National Science Foundation Young Investigator Award (Agreement 9257612-MSS).
TABLE OF CONTENTS
ACKNOWLEDGEMENTS ... 5 FO REW O RD ... 6 LIST OF FIGURES ... 10 LIST O F TABLES ... ... 14 N OM EN CLATURE ... 15 1. INTRODUCTION ... 18 2. BACKGROUND ... 22 2.1 Experimental Work ... 222.2 Failure Predictions of Unnotched Composite Laminates ... 23
2.3 Failure Predictions of Notched Composite Laminates ... 25
2.4 Post-Failure Behavior of Composite Laminates ... 28
2.5 Progressive Damage Modeling ... ... 29
2.6 Damage Based Modeling ... ... 30
2.7 Tensile Buckling ... 31
3. A PPR O A CH ... ... 35
4. ATCAS EXPERIMENTAL PROGRAM ... 37
4.1 M anufacturing... ... 37
4.2 Testing Procedure ... 39
4.3 Application to the Current Study... ... 42
5. FINITE ELEMENT MODELING ... ... 48
5.1 Finite Element Analysis ... ... 48
5.2 M odeling ... ... 50
5.2.1 General Mesh... 51
5.2.2 M acrodam age ... 54
5.2.3 Microdamage... 54
5.2.4 Delaminations ... ... 57
5.3 Scheme of Finite Element Calculations... 61
5.3.1 Linear Analysis ... ... 61
5.3.2 Nonlinear Analysis ... ... 63
6. RESULTS AND DISCUSSION ... ... 65
6.1 Experimental Results... 65
6.1.1 Damage Detection ... ... 66
6.1.2 Tensile Buckling ... ... 71
6.1.3 Numerical Analysis of Data ... 78
6.2 Results of the Linear Finite Element Analyses ... 80
6.2.1 Verification of the Undamaged Model... 80
6.2.2 Damage Impregnation... ... 83
6.3 Correlation of Experimental Results to Linear Finite Element D ata ... 87
6.3.1 M acrocracking ... ... ... 88
6.3.2 Transverse Softening ... ... 88
6.3.3 Longitudinal Softening ... ... 91
6.3.4 Effect of Delam ination ... 91
6.3.5 Delamination and Softening ... 93
6.3.6 Delamination Area Study ... 96
6.3.7 Correlations of the Strains Ahead of the Notch ... 100
6.4 Tensile Buckling Analysis ... 105
7. CONCLUSIONS AND RECOMMENDATIONS ... 115
7.1 Conclusions ... 115
7.2 Recommendations ... 117
R E F E R E N C E S ... ... 119
APPENDIX A: Examples STAGS Input Files ... 125
I. Example of STAGS model input file ... 125
II. Examples of STAGS analysis input files... 130
A. Linear Analysis: ... 130
B. Nonlinear Analysis: ... ... 130
APPENDIX B: Experimental Data from the ATCAS Program ... 132
APPENDIX C: Correlations of the Analytical Data to the Experimental Results ... ... 175
LIST OF FIGURES
Figure 2.1 Figure 2.2 Figure 4.1 Figure 4.2 Figure 4.3 Figure 4.4 Figure 5.1 Figure 5.2 Figure 5.3 Figure 5.4 Figure 6.1 Figure 6.2 Figure 6.3 Figure 6.4 Figure 6.5Geometry of a 1520 mm by 3810 mm test specimen. ... 24 Geometry and coordinate system for the stress field solution
around a hole in an infinite orthotropic plate under uniaxial
tension ... 32 Far field strain gage locations and their numbering on 1520 mm by 3810 mm test specimens (not to scale). ... 40 Notch region strain gage locations and their numbering on 1520 mm by 3810 mm test specimens (not to scale) ... 41 Diagram illustrating the shadowing of a gage located directly
above the notch tip due to a damage region (case 1) or crack
growth (case 2). ... ... ... ... 43 The region of the test specimens observed with moire
interferometry. ... 44 STAGS 410 quadrilateral plate element ... 49 The finite element mesh modeling the 1520 mm by 3810 mm
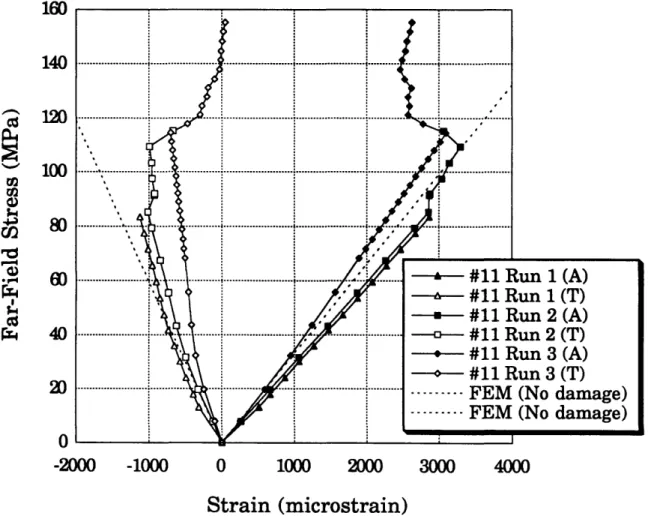
specim ens ... 52 Diagrams illustrating matrix cracking and splitting in composite laminates subjected to tensile loading. ... . 55 The stacked membrane model (not to scale)... 58 Strain readings of gage #11 of the Crown3-Hoop panel versus
the far-field stress during the three loading cycles. ... 67 Gages #S12 and #S13 of the Crown3-Hoop panel showing the
effect of a strain release mechanism. ... 68 Damage detected by pulse-echo inspection (a) prior to testing
and (b) after the loading to 75% of the predicted failure load (not to scale). ... 70 The damage growth observed by the failure of the strip gages
#S1-10 during the second and third loading cycles of the
Crown3-Hoop panels. ... ... ... 72 The damage growth observed by the failure of the strip gages
#S11-20 during the second and third loading cycles of the
Figure 6.6 Figure 6.7 Figure 6.8 Figure 6.9 Figure 6.10 Figure 6.11 Figure 6.12 Figure 6.13 Figure 6.14 Figure 6.15 Figure 6.16 Figure 6.17 Figure 6.18
The damage growth observed by the failure of the strip gages #S1-10 during the second and third loading cycles of the
Crown4-Axial panels ... ... ... 74 The damage growth observed by the failure of the strip gages
#S11-20 during the second and third loading cycles of the
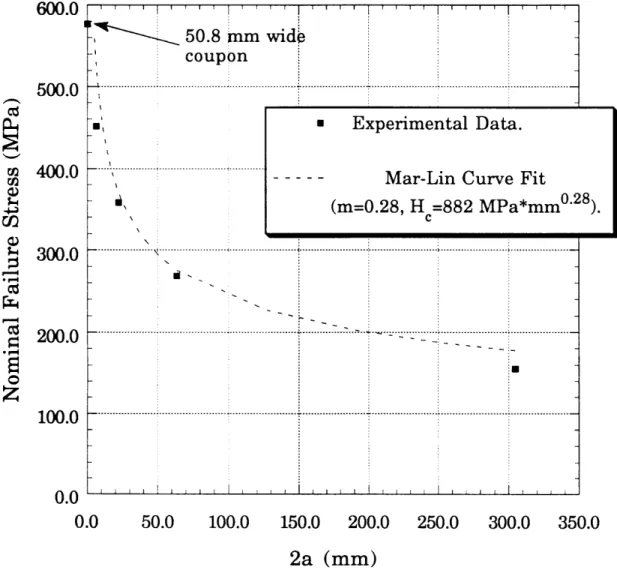
Crown4-Axial panels ... ... 75 Digitized output of the moir6 out-of-plane interferometry for the Crown3-Hoop 1520 mm by 3810 mm panel under a loading of 68.1 MPa, where the maximum out-of-plane displacement is 5.59 m m . ... 76 Strain gage plot of gages #25 and #26 on the large Crown3-Hoop panel showing tensile buckling. ... ... 77 A comparison of the axial strain distribution ahead of the notch as measured by the strip gages at the end of first loading cycle to the Sih-Paris-Irwin calculations ... ... 79 Mar-Lin Curve fit for the Crown3-Hoop 1520 mm by 3810 mm pan el ... ... .... 81 Mar-Lin Curve fit for the Crown4-Axial 1520 mm by 3810 mm pan el... 82 Strain gage readings of gage #1 (far-field) during the loading of the Crown3-Hoop panel compared to the corresponding finite
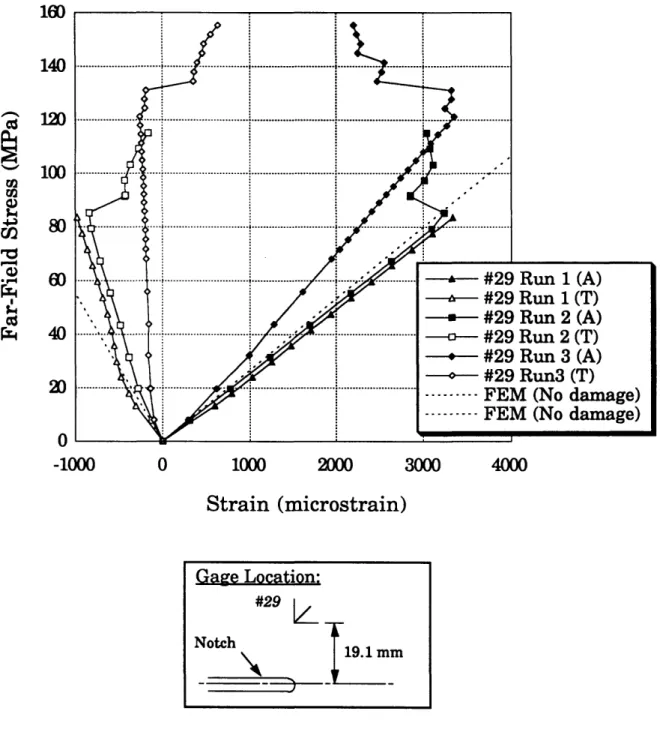
element calculations. ... ... 84 Strain readings of gage #29 during the loading of the
Crown3-Hoop panel compared to the corresponding finite element
calculations ... ... 85 The effect of a macrocrack on the local strain relative to the far-field stress at the gage #29 location of the Crown3-Hoop panel... 89 The effect of transverse softening on the local strain relative to the far-field stress at the gage #29 location of the Crown3-Hoop panel ... 90 The effect of transverse and longitudinal softening on the local strain relative to the far-field stress at the gage #29 location of the Crown3-Hoop panel. ... ... 92 The effect of delaminations on the local strain relative to the far-field stress at the gage #29 location of the Crown3-Hoop panel... 94
Figure 6.19 Figure 6.20 Figure 6.21 Figure 6.22 Figure 6.23 Figure 6.24 Figure 6.25 Figure 6.26 Figure 6.27 Figure 6.28
The effect of multiple damage types on the local strain relative to the far-field stress at the gage #29 location of the
Crown3-Hoop panel. ... 95 Deformation of the elements in the stacked membrane region of
a loaded Crown3-Hoop model with delaminations at the 0/90
interfaces and 99% transverse softening (not to scale). ... 97 Deformation of the elements in the stacked membrane region
(with the crack tip nodes unconstrained) of a loaded Crown3-Hoop model with delaminations at the 0/90 interfaces and 99% transverse softening (not to scale) ... . 98 The effect of not constraining the crack tip nodes (indicated as "Free") for two delaminated interfaces on the local strain relative to the far-field stress at the gage #29 location of the
Crown3-H oop panel ... 99 The effect of not constraining the crack tip nodes (indicated as "Free") for multiple damage types on the local strain relative to the far-field stress at the gage #29 location of the Crown3-Hoop pan el ... 101 The effect of not constraining the crack tip nodes (indicated as "Free") for multiple damage types on the local strain relative to the far-field stress at the gage #29 location of the Crown3-Hoop pan el ... 102 Axial strain readings of the strip gages #S1-10 ahead of the
notch after the first and second loading cycles of the
Crown3-Hoop panel ... 103 Axial strain readings of the strip gages #S11-20 ahead of the
notch after the first and second loading cycles of the
Crown3-Hoop panel. ... 104 The tensile buckling mode of the restrained Crown3-Hoop model under tension (not to scale)... 106 Out-of-plane displacement of the center of the notched region
obtained from nonlinear finite element calculations and the
Figure 6.29
Figure 6.30
Figure 6.31
Figure 6.32
Figure 6.33
Comparison of the experimental transverse strain readings of gages #25 and #26 during the first loading of the Crown3-Hoop panel with the corresponding linear and nonlinear finite element
calculations ... 109 Comparison of the experimental data of gage #19 during the
first loading of the Crown3-Hoop panel with the corresponding linear and nonlinear finite element calculations ... 110 A comparison of the axial strain distribution ahead of the notch
as measured by the strip gages at the end of first loading cycle to the Sih-Paris-Irwin calculations with and without the
assumption of zero transverse stress ahead of the notch due to tensile buckling. ... 112 Comparison of the linear and nonlinear strain calculations on
both sides of the Crown3-Hoop laminate at the #S2 gage
location, showing the effects of tensile buckling on this region.... 113 Comparison of the linear and nonlinear strain calculations on
both sides of the Crown3-Hoop laminate at the #S8 gage
LIST OF TABLES
Table 4.1 Experimental test matrix of the tension fracture investigation
done as part of the ATCAS program. ... 38 Table 4.2 The subset of the test matrix of the experiments conducted by
ATCAS selected for this investigation. ... . 45 Table 4.3 Summary of the material properties of AS4/938 in ply
coordinates ... 46 Table 5.1 Summary of the material properties of AS4/3501-6 in ply
coordinates ... 60 Table 5.2 Finite element analyses performed. ... 62
NOMENCLATURE
a ac ao Aii BUD.
ExEx
E Yy
He
k K K 1Kc
mM
n N.1 qiQi
Half-crack lengthCritical characteristic length Characteristic length
Component of laminate extensional stiffness matrix
Component of laminate extensional-bending coupling stiffness matrix
Component of laminate bending stiffness matrix Longitudinal modulus
Reduced longitudinal modulus Transverse modulus
Reduced transverse modulus Shear modulus
Composite fracture toughness parameter Number of plies in a laminate
Parameter in Lekhnitskii solution for stress around a hole Components of the finite element stiffness matrix
Fracture toughness parameter
Parameter in Lekhnitskii solution for stress around a hole Notch tip stress singularity parameter
In-plane moments
Parameter in Lekhnitskii solution for stress around a hole In-plane forces
Nodal displacements Nodal forces
S Interlaminar shear strength tk Ply thickness of kth ply
ZC Interlaminar compressive strength
Zt Interlaminar tensile strength a; Far-field applied stress
eij Component of the strain tensor
i7 Radial coordinate
Kf Material property knock-down factor in fiber direction ri. Curvatures
rm Material property knock-down factor for matrix
Ok Ply angle of kth ply
af Failure stress
ai Component of the stress tensor ao Unnotched failure stress
a 4 Tangential stress
vxy Poisson's ratio
Vyx Transverse Poisson's ratio
vyx Reduced transverse Poisson's ratio
Chapter 1
INTRODUCTION
Advanced composite materials, generally consisting of fibers embedded in a matrix system, potentially offer significantly higher strength-to-weight ratios than traditional engineering materials. Hence, continued increases in the use of composite materials, including applications to primary structures, is desired. In order to do this, however, a greater understanding of composite materials is needed for purposes of design and certification. Many complex issues of composite material behavior are not yet well understood, especially those involving failure mechanisms.
Significant research has been done to investigate how and when composite material systems fail. The inhomogeneous makeup of composite laminates, which gives them their increased performance, also causes their behavior during loading to be very complex. Many investigations have been done to address this issue but, to date, no reliable method exists to predict the behavior of an arbitrary laminate under arbitrary loading.
The major problem is the prediction of failure. Failure criteria have been proposed to predict the strength of laminates based on the strength at a point in an infinite, undamaged region. However, in order to predict the strength of realistic structures, the implications of structural damage on the system must be considered. This damage can present itself in different forms depending upon the operational use of the component. The current engineering philosophy employed in designing with composite materials is that of damage tolerance. This approach seeks to identify the ability of a structure to perform with the presence of realistic damage that could be incurred during the component's use.
Therefore, much experimental work has been done with specimens that have notches, holes, or other structural imperfections characteristic of expected damage.
Several different techniques have been used in analyzing composite laminate systems based on these experiments. Due to the complexity of analyzing the fracture behavior of these materials, these analyses are usually based on simplified semi-empirical models. The models presented by Whitney and Nuismer and by Mar and Lin are among the more widely recognized.
Material damage is an important consideration in analyzing composite material strength. This damage can be classified into three main categories: fiber breakage; matrix cracking; and delaminations. Damage can be induced by a variety of causes, including stress concentrations due to geometric discontinuities, manufacturing defects, or strikes by foreign objects during service. An added complication is that damage is often present below the surface of the laminate and not easily detectable.
The aforementioned semi-empirical models do not yield information on the nature of the growth of the different forms of material damage prior to catastrophic failure. It is known that these forms of damage do have a significant effect on the material integrity. Many complex phenomena, such as crack blunting, have been observed experimentally prior to final failure.
These observations show the need for a more progressive analysis of the failure process of composite laminates. Several researchers have been taking advantage of the recent increase in available computing power by performing finite element model analyses incorporating progressive failure. The progressive damage models investigate the effects of incrementally increasing applied loads on a specimen while enforcing failure criteria and modifying stiffness matrices based on the prediction of any such failure.
Even though great advances have been made in progressive damage modeling, it is still extremely difficult to derive an all-encompassing, complete model. The interaction of the failure criteria for the different failure modes becomes very complicated. Furthermore, delamination has as of yet not been incorporated into these progressive models.
A somewhat more recent approach to investigating failure mechanisms in composite laminates is damage based modeling. With the aide of finite element modeling, this methodology attempts to explain the phenomena observed experimentally by impregnating the model with known or suspected imperfections. This approach seeks to incorporate all the damage known or strongly suspected to be present, including delaminations, to arrive at more complete understanding of the failure of composite laminates.
The primary goal of this investigation is the implementation of damage based modeling to establish what failure mechanisms are critical to the observed behavior of several experimental specimens. The experimental work considered here is taken from the tension failure fracture studies that have been performed as part of the Advanced Technology Composite Aircraft Structure (ATCAS) program which is ongoing at the Boeing Company. A subset of unnotched and notched specimens selected from almost 200 tests is used in the current study. Notches are located centrally and oriented transversely to the loading direction. The specimens to which the aforementioned methodology is applied were each tested in three loading cycles. The first two cycles loaded the specimens to 50% and 75% of their predicted failure load, respectively. The final cycle loaded the specimens until they fail catastrophically. A Non-Destructive Inspection (NDI) was performed before each cycle to investigate the presence of damage. This allowed for the progressive monitoring of any damage that formed during the loading of the specimens.
The STAGS (STructural Analysis of General Shells) software is used to construct a finite model so that these analytical calculations may be compared to the results obtained experimentally. The damage types that are considered are fiber failure, matrix cracking and delamination. Each is modeled so that it may be incorporated into the finite element model. A parametric study is performed
to determine the specific consequences of each damage type on the structural integrity of each specimen. Subsequently, combinations of damage types are introduced into the finite element model. The extent and types of damage that
are introduced at this stage are guided by the results of the experimental NDI evaluations.
A phenomenon somewhat more specific to the large specimens under consideration in this study is tensile buckling. This occurrence, buckling of the region above and below the notch perpendicular to the loading direction, is also considered in this investigation. Non-linear finite element studies are performed
to correlate the predicted buckling load and out-of-plane displacement of this region to the experimentally obtained results. The consequences of this buckling and its effect on the stress distribution near the notch are also explored.
A review of the work that has been done on the issues central to this study is presented in Chapter 2. The approach taken in this investigation to analyze the failure behavior of composite laminates is presented in Chapter 3. Chapter 4 outlines the experimental studies which were undertaken at Boeing, and presents reduced relevant data. Chapter 5 presents the finite element analyses that were performed. The results are presented in Chapter 6. The first section of this chapter details the pertinent results of the experimental work that was done. The following sections detail the finite element analysis results, correlate these to the experimental findings, and offer a discussion of the results. Finally, Chapter 7 presents conclusions and recommendations.
Chapter 2
BACKGROUND
The process of failure in advanced composite laminates is inherently very complicated due to the inhomogeneous nature of the material. With traditional engineering materials, one defect usually accounts for final failure. However, with composite materials numerous flaws can contribute to eventual final failure. These forms of damage include fiber breakage, matrix cracking, and delaminations. Furthermore, failure in any one layer does not necessarily imply the failure of the entire laminate. In the past several decades, extensive research has been done to understand and model the failure phenomena that ultimately result in gross failure. A history of the development of these studies is given in this chapter.
2.1 Experimental Work
Much experimental work has been done over the past several decades to establish a comprehensive database to help solve the technical challenges associated with designing composite structures. Many studies, for example [1-4], have been done to investigate the factors affecting notch sensitivity, such as stacking sequence and laminate configuration. With the adoption of a damage tolerance engineering design philosophy, the experimental aspect of composite research has taken on extra significance. Damage tolerance refers to the ability of a structure to perform with the presence of realistic damage that could be incurred during a component's use. Confidence in such structures can only be achieved by conducting experiments.
Experimental work done as part of the Boeing/NASA Advanced
Technology Composite Aircraft Structure (ATCAS) program was selected for the purpose of the current study. This program has been investigating manufacturing and performance issues associated with composite wide body commercial transport fuselages. As stated, the objective of this program is to "develop an integrated technology and demonstrate a confidence level that permits the cost and weight-effective use of advanced composite materials in transport fuselage structures of future aircraft" [5]. As a part of this program, tension failure tests were conducted on almost 200 unnotched and centrally notched specimens to evaluate the tension fracture performance of candidate materials and layups for commercial fuselage applications [6, 7]. The geometry of one of the test specimens is depicted in Figure 2.1. Several of the specimens were loaded using three loading/unloading cycles. The first two cycles loaded the specimens to 50% and 75%, respectively, of their predicted failure loads. The third and final cycle loaded the specimen until it failed catastrophically. The specimens were monitored for damage growth by pulse echo inspection before and after each loading cycle. Those specimens that were not loaded in these steps were loaded monotonically until failure. The bulk of the testing was performed under contract by Integrated Technologies, Inc.
2.2 Failure Predictions of Unnotched Composite Laminates
Traditional engineering design of a structure requires knowledge of the strength of candidate. The idea of a failure theory was introduced to quantify the strength of a composite laminate at a point in an unnotched infinite plate. Nahas [81 reviews these concepts thoroughly. The two most basic types of criteria are grouped into the limit failure theories and interaction theories.
The limit theories simply assume failure occurs when an experimentally determined limit of a stress or strain value in a given direction is exceeded. As
305 mm
S--x
y z
1520 mm
Figure 2.1 Geometry of a 1520 mm by 3810 mm test specimen. 24
may be deduced from the name given to the next category, the interaction failure theories account for the interactions between stresses not accounted for by the limit theories. Interaction theories typically involve the summation of normalized quadratic terms of the relevant strength parameters. The onset of failure results when these combine to exceed a critical value. Unlike the limit criteria, the mode of failure is not predicted in these cases. Both the aforementioned are generally applied on a ply by ply basis. The simplest definition of strength is the load at which the first ply fails.
2.3 Failure Predictions of Notched Composite Laminates
Many attempts have been made at understanding when and how composite material systems containing artificially induced notches fail. An excellent review of this work is presented by Awerbuch and Madhukar [9]. In postulating the failure behavior of composites, several analytical tools have been proposed. Due to the complexity of the problem, these techniques range from simplified semi-empirical fracture models to comprehensive numerical methods.
Even though composite materials are markedly different from metals, a logical starting point for predicting their failure behavior is to consider Linear Elastic Fracture Mechanics (LEFM). LEFM has been applied to traditional
engineering materials with some success, and is based on
K, = af (2.1)
where K, is the fracture toughness parameter, a is the half crack length, and af
is the failure stress. K,, is a material property which is determined
experimentally. Hence, if the material properties and the geometry of a specimen are known, the failure stress can be derived.
Waddoups, Eisenmann, and Kaminski [10]. To overcome the difficulty in determining the precise stress distribution beyond the crack tip, they proposed the idea of an intense energy region ahead of the crack. This region is defined by a small but finite characteristic length, a,. The energy for crack extension is assumed to be stored in this region. The following equation was assumed to be satisfied at failure for a notched specimen
K,c = af (a + ac) (2.2)
where a refers to the half crack length and ac is the critical value of ao at failure. Like K1c, ac is considered as being a material parameter. For the case of an
unnotched specimen,
K, = -ra (2.3)
ao denotes the strength of the unnotched specimen. Equations (2.2) and (2.3)
can subsequently be combined to arrive at
S = a c (2.4)
aC a+a
It is evident that this model has two parameters, namely the critical characteristic length, ac, and the unnotched strength, ao, both to be determined
experimentally.
Mar and Lin [11, 12] returned to classical LEFM and attempted to modify it significantly enough to incorporate the inhomogeneous nature of composite laminates. They postulated that the failure of composite laminates is dictated by
af = Hc(2a)-" (2.5)
where H, is the composite fracture toughness parameter and the exponent m is the order of notch tip singularity. Both H, and m are considered as material properties. Whereas H, is determined experimentally, m is derived analytically.
This is done by performing a stress analysis of a crack at a fiber-matrix interface. Fenner [13] did this analysis for a graphite/epoxy material system and found m to be 0.28.
Like Waddoups, Eisenmann, and Kaminski, Whitney and Nuismer [14] used the idea of a characteristic length ahead of the crack tip. However, the principles of classical LEFM were not applied. They instead proposed two stress criteria for predicting notched strength. The two criteria are termed the point-stress criterion and the average-stress criterion. The former assumes that failure occurs when the normal stress, a, at some characteristic distance a, ahead of the crack, exceeds the strength of the unnotched laminate. The latter refers to the prediction of failure when the average of a. over some distance ahead of the notch, ao, exceeds the unnotched laminate strength. Mathematically speaking,
point-stress criterion: a.(a + a,0) = ao (2.6a)
a+a (2.6b)
average-stress criterion: a a (Oy) = (2.6b)
where a is again the half crack length, and a, is a material property. These criteria are then applied to Lekhnitskii's solution for an elliptical notch in an infinite orthotropic plate. Other researchers, including Karlak [15] and Pipes, Wetherhold, and Gillespie [16], have used a similar approach as the basis of their work.
Once the characteristic material properties are properly determined, the aforementioned notched strength theories exhibit a good agreement with experimental data for each laminate configuration, as reported by Awerbuch and Madhukar. However, this is to be expected since these methods for predicting failure are basically an exercise in parameter curve fitting. The effects of such
variables as stacking sequence on notched composite strength are circumnavigated by requiring the determination of parameters for each new stacking sequence. So, even though these models may serve as engineering approximations useful for specific materials and stacking sequences, a more comprehensive approach is needed to assure greater accuracy and reliability of strength predictions.
2.4 Post-Failure Behavior of Composite Laminates
Significant research efforts have been focused on trying to understand the nonlinear failure characteristics of laminated composite materials. Instead of taking a total laminate approach, the laminate is considered to consist of bonded layers. The failure of the first layer is predicted with the aid of a failure criterion. Post-failure behavior refers to the behavior of the laminate after the first ply failure.
Hahn and Tsai [17] studied this post-failure behavior. They investigated the bilinear behavior of a cross-ply laminate ([0/90]s ) under monotonically
increasing uniaxial tension. It was demonstrated that the observed bilinear behavior was due to the gradual failure of the 900 plies. Their method assumes that the layer continues to carry the level of stress it had when it failed until the entire laminate fails. Chou, Orringer, and Rainey [18] postulated that the failed layers unload instantaneously as opposed to gradually.
The development and accumulation of cracks in the transverse direction has also been the subject of much research [19-23]. A good review of this work is provided by Nairn [24]. Although these cracks do not cause catastrophic failure, they do cause adverse effects, including stiffness reductions, and are in effect local stress raisers. Various models have been presented to describe this problem. Most of the simple analyses are based on some form of the shear lag
model, as presented by Highsmith and Reifsnider [19]. They predicted laminate stiffness reduction using a shear lag analysis, which modeled the transfer of stress past a matrix crack. It was also shown by McManus et al. [25] that for most laminates the presence of matrix cracks has a much greater effect on their coefficient of thermal expansion than on their structural stiffness.
It has also been shown that damage need not always be detrimental to the structural properties of a laminate. It was shown by Lagace [26] that in notched laminates the presence of microdamage ahead of the notch tip can result in an increase in residual strength of the laminates. This is analogous to the effect of plasticity observed in metals, namely the release of energy due to the deformation of the material ahead of a notch.
2.5 Progressive Damage Modeling
The advances made in the computer industry have allowed for more complex progressive numerical analyses with the aid of finite element codes. The approach taken with these analyses is to identify, incrementally, the damage that occurs in the laminate and then modify the stiffnesses of the material in the damaged region accordingly.
Chang et al. [27-30] have implemented this methodology for notched specimens under both tensile and compressive loading. The analysis was able to provide information on the types of damage, the extent of the damage, the residual strength, and the failure load of several laminate configurations. Matrix cracking and fiber failure are both predicted with the use of failure criteria. Matrix cracking in a layer is subsequently accounted for by setting the transverse modulus and Poisson's ratio equal to zero. When fiber breakage is predicted, the reduction of the stiffness matrix depends on the damage area. It is postulated that for this case the transverse modulus and Poisson's ratio are
again set to zero. In addition, the longitudinal modulus and shear modulus are reduced according to a Weibull distribution [27]. The analysis does not, however, incorporate delaminations. This is a significant omission that has to be overcome as delaminations play an integral role in the failure process.
2.6 Damage Based Modeling
Whereas progressive damage modeling seeks to predict local failure and subsequently modify the material properties of failed regions, damage based modeling impregnates a model with a known or suspected form of damage to observe its consequences. This alternative way of investigating damage was used by Kortschot and Beaumont [31-33]. In these studies, radiography was used to monitor the development of damage in double-edged-notched [9 0j/0j]ns
specimens under tension. Delaminations and longitudinal splits were found to be consistently present in similar geometric configurations. Furthermore,
although the load was increased monotonically, the strain just ahead of the notch tip dropped substantially after the initial formation of the splits. This was a direct measurement of effective notch blunting resulting from splitting.
Subsequently, a finite element model was constructed to model the experimental work. Two layers of elements were superimposed to model the damage two-dimensionally, one layer having the properties of a 00 ply and the other those of a 900 ply. This approach is also utilized by Cairns [34] to simulate splits and delaminations. This technique, referred to by Cairns as a "stacked membrane model", allows the investigator to insert a split by decoupling the nodes of the 00 layer in a line extending longitudinally from the notch tip. The delaminated region can be modeled by decoupling the nodes through the thickness (i.e., between the layers). Hence, the delaminated layers are no longer bonded together and can deform independently.
Cairns investigated the effects of splits and delaminations on a [745 / 90/ ±30 / laminate with a central notch loaded in tension. A finite element model was constructed which included a damage region ahead of the model consisting of stacked membrane layers. Delamination was modeled by decoupling all the layers through the thickness. The splits were modeled by decoupling the nodes in a direction perpendicular to the notch tip of any 00 plies. It was shown that delaminations and splits each have a beneficial influence on stresses at the notch tip due to the stress release mechanisms that these damage types provide. It was also found that the combined effects of these damage types vastly exceeded the individual effects of either one alone.
2.7 Tensile Buckling
A phenomenon specific to this study is tensile buckling. For thin plates with lengths and widths much greater than their thicknesses, buckling of the material above and below a centrally located transverse notch may occur as the applied tensile load is increased. This has been observed in isotropic materials and has been termed tensile buckling. It can be easily demonstrated by making a central slit in a sheet of paper and pulling on both ends in a direction perpendicular to the slit. As the ends are pulled apart, the regions above and below the slit bulge.
The reason for the occurrence of tensile buckling is the compressive stress that is present in this region. This can be illustrated by looking at Lekhnitskii's solution for the stress field around a hole in an infinite orthotropic plate under uniform tension. Figure 2.2 shows the geometry of the problem and the corresponding coordinate system. The tangential stress at the edge of the hole normalized by the far-field applied stress is governed by [35]
a0
x Ti
2a
Figure 2.2 Geometry and coordinate system for the stress field solution around a hole in an infinite orthotropic plate under uniaxial tension.
.. = -Kcos2 4 +(1+n)sin2 4 (2.7) ao sin4 - Isin2 Cos2 4 + K cos4
where
K= ; l=2v y x-; n= -I (2.8)
Ex , Ey, and Gxy represent the longitudinal, transverse, and shear moduli,
respectively, and vxy is the corresponding Poisson's ratio. Therefore, on the top and bottom edges of the hole (where (=O or x) the normalized tangential stress is
ag_ 1 _ (2.9)
o K Ex
This ratio is always negative, hence there is a compressive stress state above and below a hole in an infinite plate under tension. The formulation for the stress state around an ellipse whose minor axis is aligned with the loading direction was also developed by Lekhnitskii. This derivation is much more involved, but the end result for the stress at the end of the minor axis has the same general form. In an extreme case, the stress field around an ellipse can be likened to that around a notch by taking an ellipse whose major axis is much greater than its minor axis. This shows that the regions above and below the notch are subjected to compressive forces.
Intuitively, it would seem that this phenomena would increase the crack growth and reduce the overall residual strength of the plate. Indeed, several investigations have found this to be the case with metals. Dixon and Strannigan [36] conducted photoelastic studies of aluminum alloy specimens. They compared the stresses at the tip of a unrestrained specimen to those of a specimen restrained by anti-buckling guides. It was found that the maximum stress at the tip of a slit in an unrestrained specimen was about 30% greater
than that when the anti-buckling guides were utilized. Reductions in residual strength were reported by Walker [37] and Trotman [38] to be about 10%. Forman [39] found reductions of up to 40%. It was also shown by Cricklow and Wells [40] that the crack growth rate in titanium panels was ten times faster than when buckling was restrained. Even though these numbers are largely dependent on the material and the geometry of the specimens, the general trend is evident and significant.
Chapter 3
APPROACH
The primary goal of this investigation is to determine the mechanisms critical to the damage tolerance of composite structures. This goal is pursued by damage based modeling.
Damage tolerance of composite structures is traditionally assessed by testing the strength of notched laminates. We first produce a finite element model of a typical notched specimen. We then simulate various mechanisms by which stress at the notch tip can be relieved by imbedding simulated damage in the laminate near the notch tip. The effects on the stress and strain distributions are noted. Matrix cracking, delamination, and fiber failure damage types are investigated independently and in various combinations.
The results are correlated with experimental results from the Boeing/NASA Advanced Technology Composite Aircraft Structure (ATCAS) program. Data from the initial loading of undamaged panels are used to confirm the validity of the finite element model without imbedded damage. Data from panels loaded until partially damaged are used to define the regions in which damage is imbedded in the models. Data from subsequent loading of the same panels to failure are used to correlate the stress-strain behavior of the models with imbedded damage.
The effect of tensile buckling is also investigated. Moire interferometry techniques used to monitor the region around the notch during testing show considerable out-of-plane displacement. Nonlinear finite element analysis is used to predict the buckling load for one of the large panels and match the corresponding out-of-plane displacements with the experimental results.
The results of these studies are discussed as follows. Correlation of the
simulation results with test data clarifies the actual mechanisms behind the observed damage in the test specimens. The parametric analysis of the effects of different types of damage on the strain field near the notches sheds light on the roles of the different damage types in the progressive failure of the specimens. It also provides information on the relative desirability of different types of material damage as promoters of structural damage tolerance. Examination of the nonlinear finite element results clarifies the effects of tensile buckling, especially on the critical stresses at the notch tip.
Chapter 4
ATCAS EXPERIMENTAL PROGRAM
A subset of the experimental work done as a part of Boeing/NASA Advanced Technology Composite Aircraft Structure (ATCAS) was selected for the current study. The goal of the ATCAS program is the investigation of the manufacturing and performance issues associated with composite wide body commercial transport fuselages. As part of this program, tension failure tests were conducted on almost 200 unnotched and centrally notched specimens to evaluate the tension performance of candidate materials and layups for commercial fuselage applications. A complete table of the experimental test matrix is presented in Table 4.1. As is evident from this table, laminates were made from three different types of fiber and two resins. Two hybrid material systems were also investigated. Several parameters were varied, including geometry, layup, and the temperature at which testing took place. Further details of the information presented below may be found in [7].
4.1 Manufacturing
All but two of the laminate types were manufactured using a Hercules Automated Tow Placement (ATP) system. The two remaining laminate types were manufactured using traditional (hand) tape layup techniques. Laminates were made using AS4 fibers, IM7 fibers (both graphite systems produced by Hercules, Inc.), and S2 fibers (glass fiber system produced by Owens-Corning Fiberglass Corp.) in combination with 938 resin (produced by ICI/Fiberite) and 8551-7 resin (produced by Hercules, Inc.). The panels were autoclave cured.
The coupons were cut to slightly oversized dimensions using a band saw,
Experimental test matrix of the tension fracture investigation done as part of the ATCAS program [7].
Notch Type: Unnotched Machined Sit
Notch Size [mm: None None None None 6.35 6.35 11.13 12.1212.70 19.05 22.23 22.23 31.75 50.80 63.50 203.2 228.6 304.8
Width [mm: 25.4 50.8 76.2 25.4 50.8 88.9 50.8 88.9 76.2 88.9 88.9 254 203 254 914 914 1520
Length (mm]: 305 305 305 305 305 305 305 305 305 305 305 762 610 762 12286 2286 3810
W12a: - - - 4 8 8 4 7 4 4 4 8 4 4 4.5 4 1 5
Test Temp [Cent.]: RT RFT RFT 1-59.5
Material Laminate S4/938 Tape Crown3-Hoop 5 5 4 S4/938 Tow 2/4/6-Axial 3 3 3 3 3 2 2/4/6-Hoop 3 3 3 3 3 2 Crown3-Axial 4 3 2 2 Grown3-Hoop 4 5 3 5 2 1 5 2 1 Crown4-Axial 3 3 3 2 1
2-Glam Hybrid Crown3-Axial 4 4 2 2
Crown3-Hoop 4 4 2 2 2
Crown4-Axial 3 3 3 2 1
Hoop Hybrid 4/4/4-Axial 3
414/4-Hoop 3 3 2 3 3 2
iM718551-7 Tape Crowns-Axial 3 3 3 2 3 2 2 1
Cown3-Ho_ 3 3 3 2 3 2 2 1 Layupe: Crown3 . (45/-45/90/0/60/6060/-60/90/-60/60/0/90/-45/451 Crown4 . [45/-45/90/0/60/-60/15/90/-15/-60/60/0/90/-45/45 2/4/6 - 1-45/90/45/90/0/01 4/4/4 - [-45/90/45/0/0/901)
Note: 0-eg direction . Axial direction.
38 Table 4.1
then sanded to the final dimensions. The notches were all machined slits for manufacturing convenience and repeatability. The slits were introduced by drilling two 1.8 mm diameter holes at the crack tip locations. The holes were then adjoined using an abrasive water jet cutter.
4.2 Testing Procedure
All the specimens except for the 1520 mm by 3810 mm panels were tested monotonically to failure at a constant stroke rate. The 1520 mm by 3810 mm specimens were subjected to incremental loading in three loading/unloading cycles. The first two cycles consisted of loading the specimens to 50% and 75% of the predicted final failure load, respectively. The third and final cycle loaded the specimen until it failed catastrophically. The tests were monitored with visual recording equipment, including a high speed camera which allowed for frame-by-frame playback in order to observe the final gross failure in detail.
The smaller coupons were equipped with extensiometers located a quarter of the total specimen length from the end of each specimen and attached 12.7 mm from its edge. The extensiometer data was used to obtain the far-field strain. In addition to an extensiometer, a strain gage rosette was placed 15.88 mm directly above the center of the notch on the 254 mm by 762 mm specimens.
Numerous strain gages were affixed to the 1520 mm by 3810 mm panels to observe their behavior under loading. The gaging is shown in Figures 4.1 and 4.2. Two gages are also placed on the backside of the specimens at the locations of gages #23 and #25. These gages are numbered #24 and #26 respectively. The strip gages indicated in Figure 4.2 contain 10 gages each, spaced at 2.03 mm intervals, the first of which is located 6.35 mm from the notch tip. The gages located above the notched (#23-#26) were located so as to monitor the tensile buckling. The strip gages were used to observe the strain concentration in front
508 mm
#3
Notch
Figure 4.1 Far field strain gage locations and their numbering on
3810 mm test specimens (not to scale). 1520 mm by
M an on wo#1 762 mm #5 508 mm A
-Y--#21 / #19/ r #17L/ #13
Strip Gage
(#S1-#S10, 1.t.r.) _L
#11 153 mm 153 mm 7--#23(#24)
#25 (#26)LJ
#27 #29 #31 #35 Strip Gage (#S11-#S20, l.t.r.) #37 #37Note: Gages #24 and #26 located on the backside of the
specimens at the location of #23 and #25, respectively.
Figure 4.2
Notch region strain gage locations and their numbering on 1520
mm by 3810 mm test specimens (not to scale).
41 12.7 mm 12.7 mm 6.4 mm 6.4 mm 25.4 mm
of the notch, and also notch or damage extension. The gages located directly above the notch tip (#13, #17, #19, etc.) were located to determine the extent to which this region falls into the shadow of the damage growth, as shown in Figure 4.3.
Out-of-plane shadow moir6 interferometry was used to monitor the out-of-plane displacement of the region around the crack. A 204 mm by 507 mm region (101 mm beyond the notch on all sides) was observed using this technique, as may be seen in Figure 4.4. Restraint bars were used to confine the out-of-plane displacement to this localized area. Pulse echo Non-Destructive Inspections (NDI) were performed prior to the first loading and subsequently after each loading cycle to observe intermediate stages of damage in the notch region.
4.3 Application to the Current Study
For the purpose of this investigation, a subset was selected from the aforementioned test specimens. Only configurations which included the testing of 1520 mm by 3810 mm panels were considered since these underwent the cyclic loading process essential to the failure investigation methodology being applied in this study. These panels were also instrumented more extensively and monitored more closely during the testing procedure. One of the laminates for which a large panel was tested was manufactured using a hybrid layup. Due the complexity of modeling this material with finite elements, this laminate was not considered. A summary of the specimens that are being considered in this study is presented in Table 4.2. As is evident from this table, the material system used is AS4/938 and the layups considered are [T45/0/90/T30 /]s and
[±45
/ 90 / 0 /±60
/ 15 / 90 / -15 / 60 / 0 / 90 / 45]t. A summary of the properties of the material system is presented in Table 4.3.In order to facilitate the correlations to be made between experimental 42
Initially: Strain Gage) Notch
Region of highest stress
Lower strain reading (strain gage "shadowed")
Damage / Region Lowe ,e 2: j (straii
----
"
r strain reading n gage "shadowed") Crack Growth Region of highest stress shifted outFigure 4.3 Diagram illustrating the shadowing of a gage located directly above the notch tip due to a damage region (case 1) or crack growth (case
2).
43
h
203 mm Specimen Restraint bars. Region of moire interferometry observation.
Figure 4.4 The region of the test specimens observed with moire interferometry. 44
Loading
I
1520 mmLoading
Table 4.2 The subset of the test matrix of the experiments conducted by ATCAS selected for this investigation.
Unnotched Machined slit
Notch size [mm]: none none 6.35 22.2 63.5 305
Width [mm]: 25.4 50.8 25.4 88.9 254 1520
Length [mm] 305 305 305 305 762 3810
W
2a:
4 4 4 52a
Laminate Number of specimens tested
Crown3-Hoop 4 3 2 2 1
Crown4-Axial 3 3 3 2 1
Note: Crown3-Hoop = [-45/45/0/90/-30/30/0/30/-30/90/0/45/-45]
Crown4-Axial = [45/-45/90/0/60/-60/15/90/- 15/-60/60/0/90/-45/451
Summary of the material properties of AS4/938 in ply coordinates.
46
Longitudinal tensile modulus E, [GPa] 135.4 Transverse tensile modulus Ey [GPa] 9.37
Poisson's ratio V, 0.32
Shear modulus G, [GPa] 4.96
Ply thickness t [mm] 0.188
Table 4.3
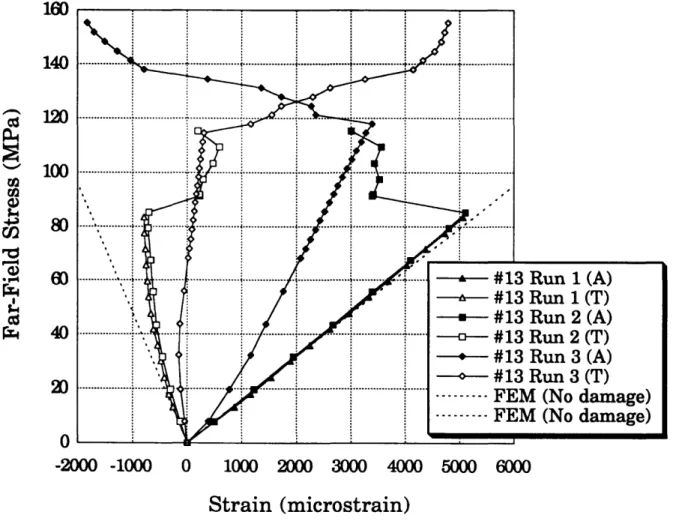
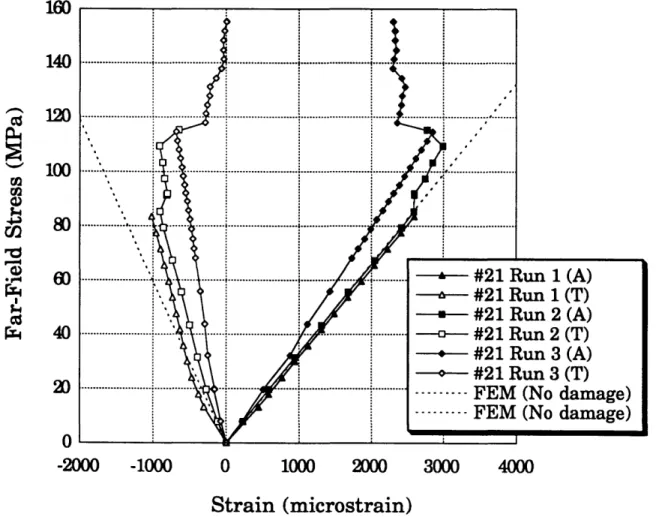
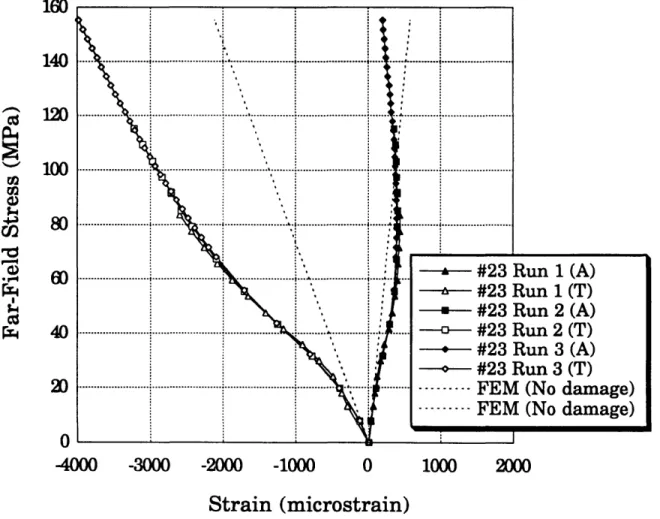
results and the analytical calculations, the experimental data was put into graphical form. The strain gage readings were graphed versus the far-field stress for each specimen. The far-field stress was calculated from load cell readings simply by dividing it by the nominal cross-sectional area of the laminate. Subsequently, the gage readings from the first and final loading cycles were graphed on the same axes for each gage location. These graphs are presented in Appendix B. Observations made from these results are presented in Chapter 6.
It is important to note that with these graphical presentations the strain gage readings are depicted with respect to the far-field applied stress, and not the local stress. As was depicted in Figure 4.3, when the damage grows at the notch tip the local stress field changes, even outside the region of actual damage. This will consequently also effect the local strain. This local stress change must not be neglected when analyzing the experimental results. This is further
discussed in Chapter 6.
Chapter 5
FINITE ELEMENT MODELING
This investigation utilized the PATRAN [42] and STAGS (STructural Analysis of General Shells) [43] software packages. PATRAN was used for the pre-processing of the mesh and the post-processing of the results. The STAGS
software package was selected for performing the calculations since it is very well suited for working with laminated shell elements and it can perform nonlinear large deformation analysis.
5.1 Finite Element Analysis
The specimens under investigation were modeled using 4-noded quadrilateral shell elements, designated in STAGS as type 410, as shown in Figure 5.1. Each node has 6 degrees of freedom, the first three of which are translational and the others rotational. Each element can model bending and stretching actions. Transverse shear is not modeled by these elements.
The stiffness matrices for each element are derived from their geometric and material properties. For the laminated shell elements, the STAGS software requires that material properties for each ply k, and its thickness (tk) and ply angle (0k ) relative to the user defined coordinate system, be specified. The material properties are the longitudinal modulus (Ex), transverse modulus (Ey), shear modulus (Gxy), and Poisson's ratio (Vxy ) defined in the ply's own coordinate system. STAGS calculates the laminate extensional matrix ([A]), the laminate extensional-bending coupling stiffness matrix ([B]), and the laminate bending stiffness matrix ([D]). These matrices are derived from the material properties of each element using Classical Laminated Plate Theory (CLPT) [44]. The
Node 4
Figure 5.1 STAGS 410 quadrilateral plate element. 49
Node 3
Node 2 2
aforementioned matrices relate the in-plane forces (N0.) and moments (M..) to the
strains (e..) and curvatures (K.) as
M
}N=[AB] (5.1)The right hand side of this expression is expanded using linear strain displacement equations to find the forces and moments in terms of the displacements. Interpolation functions are subsequently used to discretize the displacements and forces to allow for the derivation of a stiffness matrix relating the nodal displacements (q) to the nodal forces (Q) in the form [K]{q} =
{Q}.
The global stiffness matrix is generated through the assembly of the element stiffness matrices. The result is a discretized approximation of a Kirchhoff plate. Membrane and bending effects are modeled, but out-of-plane shear is neglected. Reference [45] contains a detailed description of the STAGS modeling technique.The solutions in the linear finite element analyses are obtained simply by inverting the global stiffness matrix. For the large deformation geometrically nonlinear analyses, [K] and (Q) are functions of the displacements. Therefore, an initial displacement is assumed so that the corresponding stiffness matrix and the nodal forces may be calculated. These are then used to derive the calculated nodal displacements, again by inverting the stiffness matrix. This is done iteratively using the Newton-Raphson method until the difference between the assumed initial displacements and the calculated displacements reaches an acceptable tolerance.
5.2 Modeling
A finite element model of the 1520 mm by 3810 mm panels was constructed. To implement the damage based modeling methodology, procedures were also developed to simulate the experimentally observed damage types
within the finite element model.
5.2.1 General Mesh
The mesh that was used for the finite element analysis is depicted in Figure 5.2. As may be seen from this figure, only a quarter of the specimen is modeled to increase the efficiency of the calculations. The finite element model consists of 1225 elements, and consequently has 7350 degrees of freedom. Throughout the generation of the mesh, the choice of the size and spacing of the elements was such as to ensure that nodes in the mesh coincide with the gage locations on the experimental specimens. Although originally calculated at the element integration points, the strains are interpolated to the node locations by the post-processor. Placement of nodes at gage locations allowed direct correlations to be made between the analysis and the experimental results without the need for further interpolation of the values between nodes. The mesh focuses on the notch tip to increase the precision of the analysis in this region. A 19.05 mm by 19.05 mm area ahead of the notch in both the x and y directions was divided into 1.27 mm by 1.27 mm elements.
The small element size in this region also allowed for the modeling of the experimentally observed regions of damage. The size of these regions was determined by the NDI done after the second loading of each specimen. These regions were approximated as being rectangular, so that they could be included in the model in a straightforward manner. Their dimensions were taken to be equal to the maximum dimensions of the observed damage. The material properties and the through-the-thickness construction of the shell elements in this region (example shown in Figure 5.2) were changed to model the suspected damage present there, as will be discussed in the ensuing subsections.
Top nodes constrained Element properties changed to model damage Notch tip
Y
z NotchFigure 5.2 The finite element mesh modeling the 1520 mm by 3810 mm specimens.
directions. The loading was applied at one point, as may be seen in Figure 5.2, but all the nodes along this edge were constrained to move together. Effectively, this modeled the application of a uniform end loading where the magnitude of the loading per unit length is simply the load divided by the width. The applied far-field stress is equal to the applied load divided by the cross-sectional area. At the left symmetry boundary, displacement in the v direction was constrained. Similarly, at the bottom boundary, displacement in the u direction was constrained. Along both these edges, the rotation around the corresponding axis along which each lies and the z axis were also constrained. The right edge and the edge of the notch remained free.
The assumed symmetry of the model was violated by two factors. The first was the effects of the extensional-bending coupling which occurs in unsymmetric composite laminates. However, for the slightly unsymmetric laminate used here the effects of extensional-bending coupling calculated using CLPT were found not to significantly alter the ply stresses or laminate displacements under any circumstances encountered during the analyses. The second was the observed asymmetry of the damage at the notch tips. The damage area around one side of the notch was not found to be identical to the damage at the other side. Clearly the differing nature of the damage at each notch tip affected the local stress field profoundly. However, it was assumed that this asymmetry did not alter the gross symmetry of the load paths, i.e. half the load continued to be transferred around each side of the notch. It was also assumed that the local stress field around one notch was not significantly affected by the details of the local stress field around the other. These assumptions allowed the observed damage regions to the left and right of the notch to be modeled independently.