Plant, Cell and Environment (2005) 28, 1158–1170
1158
Blackwell Science, LtdOxford, UKPCEPlant, Cell and Environment0016-8025Blackwell Science Ltd 2005? 2005 28?11581170
Original Article
Foliage dispersion in 3-D digitized trees H. Sinoquet
et al.
Correspondence: H. Sinoquet. E-mail: sinoquet@clermont.inra.fr
Foliage randomness and light interception in 3-D
digitized trees: an analysis from multiscale discretization
of the canopy
HERVÉ SINOQUET1
, GABRIELA SONOHAT1
, JESSADA PHATTARALERPHONG1,2
& CHRISTOPHE GODIN3 1UMR PIAF INRA-UBP, Site de Crouelle, 234 Avenue du Brézet, 63039 Clermont-Ferrand Cedex 2, France, 2Kasetsart
University, Faculty of Science, Department of Botany, Bangkok, Thailand and 3INRIA, UMR AMAP, TA40/PSII, Boulevard
de la Lironde, 34398 Montpellier Cedex 5, France
ABSTRACT
Light models for vegetation canopies based on the turbid medium analogy are usually limited by the basic assump-tion of random foliage dispersion in the canopy space. The objective of this paper was to assess the effect of three possible sources of non-randomness in tree canopies on light interception properties. For this purpose, four three-dimensional (3-D) digitized trees and four theoretical can-opies – one random and three built from fractal rules – were used to compute canopy structure parameters and light interception, namely the sky-vault averaged STAR (Silhou-ette to Total Area Ratio). STAR values were computed from (1) images of the 3-D plants, and (2) from a 3-D turbid medium model using space discretization at different scales. For all trees, departure from randomness was mainly due to the spatial variations in leaf area density within the can-opy volume. Indeed STAR estimations, based on turbid medium assumption, using the finest space discretization were very close to STAR values computed from the plant images. At this finest scale, foliage dispersion was slightly clumped, except one theoretical fractal canopy, which showed a marked regular dispersion. Taking into account a non-infinitely small leaf size, whose effect is theoretically to shorten self-shading, had a minor effect on STAR com-putations. STAR values computed from the 3-D turbid medium were very sensitive to plant lacunarity, a parameter introduced in the context of fractal studies to characterize the distribution of gaps in porous media at different scales. This study shows that 3-D turbid medium models based on space discretization are able to give correct estimation of light interception by 3-D isolated trees, provided that the 3-D grid is properly defined, that is, discretization maxi-mizes plant lacunarity.
Key-words: 3-D digitizing; clumping; fractals; leaf dispersion; light interception; tree canopy; virtual plants.
INTRODUCTION
Simulation models of light interception by vegetation can-opies have been developed for many years for purposes ranging from plant production and ecophysiology to remote sensing (Ross 1981; Myneni, Ross & Asrar 1989; Varlet-Grancher, Bonhomme & Sinoquet 1993). Most light models are based on the turbid medium analogy, namely Beer’s law which takes into account the amount of leaf area, and the leaf angle distribution with regard to the direction of incident radiation. The most common
applica-tion of Beer’s law is the computaapplica-tion of gap fracapplica-tion P0 of
a horizontally homogeneous canopy in a given direction W:
(1)
Where GW is the projection coefficient of leaf area on a
plane perpendicular to direction W, which depends on leaf
angle distribution, L is the leaf area index (m2 m-2) and h
is the elevation angle of direction W.
Theoretical derivation of Eqn 1 was proposed in Nilson’s (1971) pioneering work from the following original assumptions: (1) the stand consists of a large number of statistically independent layers; (2) the probability of observing more than one contact within a layer is infinitely small compared with the probability of one contact; (3) the probability of observing a contact within a small layer is equal to the mean number of contacts per layer. When applied to any vegetation canopy, the original assumptions imply three assumptions about canopy structure: (1) leaf size is assumed to be infinitely small; (2) leaves are assumed to be randomly located within the vegetation canopy, that is, the spatial location of one leaf does not depend on that of other leaves; (3) leaf area density (LAD) is assumed to be uniformly distributed within the canopy volume. Inter-action exists between foliage randomness and the spatial distribution of leaf area: if leaves are randomly distributed in the canopy space, this should lead to uniform leaf area density.
Equation 1 cannot be directly used for isolated trees because they are not horizontally homogeneous crops. Light interception at the tree canopy scale can be charac-terized by STAR values, namely the Silhouette to Total
Foliage dispersion in 3-D digitized trees 1159
Area Ratio (Oker-Blom & Smolander 1988), which
depends on incident direction W. Sky-integrated STAR
expresses the overall light interception of the tree, and is also the average relative leaf irradiance. For isolated trees, assumptions used in Beer’s law derivation can be violated in two ways. On one hand, leaf size may be significant with regard to the ground area occupied by the tree, especially for seedlings (e.g. Planchais & Sinoquet 1998). On the other hand, foliage may be aggregated within clumps around the current-year shoots (e.g. Whitehead, Grace & Godfrey 1990; Cohen, Mosoni & Meron 1995).
Solutions have been proposed which relax the classical Beer’s law assumptions. Leaf size has been explicitly included by replacing the original Beer’s law by a binomial or multinomial law (Fukai & Loomis 1976;
Thanisawan-yangkura et al. 1997). Non-randomness of leaf location has
been taken into account by using binomial and Markov
models (Nilson 1971; Cohen et al. 1995). These models lead
to modified forms of Beer’s law where one or two addi-tional leaf dispersion parameters have been introduced. Usually the leaf dispersion parameters were not explicitly related to canopy geometry parameters or botanical fea-tures, except in Foroutan-Pour, Dutilleul & Smith (2001) where leaf dispersion was characterized by the fractal dimension of the leafless branching system measured on a
photograph. In addition recently, Niinemets et al. (2004)
found some correlation between clumping and petiole length in poplar canopies.
Non-uniform distribution of leaf area has been taken into account in two general ways: firstly, the canopy can be divided into subcanopy envelopes filled with uniform LAD
(e.g. Thorpe et al. 1978; Norman & Welles 1983). Multiscale
applications have been proposed, where needles have been included in shoot envelopes, and shoots in whorls and crowns canopies (Norman & Jarvis 1975; Oker-Blom & Kellomäki 1983). Secondly, the space occupied by the veg-etation is discretized in two or three-dimensional rectangu-lar cells (e.g. Kimes & Kirchner 1982; Cohen & Fuchs 1987). In computer graphics jargon, the three-dimensional (3-D) cells are called voxels, which is a nickname for ‘vol-ume element’. In the voxel grid, differences between voxels in foliage density account for the spatial variations of LAD within the canopy, while the original Beer’s law is applied within each voxel with assumptions of random and uniform leaf area distribution.
Three-dimensional plant mock-ups built from 3-D digi-tizing (e.g. Sinoquet & Rivet 1997) or generated from growth simulation rules (e.g. Prusinkiewicz 1998) give an alternative way to compute light interception by isolated
plants (e.g. STAR values, Sinoquet et al. 1998). Comparison
between turbid medium light model outputs and STAR values computed from virtual images of 3-D plant mock-ups has shown the overall effect of clumping on light
inter-ception by trees (e.g. Chen et al. 1993).
The objective of this study was to quantify the effect of the three assumptions used in Beer’s law on light intercep-tion computaintercep-tions for a range of isolated tree canopies. For this purpose, actual trees were 3-D digitized and theoretical
trees were generated from fractal rules or in order to get a
random canopy (Pinty et al. 2001). Although any feature of
the canopy radiation field is largely affected by foliage clumping, light interception was characterized only by sky-integrated STAR values. They were computed from virtual images of the tree mock-ups, and from a turbid medium model using 3-D discretization of the canopy into voxels at different scales. Virtual images of 3-D digitized plants allowed us to estimate the actual STAR values, while com-parison with turbid medium computations at different scales made it possible to separate the effects of the three assumptions. The second objective of the paper was to define the best grid for 3-D models based on the turbid medium analogy, in terms of resolution, rotation and translation.
MATERIAL AND METHODS
3-D plants
Eight 3-D plants were included in the study. Four real trees were 3-D digitized in the field, while four additional plants were generated from theoretical assumptions.
One 3-year-old-hybrid walnut tree (NG38 ¥ RA) and
two 2-year-old-mango trees (cv. Nam Nok Mai) were 3-D
digitized at leaf scale, according to Sinoquet et al. (1998)
method, in August 1998 and November 1997, respectively. The walnut tree was grown in an experimental plot in Cler-mont-Ferrand INRA research centre, France, while the mango trees were grown in a commercial farm in Ban Bung, 150 km south-east of Bangkok, Thailand. The location and orientation of each leaf was recorded with a magnetic dig-itizer (Fastrak 3Space; Polhemus, Vermont, USA) while leaf length and width were measured with a ruler. A sample of leaves was harvested on similar trees to establish an allometric relationship between individual leaf area and the product of leaf length and width. The individual area of sampled leaves was measured with a leaf area meter (Li-cor 3100: Li-Cor Inc., Lincoln, NE, USA). The data sets therefore consisted of a collection of leaves, the size, the orientation and the location of which have been measured in the field.
One 4-year peach tree (cv. August Red) was digitized in May 2001 in CTIFL Center, Nîmes, South of France, at current-year shoot scale, 1 month after bud break. Given the high number of leaves (˜14 000), digitizing at leaf scale was impossible. The magnetic digitizing device was there-fore used to record the spatial co-ordinates of the bottom and top of each leafy shoot. Thirty shoots were digitized at leaf scale in order to derive (1) leaf angle distribution; (2) allometric relationships between number of leaves, shoot leaf area and shoot length. Leaves of each shoot were then generated from (1) allometric relationships; (2) sampling in leaf angle distribution; and (3) additional assumptions, namely constant internode length and leaf size within a
shoot (see Sonohat et al. 2004).
Three theoretical plants were generated from 3-D iter-ated function systems (IFS; Barnsley 1988) using the PGL
1160 H. Sinoquet et al.
library in AMAPMOD (Boudon et al. 2001). Each IFS
cor-responds to a transform made up of a contraction by a
factor c (c< 1) followed by n duplications of the contracted
object. When applied recursively to an initial object, the IFS successively generates a family of forms that converges towards a fractal object called its attractor. In practice, after only a few iterations a fractal-like object is obtained (Fig. 1). If the duplications of the IFS do not overlap, the theoretical fractal dimension of the IFS attractor is
(2) A first IFS was designed to simulate a 3-D Cantor dust, which can be regarded as an ideal clumped plant structure at different scales. It was made up of a contraction by a factor 1/3 and eight translations to the eight corners of a cube. The first fractal plant corresponds to the fourth
iter-ation of this IFS applied to an initial cube of size 27 m3.
A second IFS was designed to simulate a self-similar
plant-like canopy with (n= 9, c= 1/3). The IFS was applied
three consecutive times to an initial horizontal disc leading to a first fractal plant (third form in Fig. 1). A further iter-ation (depth 5) was used to derive a second fractal plant (fourth form in Fig. 1).
Finally a random isolated canopy was generated by
ran-domly locating 1000 leaves within a 1.2-m3 cube. Virtual
leaves were discs. Leaf diameter was set to 10 cm, while leaf orientation was sampled in a spherical distribution (Ross 1981).
Multiscale description of canopy structure
For each 3-D plant, a rectangular bounding box was built from the spatial co-ordinates of phytoelements. The diago-nal of the bounding box was thus defined by co-ordinates (xmin, ymin, zmin) and (xmax,ymax, zmax), where, for example, xmin
is the minimum x-value shown by a leaf point in the tree
foliage
(3)
where LTree is the number of leaves in the tree canopy.
The bounding box was divided into voxels at different
scales n (n= 1, . . . N). At scale 1, the bounding box was
represented by a single voxel. At scale n, the bounding box
D n c T =
(
)
ln ln 1 x x l L l min =1 min Tree = [ ]was divided into n parts along each box dimension, making
a set of n3 voxels of size dx= (x
max-xmin)/n, dy= (ymax
-ymin)/n, dz= (zmax-zmin)/n. As the bounding box was rect-angular, voxels resulting from discretization at any scale
were also rectangular, namely, in general dxπ dyπ dz.
Canopy structure parameters computed from the 3-D digitized datasets were the total leaf area and the tree vol-ume abstracted by the volvol-ume of the bounding box. Aver-age LAD of the tree canopy was then calculated as the ratio of total leaf area to bounding box volume.
At each scale n, the area of each leaf was affected to
voxels according to the spatial co-ordinates of five leaf points, namely proximal, mid and distal points of the mid-rib, and lamina left and right border points at half leaf length. The co-ordinates of the five leaf points were com-puted from those of proximal point of the midrib (i.e. the junction point between petiole and lamina) and leaf orien-tation characterized by the Euler angles (see, e.g. Sinoquet
et al. 1998). One-fifth of leaf area was affected to each leaf point, and therefore to each voxel including a leaf point.
The number of vegetated voxels Vn was counted and the
intervoxel variance of LAD was computed as
(4) Plant lacunarity – a scale-dependent measure of heteroge-neity of an object, originally proposed to analyse fractal objects (Mandelbrot 1983) – was then derived from LAD
computations (Allain & Cloitre 1991; Plotnick et al. 1996)
(5)
Note that this quantity is defined for a given scale n. When
the foliage structure is homogeneous at scale n, the
lacunar-ity is close to 1. When the foliage shows a heterogeneous
clumped structure at scale n, the lacunarity should be
largely greater than 1. If clumps appear at a single scale, lacunarity should be high at this scale and low at other scales. If clumps are observed at different scales, lacunarity should remain high throughout scale.
STAR computations
Light interception at tree scale was characterized by STAR values, namely the ratio of silhouette to total leaf area
var
3
LADn LADj LAD n
j n ( ) =
[
-]
=Â
2 1 3 / Ln= +1 (LAD)n[
LAD]
2 varFigure 1. Generation of a fractal plant. From left to right: four consecutive generations of an IFS transform consisting of nine duplications of an initial object (a big horizontal leaf) contracted by a factor 3. Theoretical fractal dimension of the attractor is DT= 2. The third and fourth
plant (from the left end-side) are the fractal plants, no. 1 and no. 2, respectively, considered in this study.
Foliage dispersion in 3-D digitized trees 1161
(Oker-Blom & Smolander 1988). As STAR is a directional
feature, values were computed for a set of W= 1, . . . 46
directions over the sky vault, according to the turtle sky discretization proposed by Den Dulk (1989). Sky-inte-grated STAR values were then computed by averaging
STARW values after weighing by standard (SOC; Moon &
Spencer 1942) overcast sky radiance distribution, for example
(6)
where is the relative contribution of direction W to
incident radiation in SOC conditions. is thus an
estimator of the whole tree ability for light capture.
was normalized to get = 1 for a canopy made of a
single isolated horizontal leaf. In order to quantify the
con-tribution of each source of foliage non-randomness, STARW
values were computed in different ways.
Firstly, STARW was computed from virtual images of the
3-D tree mock-ups (Sinoquet et al. 1998), by using
soft-ware VEGESTAR v.3 (Adam, Donès & Sinoquet 2002).
The virtual images were created by using a virtual ortho-graphic camera, namely a camera with parallel rays, in all 46 directions W. Image processing simply consisted of counting plant pixels seen on the picture, scaling measured areas according to pixel size and ratioing to total leaf area. After summing up over the sky vault (Eqn 6), the
resulting value (where index PMU refers to
plant mock-up) was assumed to be the real STAR value, since it was computed without any assumptions about leaf dispersion.
Secondly, STARW was computed from the radiation
transfer model included in the RATP model (Sinoquet et al. 2001). In this model, light interception is computed from the turbid medium analogy in a grid of voxels. For each direction W, a set of regularly spaced beams is cast in the bounding box, and beam attenuation is computed from the
combination of gap fractions in the sequence of
voxels k intersected by beam b
(7)
where Ab is the cross-section area of a beam, Atree the total
leaf area of the plant, and (k = 1, . . . Kb) is the sequence of
intersected voxels. Note that is gap fraction in the
beam cross-section area Ab, due to leaf area in voxel k. In
all simulation runs, beam spacing was 2 cm. Gap fraction was computed in two ways. Firstly, Beer’s law was used as in the original version of the RATP model.
(8)
where lbk is the length of beam b in voxel k. As previously
mentioned, Eqn 8 assumes that leaf size is infinitely small with regard to voxel size.
Secondly was computed by explicitly taking into
account the effect of leaf size. For any beam b, was
therefore calculated from the product of gap fractions pro-duced by each individual leaf l in voxel k.
STAR=
[
STAR ◊ SOC]
=
Â
W W W w 1 46 wWSOC STAR STAR STAR STARPMU p k b0 , STAR A p k b A k K b B b W= ◊ - ’È ÎÍ ˘˚˙{
=}
=Â
b 1 Tree 1 0 1 , p k b0 , p k b0 ,p k b0 , Beer=exp(-G LAD lW◊ k bk◊ )
p k b0 ,
p k b0 ,
(9)
where Lk is the number of leaves in voxel k, and a¢bl is the
portion of area of leaf l projected onto the beam
cross-section area Ab. Given the assumption of uniform
distribu-tion of leaves within the voxel volume, a¢bl should be
pro-portional to the volume Vbk associated with beam path in
voxel k.
(10)
where A¢l is the projected area of leaf l to a plane
per-pendicular to beam direction, and V is the voxel volume (V = dx dy dz). We numerically checked that regular and dense beam sampling within the canopy ensured
the normalization condition and consequently
to be verified.
Thus, (11)
According to leaf size with regard to voxel volume, the term may become negative, that is, in the case of a big leaf in a small voxel. This property was used to define the lower limit of possible voxel size.
Equation 11 rigorously deals with the case where each leaf is entirely located in a single voxel. As mentioned above, here leaves were cut into five pieces in order to distribute leaf area into voxels. Therefore Eqn 11 was changed as follows in order to simultaneously take into account size of the whole leaf and possible distribution of individual leaf area in several voxels
(12)
where Pk is the number of leaf pieces in voxel k, and A¢l is
still the whole projected area of leaf l associated with leaf piece p. One can check that if voxel k includes whole leaves, Eqns 11 & 12 are the same. Otherwise one could remark
that tends to if leaf size tends to
0, that is, if Lk tends to • and all A¢l tend to 0.
Turbid medium STARW values were computed from Eqn
7 by using both Eqns 8 and 12 at each scale n of bounding box discretization. After summing up on sky directions,
the resulting values were noted and
, respectively. Scales n were varied from 1 to
N, where N refers to the finest space discretization. N is the
largest integer allowing each leaf to be included in one
single voxel, that is, the term in Eqn 12 to
keep positive.
Computed values , and
were compared for a detailed analysis of foliage non-randomness. Comparisons between
– or – at different tree
discret-ization n show the multiscale effect of foliage clumping, namely accounted for by spatial variations of LAD within
the tree canopy. Discrepancies between or
p k b a A l L bl b k 0 1 1 , Binom= ’ - ¢
[
]
= ¢ = ¢ ◊(
)
= ¢(
)
abl Al Vbk V A A ll b bk V Vbk V b B = =Â
1 ¢ = ¢ =Â
abl A b B l 1 p k b A ll bk V l Lk 0 1 1 , Binom=[
- ¢◊]
=’
1 - ¢◊[
A ll bk V]
p k b A ll bk V p Pk 0 1 1 5 1 , Binom=[
- ¢◊]
=’
p k b0 , Binom p k b0 , Beer STARBeer n STARBinomn 1 - ¢◊[
A ll bk V]
STARPMU STARBeer n
STARBinomn
STARBeer n STARBinomn
1162 H. Sinoquet et al.
and show the effect of foliage
non-randomness at a local scale, e.g. leaf arrange-ment around the shoot. Finally differences between
and account for the effect of
leaf size on light capture.
RESULTS
Canopy structure
Figure 2 shows virtual images of the 3-D plant mock-ups. Images of digitized plants look like real plants of the same species, and visual comparison between the virtual image and an actual tree photograph in case of mango tree no. 1 and walnut tree shows that 3-D digitizing allows one to get a detailed and accurate description of the real spatial dis-tribution of the tree foliage. Images in Fig. 2 also show the
STARBinom N STARPMU
STARBeer n STARBinomn
variety of tree canopy geometry used in this study. Random canopy appears like the theoretical random mock-ups pro-posed by De Castro & Fetcher 1999) and Pinty et al. (2001). The Cantor dust shows a much organized structure based on a ternary space division at consecutive scales. Fractals plants no. 1 and no. 2 look very similar since they were built from the same pattern and only differ by one depth order (Fig. 1).
Table 1 shows canopy structure parameters computed at tree scale. Actual trees showed large variations in geometry parameters, especially with regard to the number of leaves, from 1559 for mango tree no. 1 to 14260 for the peach tree;
total leaf area, from 6.5 to 28 m2; and bounding box volume,
from 5 to 25 m3. As a result, mean LAD showed a two-fold
range: from 0.66 to 1.32 m2 m-3
. Inclusion of theoretical plants increased the range of canopy structure parameters, especially number of leaves (only 730 leaves for fractal
Figure 2. Images of the tree canopies used in this study. Images were synthesized from VEGESTAR v.3 software. Actual pictures of mango no. 1 and walnut tree canopies are shown on the left for visual comparison.
Walnut
Cantor
Mango1
Mango2
Random
Peach
Walnut
Cantor
Mango1
Mango2
Random
Peach
Table 1. Canopy structure parameters of the 3-D plants
Plants Height (m) No. leaves Mean leaf area (cm2) Total leaf area (m2) Bounding box volume (m3) Minimum voxel volume (dm3) Mean LAD (m2 m-3) STAR Walnut 2.6 1559 47.2 7.35 11.09 3.29 0.66 0.44 Peach 2.6 14260 19.6 28.01 24.80 0.33 1.13 0.22 Mango1 1.8 1636 39.6 6.48 4.98 2.88 1.3 0.36 Mango2 1.6 2458 33.7 8.27 6.29 2.86 1.32 0.32 Fractal1 3.7 729 86.2 6.28 9.80 1.99 0.64 0.44 Fractal2 3.6 6561 9.6 6.28 9.80 0.08 0.64 0.39 Cantor 3 4096 19.2 7.84 27.00 0.76 0.29 0.72 Random 1.2 1000 78.5 7.85 1.73 1.73 4.55 0.27
Foliage dispersion in 3-D digitized trees 1163
plant no. 1), individual leaf size, bounding box volume and mean LAD.
The minimum voxel volume, computed as the smallest voxel volume able to include every individual leaf, also showed a large variation. As the minimum voxel size resulted from a combination between leaf dimensions and orientation, the correlation between minimum voxel size
and mean leaf area was low (r2 = 0.25, data not shown).
In the range of studied scales, the number of vegetated voxels in the actual tree canopies was closely related to voxel size by a power law, as a log–log relationship was
quite linear (r2 > 0.99 for all trees, Fig. 3a and Table 2). The
slope of the line was between 2 and 3, that is, values for fractal objects in-between two-dimensional (2-D) surfaces and 3-D volumes. The slope showed inter-tree range, that is, from 2.33 for peach tree to approximately 2.52 for mango trees (Table 2). Theoretical trees also showed this kind of
fractal behaviour (Fig. 3b), but the r2 coefficient was lower,
especially for the fractal plants and the Cantor dust, although they were built from fractal rules. Indeed, for the fractal plants – mainly the Cantor dust – some points with a smaller voxel size showed a smaller number of vegetated voxels (see the lines on Fig. 3b). This results from mismatch between space discretization by the 3-D grid and space occupation by the plant. As an example, all voxels at scale
4 (i.e. dx = (xmax - xmin)/4) in the Cantor dust were vegetated
because it was based on space division by 3n. In contrast, at
several scales, the 3-D grid exactly coincided with the space occupation by the plant (e.g. scales 1, 3, 9, 27 for the Cantor dust, see bottom points on the log–log curve Fig. 3b). Oth-erwise the slope of the log–log line in the random canopy was close to 3, which is the expected value for objects uniformly filling the 3-D space.
For real trees, the variance of LAD as represented by plant lacunarity (Eqn 5) monotonously increased with decreasing voxel size as a power law: the smaller voxel size, the larger variance of LAD taken into account by space division. The log–log relationship was quite linear (Fig. 4a
and Table 2), with r2 coefficients above 0.97. Theoretical
canopies did not show the same behaviour (Fig. 4b). The two fractal trees showed almost the same increase of plant lacunarity with smaller voxel size, but at some points, a smaller voxel size resulted in a smaller variance in LAD. The Cantor dust showed large oscillations of plant
lacunar-Figure 3. Log–log relationship between voxel size and number of vegetated voxels in the tree canopy. Voxel size is defined as the cube-root of voxel volume since voxel size is different according to X-, Y- and Z-axis. Regression lines are not shown for sake of figure clarity, but r2 coefficients are given in Table 2. (a) digitized
real trees; (b) theoretical canopies.
0
2
4
6
8
10
-4
-3
-2
-1
0
1
2
Log (voxel volume
1/3)
Log (number of vegetated voxels)
Walnut
Peach
Mango #1
Mango #2
0
2
4
6
8
10
-4
-3
-2
-1
0
1
2
Log (voxel volume
1/3)
Log (number of vegetated voxels)
Fractal #1
Fractal #2
Cantor
Random
(a)
(b)
Table 2. Determination coefficients and absolute values of slopes of linear regression analysis between log(voxel size) as X-variable, and (1) log(number of vegetated voxels) and (2) log(plant lacunarity) Log(no. vegetated voxels) Log (plant lacunarity) r2 |slope| r2 |slope| Real trees Walnut 0.995 2.39 0.983 0.60 Peach 0.996 2.33 0.998 0.75 Mango no. 1 0.996 2.54 0.989 0.48 Mango no. 2 0.998 2.51 0.974 0.58 Theoretical trees Fractal no. 1 0.990 2.32 0.943 1.01 Fractal no. 2 0.991 2.22 0.977 1.01 Cantor 0.978 2.30 0.780 0.99 Random 0.999 2.93 – –
Voxel size is defined as the cube-root of voxel volume since voxel size is different according to X-, Y- and Z-axis. For plant lacunarity, data of the 3 largest voxel sizes were discarded from computation because they do not belong to the linear portion of the line. See Figs 3 and 4 for data points.
1164 H. Sinoquet et al.
ity with voxel size, again resulting from obvious mismatch between space occupation by the plant and space division by the voxel grid. As a result, the log–log relationship was
more scattered, with lower r2 coefficients (Table 2),
espe-cially for fractal plant no. 1 (r2 = 0.94) and the Cantor dust
(r2 = 0.78). Otherwise the lacunarity line for the random
canopy was monotonous but highly concave and therefore non-linear, as reported by Plotnick et al. (1996) for random sets.
The maximum variance of LAD taken into account by space discretization showed a large range among real trees.
As computed from Eqn 5, this corresponds to coefficient of variation of voxel LAD ranging between 3.6 and 18.5 for walnut and peach tree, respectively. Theoretical plants showed maximum values of LAD variance included in this range.
In contrast with the effect of voxel size, variance of LAD showed small variations in response to the 3-D grid trans-lation and rotation (Fig. 5). For walnut tree at a fine scale (n = 10), fluctuations of LAD variance were very low, with a coefficient of variation of 0.65%. For mango no. 1 tree at an intermediate scale (n = 6), fluctuations of LAD variance were slightly larger (coefficient of variation of 1.9%). Other trees showed the same trends (data not shown).
Figure 4. Log–log relationship between voxel size and plant lacunarity. Voxel size is defined as the cube-root of voxel volume since voxel size is different according to X-, Y- and Z-axis. Regression lines are not shown for sake of figure clarity, but r2
coefficients are given in Table 2. (a) digitized real trees; (b) theoretical canopies.
0
1
2
3
4
-4
-3
-2
-1
0
1
2
Log (voxel volume
Log (plant lacunarity)
Walnut
Peach
Mango #1
Mango #2
0
1
2
3
4
-4
-3
-2
-1
0
1
2
Log (voxel volume
1/3)
Log (plant lacunarity)
Fractal #1
Fractal #2
Cantor
Random
(a)
(b)
1/3)
Figure 5. Changes in LAD variance of walnut and mango no. 1 trees as a function of grid rotation around Z-axis (a) and translation along X-axis (b). The bounding box was divided at scale 10 and 6 for walnut and mango trees, respectively.
1.0 1.5 2.0 2.5 3.0 3.5 0 15 30 45 60 75 90
Rotation of bounding box (degrees)
Variance of leaf area density
Mango#1 Walnut 1.5 2.0 2.5 3.0 3.5 4.0 4.5 0% 20% 40% 60% 80% 100%
Translation of bounding box (% of cell size)
Variance of leaf area density
Walnut Mango#1 (a)
Foliage dispersion in 3-D digitized trees 1165
STAR computations
Values of of digitized trees, i.e. real sky
vault-integrated STAR values computed from VEGESTAR,
showed a two-fold range (Table 1, last column): the peach
tree had the lowest (0.22) whereas the walnut
tree with the lowest LAD had the highest score (0.44).
Mango trees had intermediate values although
their mean LAD was larger. This underlines that the trees sampled for this study showed a range of light interception
responses. values of theoretical trees were
included in the same range, except the Cantor dust where was higher (0.72), due to its low LAD. Note that
the random canopy had a similar to that of the
peach tree, although mean LAD was about four-fold. Light interception capacity as computed from the turbid
medium model, namely , showed large
vari-ations as a function of space discretization scale (Fig. 6). For
real trees, the smaller voxel size, the lower .
The STAR value computed at bounding box scale (i.e. ) was about +50% of the value computed at
finest space discretization (i.e. ) for walnut
and mango trees, but it was about two-fold for the peach
tree. changes showed high correlation with
voxel size, with r2 coefficients about 0.92–0.97. For
theoret-ical trees, was also generally lower for smaller
voxel size (Fig. 6b). However, the random canopy showed only small changes according to voxel size. Moreover, unlike the real trees, the relationship for fractal objects was not strictly monotonous, especially for the Cantor dust where the line showed large oscillations.
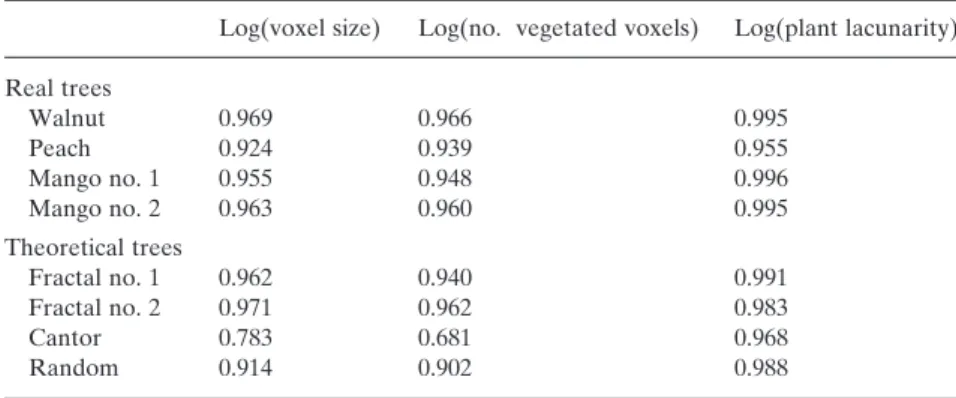
When values were plotted against plant
lacunarity, relationships were strictly monotonous and quite linear, for both real and theoretical trees (Fig. 7).
Determination coefficients r2 were very close to 1 for all
plants (Table 3) but the peach tree (r2˜0.96) and the Cantor
dust (r2 = 0.97). Nevertheless was always
more correlated to plant lacunarity than to voxel size or number of vegetated voxels (Table 3).
The small changes in plant lacunarity due to grid trans-lation and rotation at fixed voxel size resulted in small
variations in (Fig. 8, for grid rotation in mango
no. 1 tree). Although they were small, changes in
were highly correlated to plant lacunarity: the higher plant
lacunarity, the smaller . Finally Figs 7 and 8 show
that STAR computations with a turbid medium model are very sensitive to canopy lacunarity included in the model.
Values of STAR computed from the turbid medium
model at finest space discretization, namely ,
were generally close to reference values, that is,
computed from plant images (Fig. 9). Data points below the
1 : 1 line indicate < , namely
foli-age dispersion at finest scale is clumped. All plants but the Cantor dust showed almost random leaf dispersion at finest scale: peach, mango and fractal trees were slightly clumped, whereas the walnut and the random canopy were quite
STARPMU STARPMU STARPMU STARPMU STARPMU STARPMU STARBeer n STARBeer n STARBeer1 STARBeer N STARBeer n STARBeer n STARBeer n STARBeer n STARBeer STARBeer STARBeer STARBeer N STARPMU
STARPMU STARBeer N
random. The Cantor dust showed high regular dispersion at local scale due to the regular geometric rules used for its construction.
Values of STAR computed with the turbid medium with
either Beer’s law (Eqn 8, ) or by taking into
account the finite leaf size (Eqn 9, ) were also
very close (Fig. 10). The ratio /
was always greater than 1, because finite leaf size as taken into account in Eqn 9 means that a given leaf does not
STARBeer n
STARBinom n
STARBinom n STARBeer n
Figure 6. , namely light interception capacity computed from the turbid medium model, as a function of log(voxel size). Voxel size is defined as the cube-root of voxel volume since voxel size is different according to X-, Y- and Z-axis. (a) digitized real trees; (b) theoretical canopies.
0
0.1
0.2
0.3
0.4
0.5
0.6
-4
-3
-2
-1
0
1
2
Log (voxel volume
1/3)
STAR
Beer<
n
>
Walnut
Peach
Mango #1
Mango #2
0
0.1
0.2
0.3
0.4
0.5
0.6
0.7
0.8
-4
-3
-2
-1
0
1
2
Log (voxel volume
1/3)
STAR
Beer<
n
>
Fractal #1
Fractal #2
Cantor
Random
(a)
(b)
STARBeern1166 H. Sinoquet et al.
shade itself. As expected the ratio increased with smaller voxel size, that is, as a function of the ratio between leaf and voxel size, but the overall effect was small: For real trees, the maximum values of the ratio was between 1.02 and 1.04. The same kind of response was found for the theoretical trees (data not shown).
DISCUSSION
Although Beer’s law has been intensively used in light mod-els for vegetation purposes, it shows a major drawback
which is the random dispersion assumption. Usually depar-ture from foliage randomness is assessed from comparison between light interception/transmission as computed from a turbid medium model and as measured in the field (see, e.g. Table 1 in Myneni et al. 1989). In this study we have attempted to identify the contribution of three sources of foliage non-randomness to light interception properties of a range of actual and theoretical ‘deciduous’ trees.
STAR computations with a classical 3-D turbid medium (RATP, Sinoquet et al. 2001) were close to reference STAR
Figure 7. , namely the light interception capacity computed from the turbid medium model, as a function of log(plant lacunarity), for a range of space divisions (n = 1, . . . N). (a) digitized real trees; (b) theoretical canopies.
0
0.1
0.2
0.3
0.4
0.5
0.6
0
1
2
3
4
Log (plant lacunarity)
STAR
Beer<
n
>
Walnut
Peach
Mango #1
Mango #2
0
0.1
0.2
0.3
0.4
0.5
0.6
0.7
0.8
0
1
2
3
4
Log (plant lacunarity)
STAR
Beer<
n
>
Fractal #1
Fractal #2
Cantor
Random
(a)
(b)
STARBeernFigure 8. , namely light interception capacity computed from the turbid medium model, as a function of log(plant lacunarity), for a range of grid rotations at a fixed voxel size (scale = 6) for the mango no. 1 tree.
y = -0.13x + 0.63 R2 = 0.81 0.44 0.45 0.46 1.32 1.34 1.36 1.38 1.40
Log (plant lacunarity)
STAR
Beer
STARBeer
Figure 9. , namely light interception capacity computed from plant images, versus , i.e. light interception capacity computed from a 3-D turbid medium model at finest space discretization. 0 0.2 0.4 0.6 0.8 0 0.2 0.4 0.6 0.8 STARBeer<Λmax> STAR PMU 1:1 Cantor Random Peach Walnut Fractal1 Fractal2 Mango1 Mango2 STARPMU STARBeer N
Foliage dispersion in 3-D digitized trees 1167
values, that is, as computed from plant images, only when the canopy volume was discretized at finest scale allowed by leaf size (Fig. 9). Other potential sources of foliage non-randomness, namely leaf size and non-randomness at local scale had a much lesser effect.
Deviation from foliage randomness may have occurred from finite leaf size. Indeed Beer’s law assumptions results in computing self-shading within a given leaf, because the latter is abstracted as an infinite number of small elements randomly distributed in space. Plane leaves of real plants do not show self-shading. Consequently a random set of finite leaves theoretically behaves as a regular canopy (Sinoquet, Varlet-Grancher & Bonhomme 1993). Previous model comparisons on cotton canopies (Thanisawan-yangkura et al. 1997) and tree seedlings (Planchais & Sinoquet 1998; Farque, Sinoquet & Colin 2001) have
already shown that the effect of leaf size is usually negligi-ble, except in the case of very young plants with only some leaves. Note however, that Fukai & Loomis (1976) explicitly included leaf size in their 2-D light interception model.
Non-randomness at local scale has rarely been directly assessed. In case of coniferous trees, needles are known to be clumped in shoots (Oker-Blom & Kellomäki 1983), so that several authors have proposed to input measured STAR values at shoot scale in the light models (Stenberg, Smolander & Kellomäki 1993; Nilson & Ross 1997). In that case shoots replace needles as basic canopy elements and within-shoot needle clumping is implicitly taken into account. In the case of deciduous trees, foliage randomness at local scale could also be derived from light interception at shoot scale. Takenaka (1994) described the 3-D geometry of shoots and related their light interception properties to petiole length and lamina narrowness. In a similar way, Falster & Westoby (2003) digitized in three dimensions the shoot geometry of a wide range of species. Such datasets could be used to check if foliage randomness at local scale, as found in our study, is a general issue. If not, the only present way to include non-randomness at local scale in light models would be to introduce a local leaf dispersion parameter or replace leaf elements by shoot elements as already mentioned for conifers.
Figure 9 shows that 3-D turbid medium models based on space division in voxels (e.g. Kimes & Kirchner 1982; Myneni 1991; Sinoquet et al. 2001) are able to provide cor-rect estimations of light interception, namely that non-randomness in canopy structure is mainly driven by spatial variations in leaf area density. Note that Lang & Yueqin’s method (1986) of leaf area index estimation from canopy transmittance is based on this assumption. However results are dramatically sensitive to voxel size (Fig. 6), which is the way the spatial variations of canopy structure are taken into account. Previous studies have mainly showed strong devi-ations between actual light interception and light intercep-tion in a horizontally homogeneous canopy of the same leaf area index (Chen et al. 1993; Bégué et al. 1996). Here we
have shown that computed STARBeer values decreased with
voxel size in real digitized trees (Fig. 6). This is in
agree-Log(voxel size) Log(no. vegetated voxels) Log(plant lacunarity) Real trees Walnut 0.969 0.966 0.995 Peach 0.924 0.939 0.955 Mango no. 1 0.955 0.948 0.996 Mango no. 2 0.963 0.960 0.995 Theoretical trees Fractal no. 1 0.962 0.940 0.991 Fractal no. 2 0.971 0.962 0.983 Cantor 0.783 0.681 0.968 Random 0.914 0.902 0.988
Voxel size is defined as the cube-root of voxel volume since voxel size is different according to X-, Y- and Z-axis. See Figs 6 and 7 for data points.
Table 3. Determination coefficients of linear regression analysis between
and (i) log(voxel size); (ii) log(number of vegetated voxels) and (iii) log(plant lacunarity)
STARBeern
Figure 10. Ratio of STAR values computed from a 3-D turbid medium light by taking into account finite leaf size ( ) or not ( ), as a function of voxel size, for four digitized real trees.
0.95
1.00
1.05
1.10
-4
-3
-2
-1
0
1
2
Log (voxel volume
1/3)
STAR
Binom<
n
> /
STAR
Beer<
n
>
Walnut
Peach
Mango #1
Mango #2
STARBinomn STARBeern1168 H. Sinoquet et al.
ment with Knyazikhin et al. (1997)¢s results where PAR transmittance was reported to increase with smaller voxel size. This is purely the result of a mathematical property of the negative exponential function, namely the curve
convexity which makes that . This
prop-erty is reported as Jensen’s inequality. Its consequences on light interception in 3-D heterogeneous optical media have been extensively discussed by Davis & Marshak (2004). In our case, this makes trees behave as clumped at canopy (i.e. bounding box) scale, although they show random disper-sion at local scale (Whitehead et al. 1990).
The actual trees showed fractal behaviour, namely high log–log correlations between voxel size, number of vege-tated voxels and lacunarity (Table 2). It was therefore dif-ficult to distinguish between all these three variables as candidates of clumping parameters. Paradoxically, using objects built from fractal rules allowed us to – slightly – break the correlation between the three variables (Figs 3b & 4b). Indeed regular space discretization in voxels did not match the regular pattern of space occupa-tion by these deterministic fractal objects. Using them consequently showed that plant lacunarity better than voxel size accounts for the effect of spatial variations in leaf area density on STAR computations when grid
reso-lution varies (Fig. 7 and Table 3): the higher plant
lacunarity, the more uniform distribution of leaf area density within the voxels, and the smaller effect of Jensen’s inequality at local scale. Such a conclusion was already qualitatively drawn by Andrieu & Sinoquet (1993) from directional gap fraction measurements in physical plant mock-ups. Here we showed a quantitative relationship between sky vault-integrated light intercep-tion and canopy lacunarity. Although clumping is known to show directional changes (e.g. Chen 1996; Kucharik, Norman & Gower 1999), canopy lacunarity thus appears as a general clumping parameter for direction-integrated light interception.
A practical consequence of this study is that 3-D turbid medium models should be very careful with the space dis-cretization into voxels, although this is seldom discussed in the literature (Knyazikhin et al. 1997). We showed here that plant lacunarity and light interception computations are virtually insensitive to grid translation and rotation (Fig. 8), but very sensitive to voxel size (Fig. 6). As dis-cussed above, the best grid should be that which maximizes plant lacunarity taken into account by space discretization, so that intravoxel variance of LAD is minimal and Beer’s law holds at voxel scale. Unfortunately plant lacunarity cannot generally be estimated a priori, as we made here from 3-D digitizing data. Decreasing voxel size generally increases the fraction of canopy lacunarity accounted for by the space division into voxels, because real plants behave as statistical fractal objects (Figs 3a & 4a). There is however, a limit in decreasing voxel size (Knyazikhin et al. 1997), according to leaf size (see Eqn 11). As shown in the range of tree canopies used in this study, the optimal voxel size is the minimal one allowed by leaf size constraints (Fig. 9).
exp -
( )
xi £exp(-xi)CONCLUSION
Three-dimension digitized trees were used to assess the relative contribution of three sources of non-randomness of leaf dispersion within the canopy volume. The spatial distribution of leaf area density in the canopy accounted for most of departure from random leaf dispersion at can-opy scale, while trees exhibited almost local random leaf dispersion and leaf size had also a minor effect on light interception. STAR computations from a 3-D turbid medium model were very sensitive to voxel size, and were closely related to the variance of LAD taken into account by space discretization.
The next step should be to explicitly include canopy lacunarity in a turbid medium model at canopy (i.e. bound-ing box) scale, without any 3-D discretization of the canopy volume. On one hand, this has already been proposed for small LAD fluctuations by using the Reynolds decomposi-tion to both the radiadecomposi-tion field and the canopy structure parameters in the general equation of radiation transfer (Menzhulin & Anisimov 1991; Anisimov & Fukhansky 1993). On the other hand, Nilson (1971) proposed in his pioneer work to relate leaf dispersion to the variance of number of contacts in the canopy. As the mean number of contacts is related to leaf area index, one can expect explicit relationships between canopy lacunarity, leaf dispersion and light interception by isolated trees.
ACKNOWLEDGMENTS
The authors are grateful to D. Combes (INRA-Lusignan, France) for 3-D digitizing data of walnut tree and contribu-tion to peach tree digitizing, and to P. Kasemsap and S. Thanisawanyangkura (Kasetsart University, Bangkok, Thailand) for contribution to mango tree digitizing. Finan-cial support from PFI programme of INRA was provided for peach digitizing, while peach trees were made available by CTIFL, Balandran.
REFERENCES
Adam B., Donès N. & Sinoquet H. (2002) VegeSTAR –. Software to compute light interception and canopy photosynthesis from images of 3D digitised plants, Version 3.0. UMR PIAF INRA-UBP, Clermont-Ferrand, France.
Allain C. & Cloitre M. (1991) Characterizing the lacunarity of random and deterministic fractal sets. Physical Review A 44, 3552–3558.
Andrieu B. & Sinoquet H. (1993) Evaluation of structure descrip-tion requirements for predicting gap fracdescrip-tion of vegetadescrip-tion can-opies. Agricultural and Forest Meteorology 65, 207–227. Anisimov O. & Fukhansky L. (1993) Light – vegetation
interac-tion: a new stochastic approach for description and classification. Agricultural and Forest Meteorology 66, 93–110.
Barnsley M.F. (1988) Fractals Everywhere. Academic Press, Bos-ton, MA, USA.
Bégué A., Prince S.D., Hanan N.P. & Roujean J.L. (1996) Short-wave radiation budget of sahelian vegetation.2. Radiative trans-fer models. Agricultural and Forest Meteorology 79, 97–112. Boudon F., Pradal C., Nouguier C. & Godin C. (2001) GEOM
Foliage dispersion in 3-D digitized trees 1169
du Programme Modélisation des plantes, 4–2001. CIRAD, Mont-pellier, France.
Chen J.M. (1996) Optically-based methods for measuring seasonal variation of leaf area index in boreal conifer stands. Agricultural and Forest Meteorology 80, 135–163.
Chen S.G., Impens I., Ceulemans R. & Kockelbergh F. (1993) Measurement of gap fraction of fractal generated canopies using digitalized image analysis. Agricultural and Forest Meteorology 65, 245–259.
Cohen S. & Fuchs M. (1987) The distribution of leaf area, radia-tion, photosynthesis and transpiration in a Shamouti orange hedgerow orchard. I. Leaf area and radiation. Agricultural and Forest Meteorology 40, 123–144.
Cohen S., Mosoni P. & Meron M. (1995) Canopy clumpiness and radiation penetration in a young hedgerow apple orchard. Agri-cultural and Forest Meteorology 76, 185–200.
Davis A.B. & Marshak A. (2004) Photon propagation in hetero-geneous optical media with spatial correlations: enhanced mean-free-paths and wider than exponential free-path distributions. Journal of Quantitative Spectroscopy and Radiative Transfer 84, 3–34.
De Castro F. & Fetcher N. (1999) The effect of leaf clustering in the interception of light in vegetal canopies: theoretical consid-erations. Ecological Modelling 116, 125–134.
Den Dulk J.A. (1989) The interpretation of remote sensing, a feasibility study. Thesis, Wageningen University, Wageningen, The Netherlands.
Falster D.S. & Westoby M. (2003) Leaf size and angle vary widely across species: what consequences for light interception? New Phytologist 158, 509–525.
Farque L., Sinoquet H. & Colin F. (2001) Canopy structure and light interception in Quercus petraea (Matt.) Liebl. seedlings in relation to light regime and plant density. Tree Physiology 21, 1257–1267.
Foroutan-Pour K., Dutilleul P. & Smith D.L. (2001) Inclusion of the fractal dimension of leafless plant structure in the Beer-Lambert law. Agronomy Journal 93, 333–338.
Fukai S. & Loomis R.S. (1976) Leaf display and light environments in row-planted cotton communities. Agricultural Meteorology 17, 353–379.
Kimes D.S. & Kirchner J.A. (1982) Radiative transfer model for heterogeneous 3D scenes. Applied Optics 21, 4119–4129. Knyazikhin Y., Miessen G., Panfyorov O. & Gravenhorst G.
(1997) Small-scale study of three-dimensional distribution of photosynthetically active radiation in a forest. Agricultural and Forest Meteorology 88, 215–239.
Kucharik C.J., Norman J.M. & Gower S.T. (1999) Characteriza-tion of radiaCharacteriza-tion regimes in non-random forest canopies: theory, measurements, and a simplified modelling approach. Tree Phys-iology 19, 695–706.
Lang A.R.G. & Yueqin X. (1986) Estimation of leaf area index from transmission of direct sunlight in discontinuous canopies. Agricultural and Forest Meteorology 37, 229–243.
Mandelbrot B.B. (1983) The Fractal Geometry of Nature. Freeman, New York, USA.
Menzhulin G.V. & Anisimov O. (1991) Principles of statistical phytoactinometry. In Photon–Vegetation Interactions (eds R.B. Myneni & J.K. Ross), pp. 111–137. Springer, Berlin, Germany.
Moon P. & Spencer D.E. (1942) Illumination from a non-uniform sky. Transactions of the Illumination Engineering Society 37, 707–712.
Myneni R.B. (1991) Modeling radiative transfer and photosynthe-sis in three-dimensional vegetation canopies. Agricultural and Forest Meteorology 55, 323–344.
Myneni R.B., Ross J. & Asrar G. (1989) A review of the photon
transport in leaf canopies. Agricultural and Forest Meteorology 45, 1–153.
Niinemets U., Al Afas N., Cescatti A., Pellis A. & Ceulemans R. (2004) Petiole length and biomass investment in support modify light interception efficiency in dense poplar plantations. Tree Physiology 24, 141–154.
Nilson T. (1971) A theoretical analysis of the frequency of gaps in plant stands. Agricultural Meteorology 8, 25–38.
Nilson T. & Ross J. (1997) Modeling radiative transfer through forest canopies: Implications for canopy photosynthesis and remote sensing. In The Use of Remote Sensing in the Modeling of Forest Productivity (eds H.L. Gholz, K. Nakane & H. Shi-moda), pp. 23–60. Kluwer Academic Publishing, Dordrecht, The Netherlands.
Norman J.M. & Jarvis P.G. (1975) Photosynthesis in Sitka spruce (Picea sitchensis (bong.) carr.). V. Radiation penetration theory and a test case. Journal of Applied Ecology 12, 839–878. Norman J.M. & Welles J.M. (1983) Radiative transfer in an array
of canopies. Agronomy Journal 75, 481–488.
Oker-Blom P. & Kellomäki S. (1983) Effect of grouping of foliage on the within stand and within-crown light regime: comparison of random and grouping canopy models. Agricultural and Forest Meteorology 28, 143–155.
Oker-Blom P. & Smolander H. (1988) The ratio of shoot silhouette area to total needle area in Scots pine. Forest Science 34, 894– 906.
Pinty B., Gobron N., Widlowski J.L. et al. (2001) Radiation trans-fer model intercomparison (RAMI) exercise. Journal of Geo-physical Research 106, 11937–11956.
Planchais I. & Sinoquet H. (1998) Foliage determinants of light interception in sunny and shaded branches of Fagus sylvatica (L.). Agricultural and Forest Meteorology 89, 241–253. Plotnick R.E., Gardner R.H., Hargrove W.W., Prestegaard K. &
Perlmutter M. (1996) Lacunarity analysis: a general technique for the analysis of spatial patterns. Physical Review E 53, 5461– 5468.
Prusinkiewicz P. (1998) Modeling of spatial structure and deve-lopment of plant: a review. Scientia Horticulturae 74, 113–149. Ross J. (1981) The Radiation Regime and Architecture of Plant
Stands. Dr W.Junk Publishers, The Hague, The Netherlands. Sinoquet H., Le Roux X., Adam B., Améglio T. & Daudet F.A.
(2001) RATP, a model for simulating the spatial distribution of radiation absorption, transpiration and photosynthesis within canopies: application to an isolated tree crown. Plant, Cell and Environment 24, 395–406.
Sinoquet H. & Rivet P. (1997) Measurement and visualisation of the architecture of an adult tree based on a three-dimensional digitising device. Trees: Structure and Function 11, 265–270. Sinoquet H., Thanisawanyangkura S., Mabrouk H. & Kasemsap P.
(1998) Characterisation of light interception in canopies using 3D digitising and image processing. Annals of Botany 82, 203– 212.
Sinoquet H., Varlet-Grancher C. & Bonhomme R. (1993) Model-ling radiative transfer within homogeneous canopies: basic concepts. In Crop Structure and Light Microclimate: Character-ization and Applications (eds C. Varlet-Grancher, R. Bonho-mme & H. Sinoquet) Science Update Series, pp. 207–228. INRA Editions, Paris, France.
Sonohat G., Sinoquet H., Kulandaivelu V., Combes D. & Lescour-ret F. (2004) Three-dimensional reconstruction of partially 3D digitised peach tree canopies. Proceedings of the 4th Interna-tional Workshop on FuncInterna-tional-Structural Plant Models, 7–11 June, Montpellier, France, pp. 6–8. UMR AMAP, Montpellier, France.
Stenberg P., Smolander H. & Kellomäki S. (1993) Description of crown structure for light interception models: angular and
spa-1170 H. Sinoquet et al.
tial distribution of shoots in young Scots pine. Studia Forestalia Suedica 191, 843–850.
Takenaka A. (1994) Effects of leaf blade narrowness and petiole length on the light capture efficiency of a shoot. Ecological Research 9, 109–114.
Thanisawanyangkura S., Sinoquet H., Rivet P., Crétenet M. & Jallas E. (1997) Leaf orientation and sunlit leaf area distribution in cotton. Agricultural and Forest Meteorology 86, 1–15. Thorpe M.R., Saugier B., Auger S., Berger A. & Méthy M. (1978)
Photosynthesis and transpiration of an isolated tree: model and validation. Plant, Cell and Environment 1, 269–277.
Varlet-Grancher C., Bonhomme R. & Sinoquet H. (eds) (1993) Crop Structure and Light Microclimate: Characterization and Applications. Science Update Series. INRA Editions, Paris, France.
Whitehead D., Grace J.C. & Godfrey M.J.S. (1990) Architectural distribution of foliage of individual Pinus radiata D. Don crowns and the effects of clumping on radiation interception. Tree Phys-iology 7, 135–155.
Received 5 January 2005; received in revised form 22 February 2005; accepted for publication 4 March 2005