Supporting Information
Stabilizing double perovskite for effective bifunctional oxygen
electrocatalysis in alkaline conditions
Bin Hua a, Yi-Fei Sun a, Meng Li a, Ning Yan b, *, Jian Chen c, Ya-Qian Zhang a, Yimin Zeng d, Babak Shalchi Amirkhiz d, Jing-Li Luo a, *
a Department of Chemical and Materials Engineering, University of Alberta, Edmonton, Alberta T6G 1H9, Canada. [email protected] (J.-L. Luo)
b Van’t Hoff Institute for Molecular Sciences (HIMS), University of Amsterdam, Amsterdam, 1098XH, The Netherlands. [email protected] (N. Yan)
c National Institution of Nanotechnology, National Research Council, Edmonton, Alberta T6G 2M9, Canada.
d Canmet MATERIALS, Natural Resources Canada, Hamilton, Ontario, L8P 0A5, Canada.
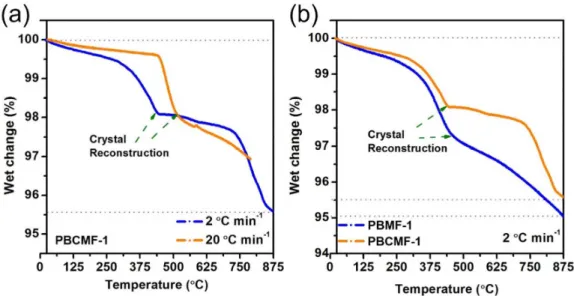
Figure S2. TGA tests of PBCFM-1 and PBMF-1 in 10% H2-90% N2, showing that the
structures of air-prepared PBCMF-1 and PBMF-1 could be tuned by treating in H2.
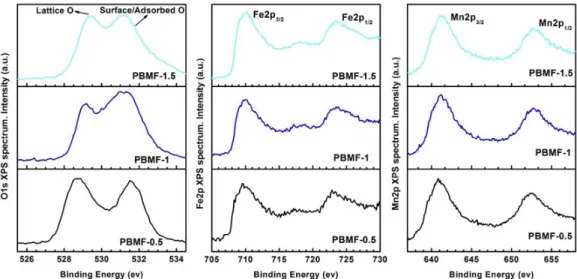
Figure S3. O1s, Fe2p and Mn2p XPS binding energies of PBMF-1.5, PBMF-1, PBMF-0.5 samples.
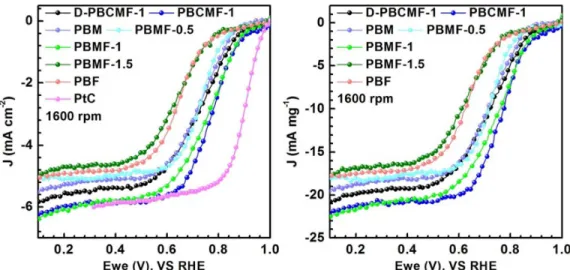
Figure S4. Comparison of the LSV curves (1600 rpm) for various catalysts during ORR at the initial stage in O2-saturated 0.1 M KOH.
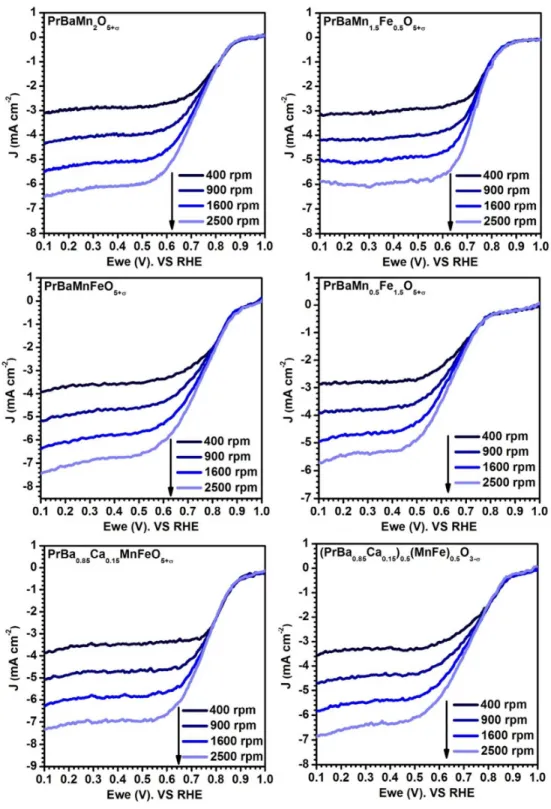
Figure S5. The LSV curves of various catalysts test from 400 to 2500 rpm in O2-saturated 0.1 M KOH.
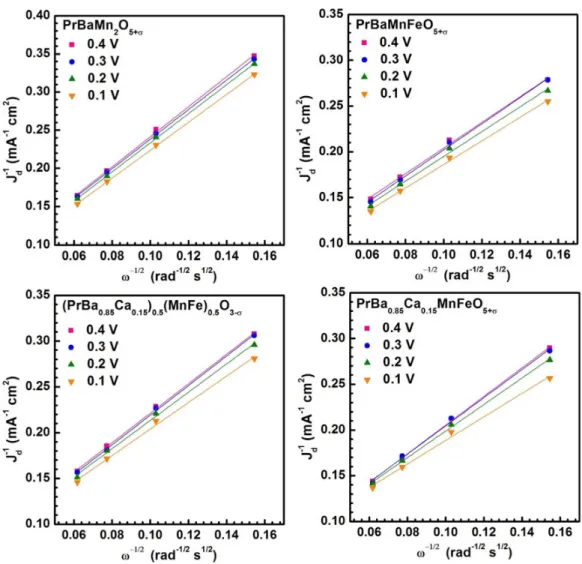
Figure S6. It is calculated that the electron transfers number during the ORRs are closed to 4, suggesting that the ORRs on the prepared perovskites are four-electron reaction. The calculated numbers of electron-transferred for PBM ranged from 3.8 to 3.9 at the selected voltages. The calculated numbers of electron-transferred for PBMF-1 ranged from 4.1 to 4.2 at the selected voltages. The calculated numbers of electron-transferred for D-PBCMF-1 ranged from 3.9 to 4.1 at the selected voltages.
Figure S7. The LSV curves for various catalysts for OER in Ar-saturated KOH; The LSV curves for carbon black for OER in Ar-saturated KOH; Comparison of the LSV curves for PBCMF-1 catalysts in Ar-saturated KOH and in O2-saturated KOH.
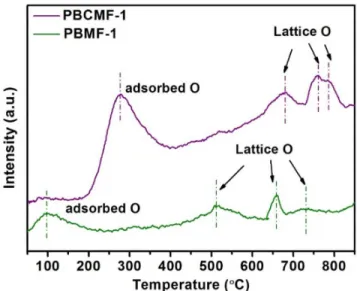
Figure S8. O2-TPD test of PBCMF-1 and PBMF-1 powders. The peaks are related to
the oxygen desorption process over the catalyst. It is seen that adsorbed oxygen species and lattice oxygen atoms harder to be removed from the PBCMF-1 sample than the PBMF-1 sample.
Figure S9. ORR (a and b) and OER (c and d) stability test of the PBMF-1 and PBCMF-1 catalysts, showing the LSV curves before and after 1000 cycles CV tests.
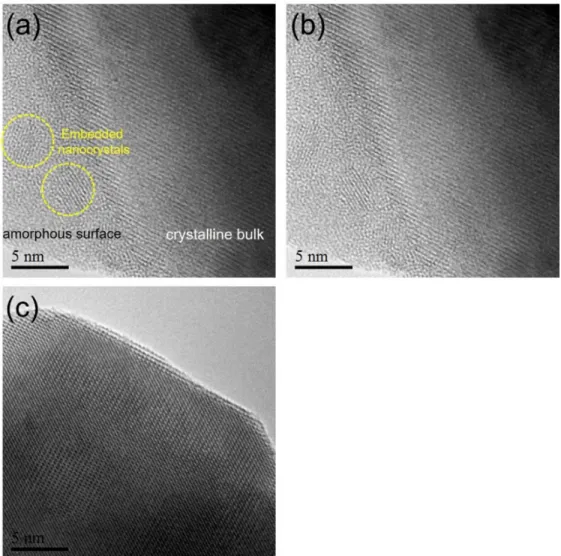
Figure S10. (a) and (b) The marked and unmarked HR-TEM images of PBMF-1 after stability test in OER condition, showing the surface amorphous phase and decomposing residues; (c) The HR-TEM images of PBMF-1 after being steeped in the KOH solution for 24 h.
Figure S11. TEM-EDX image of PBMF-1 sample after 1000 cycles CV stability test in water oxidation regime. We found Pr and Fe containing nanoparticles, evidencing the decomposition of the material.
Figure S12. SEM images for (a, b) PBMF-0.5, (c, d) PBMF-1 and (e, f) PBMF-1.5 powders.
Table S1. Summary sheet of the prepared catalysts in this study
Cation ordered PrBaFe2O5+δ Cation ordered PrBaMn0.5Fe1.5O5+δ
Cation ordered PrBaMn2O5+δ Cation disordered (PrBa0.85Ca0.15)0.5(MnFe)0.5O3–δ
Cation ordered PrBaMnFeO5+δ Cation ordered PrBa0.85Ca0.15MnFeO5+δ
Table S2. Refined structural parameters for (PrBa0.85Ca0.15)0.5(MnFe)0.5O3–δ and
PrBa0.85Ca0.15MnFeO5+δ
D-PBCMF PBCMF
Space group Pm3ത m (cubic) P4/nmm (tetra)
a = b (Å) 3.94678 4.03012 c (Å) 3.94678 7.91211 Χ2 1.423 1.562 Rp (%) 7.803 6.931 Rwp (%) 10.189 8.257
Table S3. BET specific surface area of various catalysts
Sample name BET specific area (m2 g–1)
PrBaFe2O5+δ 6.32
PrBaMn2O5+δ 8.45
PrBaMnFeO5+δ 8.32
(PrBa0.85Ca0.15)0.5(MnFe)0.5O3–δ 7.89
PrBa0.85Ca0.15MnFeO5+δ 8.51
It is seen that the surface areas of these samples are very close. The specific area of (PrBa0.85Ca0.15)0.5(MnFe)0.5O3–δ increased after crystal reconstruction.
Table S4. XPS deconvolution results for PBMF-1.5, PBMF-1, PBMF-0.5 samples.
Sample Lattice O/surface O Fe3+/Fe4+ Mn2+/Mn3+/Mn4+
PBMF-1.5 55/45 60/40 15/67/18
PBMF-1 42/58 62/38 17/65/18
Table S5. Nonstoichiometric oxygen for various catalysts
Cation distribution Materials Oxygen content
Cation ordered PrBaFe2O5+δ 5+δ = 5.71
Cation ordered PrBaMn2O5+δ 5+δ = 5.75
Cation ordered PrBaMnFeO5+δ 5+δ = 5.70
Cation disordered (PrBa0.85Ca0.15)0.5(MnFe)0.5O3–δ 3–δ = 2.95
Cation ordered PrBa0.85Ca0.15MnFeO5+δ 5+δ = 5.67
From the nonstoichiometric oxygen analysis, it was found that the numbers of oxygen deficiencies in (PrBa0.85Ca0.15)0.5(MnFe)0.5O3–δ sample increased after crystal
reconstruction. The increased oxygen deficiencies also contributed to the oxygen catalysis process.
Table S6. Comparison of the ORR on the oxide electrocatalysts in this work and other oxides in the literature.
Materials Journal, Year, volume, first page E1/2 vs RHE Eonset vs RHE n Electrolyte
MnCo2O4/N-rmGO J. Am. Chem. Soc., 2012, 134, 3517 0.88 V 0.93 V ~3.9 0.1 M KOH
PrBa0.85Ca0.15MnFeO5+δ This study 0.768 V 0.9 V 3.85 0.1 M KOH
N:C-MgNTA Chem. Eur. J., 2016, 22, 501-5 0.75 V 0.89 V ~4 0.1 M KOH
N, S, O-doped mesoporous carbon J. Am. Chem. Soc., 2014 136, 8875 0.75 V 0.85 V ~3.5 0.1 M KOH
Nanostructured Mn oxide J. Am. Chem. Soc., 2010, 132, 13612 0.75 V ~0.85 V N/A 0.1 M KOH
LT-Li0.5CoO2 Nat. Commun., 2014, 5, 3949 0.68 V ~0.8 V N/A 0.1 M KOH
LaCu0.5Mn0.5O3 Nat. Chem. 2011, 3, 546 0.64 V ~0.8 V ~4 0.1 M KOH
Table S7. Comparison of the OER on the catalysts in this work and other oxides in the literature.
Materials Journal, Year, volume, first page Eonset vs RHE η@10 mA cm
-2
Tafel slope Electrolyte
PrBa0.5Sr0.5Co1.5Fe0.5O5+δ Nat. Commun. 2017, 8, 10.1038 ~1.52 V 0.358 V 52 mV dec–1 0.1 M KOH (O2)
PrBa0.85Ca0.15MnFeO5+δ This study 1.52 V 0.40 V 88 mV dec–1 0.1 M KOH (O2)
PrBa0.85Ca0.15MnFeO5+δ This study 1.52 V 0.408 V 86 mV dec–1 0.1 M KOH (Ar)
BM-SrNb0.1Co0.7Fe0.2O3−δ Angew. Chem. Int. Ed. 2015, 54, 3897 1.49 V 0.42 V 76 mV dec–1 0.1 M KOH (O2)
nsLaNiO3/NC J. Phys. Chem. Lett. 2013, 4, 1254 1.56 V 0.43V N/A 0.1 M KOH (Ar)
80nm LaCoO3 Nat. Commun. 2016, 7, 11510 ~1.55 V 0.49 V 79 mV dec–1 0.1 M KOH (O2)
MnCoFeO4/N-rGO J. Mater. Chem. A 2014, 2, 16217 ~1.65 V 0.48V N/A 0.1 M KOH (O2)
Bulk LaCoO3 Nat. Commun. 2016, 7, 11510 ~1.60 V 0.62 V 102 mV dec–1 0.1 M KOH (O2)
Ba0.5Sr0.5Co0.8Fe0.2O3−δ Angew. Chem. Int. Ed. 2015, 54, 3897 ~1.50 V 0.51 V 94 mV dec–1 0.1 M KOH (Ar)