HAL Id: hal-00297771
https://hal.archives-ouvertes.fr/hal-00297771
Submitted on 15 Jul 2005HAL is a multi-disciplinary open access
archive for the deposit and dissemination of sci-entific research documents, whether they are pub-lished or not. The documents may come from teaching and research institutions in France or abroad, or from public or private research centers.
L’archive ouverte pluridisciplinaire HAL, est destinée au dépôt et à la diffusion de documents scientifiques de niveau recherche, publiés ou non, émanant des établissements d’enseignement et de recherche français ou étrangers, des laboratoires publics ou privés.
Inventories of N2O and NO emissions from European
forest soils
M. Kesik, P. Ambus, R. Baritz, N. Brüggemann, K. Butterbach-Bahl, M.
Damm, J. Duyzer, L. Horváth, R. Kiese, B. Kitzler, et al.
To cite this version:
M. Kesik, P. Ambus, R. Baritz, N. Brüggemann, K. Butterbach-Bahl, et al.. Inventories of N2O and NO emissions from European forest soils. Biogeosciences Discussions, European Geosciences Union, 2005, 2 (4), pp.779-827. �hal-00297771�
BGD
2, 779–827, 2005
Inventories of N2O and NO emissions from European forest
soils M. Kesik et al. Title Page Abstract Introduction Conclusions References Tables Figures J I J I Back Close
Full Screen / Esc
Print Version Interactive Discussion EGU Biogeosciences Discussions, 2, 779–827, 2005 www.biogeosciences.net/bgd/2/779/ SRef-ID: 1810-6285/bgd/2005-2-779 European Geosciences Union
Biogeosciences Discussions
Biogeosciences Discussions is the access reviewed discussion forum of Biogeosciences
Inventories of N
2
O and NO emissions
from European forest soils
M. Kesik1, P. Ambus2, R. Baritz3, N. Br ¨uggemann1, K. Butterbach-Bahl1, M. Damm1, J. Duyzer4, L. Horv ´ath5, R. Kiese1, B. Kitzler6, A. Leip7, C. Li8, M. Pihlatie9, K. Pilegaard2, G. Seufert7, D. Simpson10, U. Skiba11, G. Smiatek1, T. Vesala9, and S. Zechmeister-Boltenstern6
1
Karlsruhe Res. Centre, Inst. Meteorology and Climate Research, Atmospheric Environmental Research (IMK-IFU), Kreuzeckbahnstr. 19, 82467 Garmisch-Partenkirchen, Germany
2
Risoe National Lab., Department for Plant Biology and Biogeochemistry, Risø, Denmark
3
Federal Institute for Geosciences and Natural Resources (BGR), Hannover, Germany
4
The Netherlands Organization for Applied Scientific Research, Apeldoorn, Netherlands
5
Hungarian Meteorological Service, Dept. for Analysis of Atmospheric Environment, Budapest, Hungary
6
Federal Forest Research Centre, Inst. Forest Ecology and Soil, Soil Biology, Vienna, Austria
7
Commission of the European Communities, Environmental Institute, JRC Ispra, Italy
8
Institute for the Study of Earth, Oceans and Space, Univ. New Hampshire, Durham, USA © 2005 Author(s). This work is licensed under a Creative Commons License.
BGD
2, 779–827, 2005
Inventories of N2O and NO emissions from European forest
soils M. Kesik et al. Title Page Abstract Introduction Conclusions References Tables Figures J I J I Back Close
Full Screen / Esc
Print Version Interactive Discussion
9
University of Helsinki, Department of Physical Sciences, Helsinki, Finland
10
Norwegian Meteorology Institute, Oslo, Norway
11
Natural Environment Research Council, Centre for Ecology and Hydrology, Edinburgh, UK Received: 9 June 2005 – accepted: 23 June 2005 – Published:
BGD
2, 779–827, 2005
Inventories of N2O and NO emissions from European forest
soils M. Kesik et al. Title Page Abstract Introduction Conclusions References Tables Figures J I J I Back Close
Full Screen / Esc
Print Version Interactive Discussion
EGU
Abstract
Forest soils are a significant source for the primary and secondary greenhouse gases N2O and NO. However, current estimates are still uncertain due to the still limited number of field measurements and the herein observed pronounced variability of N trace gas fluxes in space and time, which are due to the variation
5
of environmental factors such as soil and vegetation properties or meteorological conditions. To overcome these problems we further developed a process-oriented model, the PnET-N-DNDC model, which simulates the N trace gas exchange on the basis of the processes involved in production, consumption and emission of N trace gases. This model was validated against field observations of N trace gas fluxes from
10
19 sites obtained within the EU project NOFRETETE, and shown to perform well for N2O (r2=0.68, slope=0.76) and NO (r2=0.78, slope=0.73). For the calculation of a European-wide emission inventory we linked the model to a detailed, regionally and temporally resolved database, comprising climatic properties (daily resolution), and soil parameters, and information on forest areas and types for the years 1990, 1995
15
and 2000. Our calculations show that N trace gas fluxes from forest soils may vary substantial from year to year and that distinct regional patterns can be observed. Our central estimate of NO emissions from forest soils in the EU amounts to 98.4, 84.9 and 99.2 kt N yr−1, using meteorology from 1990, 1995 and year 2000, respectively. This is <1.0% of pyrogenic NOx emissions. For N2O emissions the central estimates
20
were 86.8, 77.6 and 81.6 kt N yr−1, respectively, which is approx. 14.5% of the source strength coming from agricultural soils. An extensive sensitivity analysis was conducted which showed a range in NO emissions from 44.4 to 254.0 kt N yr−1for NO and 50.7 to 96.9 kt N yr−1for N2O, for year 2000 meteorology.
The results show that process-oriented models coupled to a GIS are useful tools
25
for the calculation of regional, national, or global inventories of biogenic N-trace gas emissions from soils. This work represents the most comprehensive effort to date to simulate NO and N2O emissions from European forest soils.
BGD
2, 779–827, 2005
Inventories of N2O and NO emissions from European forest
soils M. Kesik et al. Title Page Abstract Introduction Conclusions References Tables Figures J I J I Back Close
Full Screen / Esc
Print Version Interactive Discussion
1. Introduction
The atmospheric concentration of nitrous oxide (N2O) has been increasing in recent decades with a rate of approx. 0.25% yr−1 (IPCC, 2001). Among other sources, forest soils have been acknowledged to represent significant sources of this potent greenhouse gas (e.g. Schmidt et al., 1988; Skiba et al., 1994). Emissions of N2O
5
from forest soils have most likely increased in recent decades and will probably further increase in the future due to the anthropogenic perturbation of the global N cycle (Galloway et al., 2004) and hence high rates of atmospheric N deposition to many forest ecosystems in Europe, North America and Asia (Aber et al., 1989; Bowden et al., 1991). In a series of recent publications evidence has been provided that N
10
deposition to forest ecosystems are positively correlated with N2O emissions (Brumme and Beese, 1992; Butterbach-Bahl et al., 1998; Zechmeister-Boltenstern et al., 2002). On a global scale soils have been identified as sources of atmospheric NOx of a comparable magnitude like combustion processes (Davidson and Kingerlee, 1997). This especially applies to acidic forest soils, which have been shown to act primarily as
15
sources of NO, a reactive trace gas involved in the production of tropospheric ozone (Williams et al., 1992; Butterbach-Bahl et al., 2002a). However, due to its reactivity only a part of the NO emitted from forest soils will reach the atmosphere, whereas some of the NO will react with ozone to NO2, associated with a partial re-deposition of NO2to plant and soil surfaces or an uptake by plant tissues (Duyzer and Fowler, 1994;
20
Meixner, 1994; Gessler et al., 2001; Dorsey et al., 2004). As for N2O, atmospheric N deposition to forest ecosystems has been shown to be closely related to the source strength of forest soils for NO (Gasche and Papen, 1999; Pilegaard et al., 1999; Van Dijk and Duyzer, 1999).
The emission of NO and N2O from forest soils is mainly the result of simultaneously
25
occurring production and consumption processes, most of which are directly linked to the microbial N turnover processes of nitrification and denitrification (Conrad, 1996, 2002). With regard to NO also the abiotic process of chemo-denitrification, during
BGD
2, 779–827, 2005
Inventories of N2O and NO emissions from European forest
soils M. Kesik et al. Title Page Abstract Introduction Conclusions References Tables Figures J I J I Back Close
Full Screen / Esc
Print Version Interactive Discussion
EGU which biologically produced nitrite is chemically decomposed to NO, has been shown to
be an important production process in soils at pH values lower than 4.0 (Van Cleemput and Baert, 1984). Like most other biological processes, microbial turnover processes vary largely on spatial and temporal scales, since they are significantly influenced by a number of environmental factors such as climate and meteorological conditions, soil
5
and vegetation properties or human management of the land surface. Due to this also the emission of N trace gases from forest soils have been observed to vary over several orders of magnitudes between seasons, years or measuring sites (Papen and Butterbach-Bahl, 1999; Brumme et al., 1999; Butterbach-Bahl et al., 2002b). This variability is the reason for the still high uncertainty of current regional and global
10
estimates of N trace gas emissions from soils. In recent years it has been proposed that linking process-oriented models, which are able to simulate the processes involved in N trace gas emissions from soils, to detailed GIS databases, holding explicit spatial information on major drivers of microbial processes, can serve as tools to improve current estimates of the magnitude of terrestrial sources and sinks of atmospheric trace
15
gases (Brown et al., 2002).
This approach, i.e. the use of process-oriented biogeochemical models for calculating inventories of N trace gas emissions from soils, was also followed within the EU funded project NOFRETETE (Nitrogen Oxides Emissions from European Forest Ecosystems). This manuscript provides details of model modifications, model testing
20
and the establishment of a GIS database which was finally used to initialize and drive the PnET-N-DNDC model for the calculation of inventories of N-trace gas emissions of forest soils of Europe. It represents the most comprehensive effort to date to simulate NO and N2O emissions from European forest soils.
BGD
2, 779–827, 2005
Inventories of N2O and NO emissions from European forest
soils M. Kesik et al. Title Page Abstract Introduction Conclusions References Tables Figures J I J I Back Close
Full Screen / Esc
Print Version Interactive Discussion
2. Materials and methods
2.1. The PnET-N-DNDC model
For the calculation of N2O and NO emission inventories of European forest soils the biogeochemical model PnET-N-DNDC was used. The model has been already applied for regional emission inventories for temperate forest ecosystems (Butterbach-Bahl
5
et al., 2001, 2004), and recently, after some adaptation, also for the calculation of a N2O emission inventory for tropical rainforests in Australia (Kiese et al., 2005). The PnET-N-DNDC model was developed to predict soil carbon and nitrogen biogeochemistry in temperate forest ecosystems and to simulate the emissions of N2O and NO from forest soils (Li et al., 2000; Stange et al., 2000). The model is
10
mainly based on the PnET model (=Photosynthesis-Evapotranspiration-Model), the DNDC model (=Denitrification-Decomposition-Model) and a nitrification module. The PnET model is a forest physiology model used for predicting forest photosynthesis, respiration, organic carbon production and allocation, and litter production. It was originally developed by Aber and Federer (1992). This model has already been used
15
in regional studies in order to predict the sensitivity of forest production to climate variability and site quality (e.g. Goodale et al., 1998). DNDC is a soil biogeochemistry model used for predicting soil organic matter decomposition, nitrogen turnover and N2O production in agricultural soils (Li et al., 1992). This model has also been used to predict regional N2O emissions from agriculture in US, China and UK (Li et al., 1996,
20
2001, 2004; Brown et al., 2002). The nitrification module was developed by Stange (2000) in order to simulate nitrification rates, the growth of nitrifier populations and the nitrification induced N2O and NO emissions associated with nitrification.
In the PnET-N-DNDC model N2O and NO emissions from soils are directly influenced by environmental factors, such as soil temperature and moisture, pH and substrate
25
availability (C- and N-content). These environmental factors are driven by different ecological drivers, namely climate, soil properties, vegetation and anthropogenic activities. Five modules for predicting forest growth, soil climate, decomposition,
BGD
2, 779–827, 2005
Inventories of N2O and NO emissions from European forest
soils M. Kesik et al. Title Page Abstract Introduction Conclusions References Tables Figures J I J I Back Close
Full Screen / Esc
Print Version Interactive Discussion
EGU nitrification and denitrification are linked to translate the environmental factors and
ecological drivers into predicted N2O and NO emissions. The functions of the different modules are as follows: a) the soil climate module is used to convert daily climate data into soil temperature and moisture profiles and to calculate soil oxygen availability in the forest soil profile; b) the forest growth module simulates forest growth as a function of
5
solar radiation, temperature, water and N availability. The forest growth module is linked to the soil climate and decomposition modules via litter production and water and N demand; c) the decomposition module simulates the turnover of litter and other organic matter and, hence, the production of ammonium, nitrate and dissolved organic carbon (DOC) in the soil driven by temperature, moisture and O2availability in the soil profile;
10
d) the nitrification module predicts growth and death of nitrifiers, the nitrification rate as well as N2O and NO production during nitrification depending on soil temperature, moisture, ammonium and DOC concentrations; e) depending on the population size of denitrifiers, soil temperature, moisture and substrate concentrations (DOC, NO−3, NO−2, NO and N2O), the denitrification module simulates the individual steps of the sequential
15
reduction of nitrate or other oxidized N compounds (NO−2, NO, N2O) to the final product N2.
The nitrification and denitrification induced N2O and NO fluxes are calculated based on the dynamics of soil aeration status, substrate supply and gas diffusion. Chemo-denitrification, i.e. chemical decomposition of NO−2 to NO, is considered as
20
another source of NO production in soils. This chemical reaction is controlled by the concentration of nitrite in the soil, soil pH and temperature. To handle the problem of simultaneously occurring aerobic and anaerobic processes in adjacent microsites, the PnET-N-DNDC model uses the concept of a so-called “anaerobic balloon”. Based on the O2 diffusion from the atmosphere into the soil and the O2consumption during
25
heterotrophic and autotrophic respiration the O2concentration is calculated for a given soil layer. The O2 concentration is assumed to be reciprocally proportional to the anaerobic fraction within this soil layer (Li et al., 2000). For further details on the PnET-N-DNDC model we refer to Li et al. (1992, 1996, 2000), Li (2000), Stange et
BGD
2, 779–827, 2005
Inventories of N2O and NO emissions from European forest
soils M. Kesik et al. Title Page Abstract Introduction Conclusions References Tables Figures J I J I Back Close
Full Screen / Esc
Print Version Interactive Discussion
al. (2000), Butterbach-Bahl et al. (2001, 2004) and Kiese et al. (2005).
To simulate N trace gas emissions for a specific site the PnET-N-DNDC requires the following input parameters: daily climate data (precipitation, minimum and maximum air temperature, optional: radiation), soil properties (texture, clay content, pH, soil organic carbon content, stone content, humus type), and forest data (forest type and
5
age, above-ground and below-ground biomass, plant physiology parameters). The PnET-N-DNDC is currently parameterized for 12 tree species/genera, i.e. pine, spruce, hemlock, fir, hardwoods, oak, birch, beech, slash pine, larch, cypress and evergreen oak. Whenever there are no site-specific forest data available except for the forest type and age, the model calculates with default values for each forest type taken from an
10
internal database of literature data (Li et al., 2000). Furthermore, the model needs information about inorganic N concentrations in rainfall which are used to calculate throughfall values for N, a surrogate of wet and dry deposition, in dependency of forest type and N concentration (Li et al., 2000).
No structural changes were applied to the PnET-N-DNDC model for its use within
15
the NOFRETETE project. However, based on results from laboratory studies by Kesik et al. (2005)1 the parameterisation of NO production by chemo-denitrification (Chem NO, kg N ha−1day−1) in dependency on the soil pH (soil pH, layer) and the nitrite concentration (NO2, kg N ha−1 layer−1) in the respective soil layers was changed as follows:
20
Chem NO=300 × NO2× 16565 × exp(−1.62×soil pH)×f 1
f1 is an Arrhenius type function describing the temperature dependency (temp, layer) of chemo-denitrification:
f 1= exp((temp+273.18)×8.3144−31494 ) (Stange, 2000)
1
Kesik, M., Blagodatsky, S., Papen, H., and Butterbach-Bahl, K.: Effect of pH, temperature and substrate on N2O, NO and CO2production by Alcaligenes faecalis p., J. Applied Microb., submitted, 2005.
BGD
2, 779–827, 2005
Inventories of N2O and NO emissions from European forest
soils M. Kesik et al. Title Page Abstract Introduction Conclusions References Tables Figures J I J I Back Close
Full Screen / Esc
Print Version Interactive Discussion
EGU Furthermore, the parameters for the moisture dependency of gross nitrification and
N2O and NO production and consumption during nitrification and denitrification (see Li et al., 2000) were optimised according to the results from laboratory studies (see Schindelbacher et al., 2004; Kesik et al., 20051).
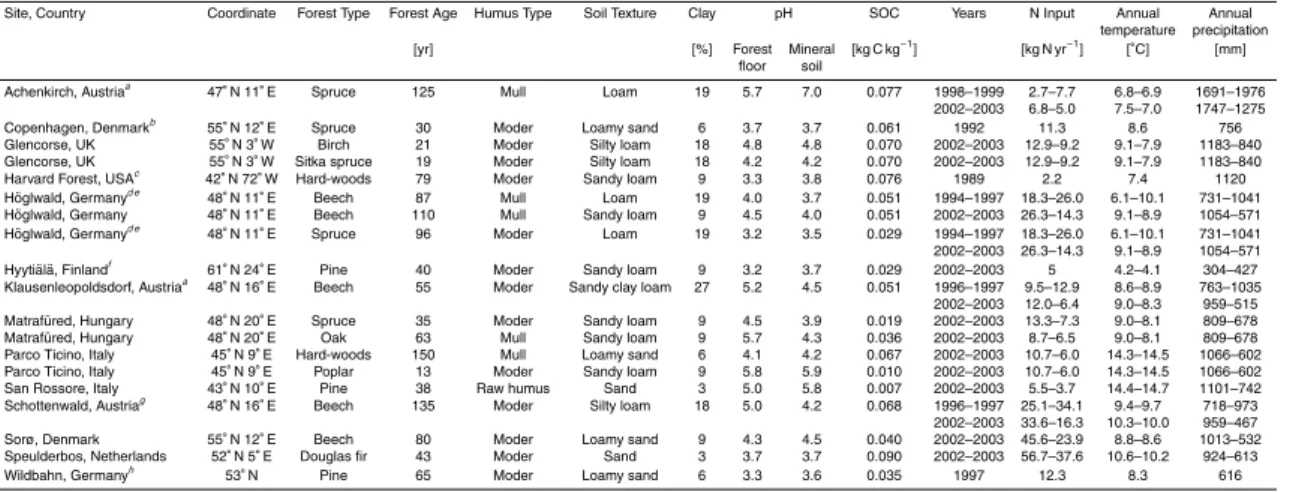
2.2. Evaluation sites
5
The capability of the PnET-N-DNDC model to simulate N trace gas emissions from forest soils was tested by comparing model results with results from field measurements at 19 different field sites across Europe and US (Table 1). Most of these sites were measuring sites within the NOFRETETE project. The testing sites were well distributed across Europe, with a boreal forest site at Hyyti ¨al ¨a, Finland, forest sites
10
in temperate maritime climate (e.g. Speulderbos, Netherlands; Sorø, Denmark; and Glencorse, UK) and temperate continental climate (Matraf ¨ured, Hungary) and forest sites exposed to Mediterranean climate (San Rossore, Parco Ticino, Italy) (Table 1). For all sites information on model input parameters (see Sect. 2.1) as well as on N-trace gas fluxes were aggregated in a database for model testing.
15
2.3. GIS database
A detailed GIS database covering all EU states plus Romania, Bulgaria, Switzerland and Norway with all relevant initialization and driving parameters and variables was created for the regionalization of N trace gas emissions by use of the PnET-N-DNDC. Spatially resolved information included soil, stand and climate properties. Within
20
the NOFRETETE project information on meteorological data and on atmospheric N deposition was provided by the Norwegian Meteorological Institute (MET.NO), from the inputs of the EMEP MSC-W photo-oxidant model (Sandnes-Lenschow et al., 2000; Simpson et al., 2003), on soil properties and on forest information by the Joint Research Centre (JRC) at Ispra, Italy. Since data were delivered in different
25
BGD
2, 779–827, 2005
Inventories of N2O and NO emissions from European forest
soils M. Kesik et al. Title Page Abstract Introduction Conclusions References Tables Figures J I J I Back Close
Full Screen / Esc
Print Version Interactive Discussion
Azimuthal projection on the basis of the EMEP (European Monitoring and Evaluation Program) raster were necessary. The used EMEP raster is a polar stereographic projected grid with a resolution of ca. 50 km×50 km at 60◦North (Simpson et al., 2003; http://www.emep.int).
2.3.1. Soil information
5
The soil data were retrieved from the Soil Geographical Data Base of Europe (SGDBE) at a scale of 1:1 000 000. This data base is part of the European Soil Data Base (http://eusoils.jrc.it/). The SGDBE is the resulting product of a collaborative project involving the European Union and neighbouring countries. It is a simplified representation of the diversity and spatial variability of the soil coverage (CEC, 1985).
10
The SGDBE provides typological information according to so-called Soil Typological Units (STU; N=5306). The STU are grouped into Soil Mapping Units (SMU; N=1650) to form soil associations (for details see CEC, 1985). The STU attribute data contain information about specific soil properties, such as textural class, humus type, water regime, etc. Additionally data for soil carbon and pH for the organic layer and the
15
mineral soil, stone content on SMU level were needed. Therefore preliminary results from the ongoing research project (CarboInvent) were used (aggregated soil C data for organic layer and mineral soil). Regarding these data it has to be noted that the SOC content may not yet represent the final level of quality. For example, data for the continental Eastern part of Europe (e.g. Poland) appear to be too high, and in
20
the case of mountainous areas such as the Alps, no stratification was found although local data clearly indicate elevated SOC content (R. Baritz, personnel information). To aggregate the STU- and SMU-based attributes on the scale of the EMEP raster an up-scaling strategy was applied (Fig. 1). At first the soil properties as derived from the STU were scaled to the SMU level, thereby considering the relative area covered.
25
Secondly, a weighted average value was calculated for the individual soil parameters for each EMEP grid cell, i.e. for clay content, humus type, forest floor and mineral soil pH, stone content and organic carbon mass in the forest floor and mineral soil.
BGD
2, 779–827, 2005
Inventories of N2O and NO emissions from European forest
soils M. Kesik et al. Title Page Abstract Introduction Conclusions References Tables Figures J I J I Back Close
Full Screen / Esc
Print Version Interactive Discussion
EGU Additionally the maximum and minimum value of each soil parameter was recorded for
each EMEP grid cell to retrieve the range for a sensitivity analysis with a maximum and a minimum scenario (see Sect. 2.5) (Fig. 1). Even though forest information for Belarus and Moldavia was available, these countries were excluded from the calculations since details about soil properties were not available.
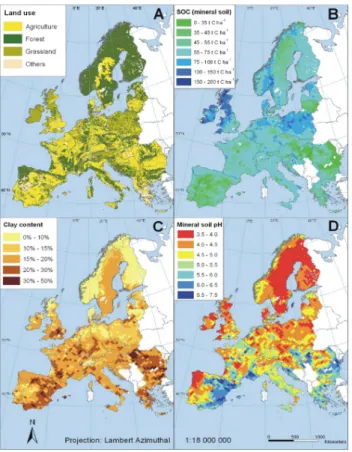
5
Figure 2 shows the distribution of forest areas (Fig. 2A) and of selected soil properties (SOC, clay content, soil pH) in Europe as derived from CORINE/ PELCOM land cover data sets and the SGDBE dataset on soil properties. The maps show that soils rich in organic carbon (SOC) in the mineral soil (>75 t C ha−1) predominate in Northern Europe including the UK and Ireland (Fig. 2B), whereas heavily textured
10
soils (clay content >20%) are often found in the Mediterranean and the Balkan region (Fig. 2C). Predominantly acidic soils with a low base saturation are reported for large parts of Sweden and Finland, but also for the Northern parts of the UK (Fig. 2D). 2.3.2. Forest distribution and forest stand information
Information about the distribution of forest types across Europe has recently been
15
published by K ¨oble and Seufert (2001). They adopted the spatial distribution of forest area for most parts of Europe from the CORINE land cover data set (CEC, 1994) or from the Pan-European Land Cover Mapping project “PELCOM” (M ¨ucher, 2000). In addition K ¨oble and Seufert (2001) used tree species information from the measurement network of the transnational survey (ICP Forest Level I) of forest condition in Europe
20
(UN-ECE, 1998) to retrieve maps of forest type and tree species distribution on a 1 km×1 km raster format for 30 European countries. Since the PnET-N-DNDC model is currently only parameterized for the simulation of 12 forest types (see Sect. 2.1), we grouped some forest types together in order to simulate most of the forested areas in Europe. This means, that e.g. the forest types alder, ash, elm, poplar and willow
25
were simulated with the parameterization for hardwoods. However, some forest types such as Juniperus spec. dominated forests were excluded from our simulations a) since such forests cover only small areas in Europe (approx. 3.5%) and b) to reduce
BGD
2, 779–827, 2005
Inventories of N2O and NO emissions from European forest
soils M. Kesik et al. Title Page Abstract Introduction Conclusions References Tables Figures J I J I Back Close
Full Screen / Esc
Print Version Interactive Discussion
the parameterization and computation complexity. The forest area considered in our simulations was 1 410 477 km2, which is in accordance with official national reports (K ¨oble and Seufert, 2001). As there was no information about forest age available we assumed an average age of 60 years for all forest types. Forest areas in the countries of Albania, Serbia and Montenegro, Macedonia and Bosnia-Herzegovina were excluded
5
from the simulations since no detailed forest information was available. 2.3.3. Climate and N deposition
Simulation runs were performed with the meteorology for the three years 1990, 1995 and 2000. Meteorological data in daily resolution was provided from the inputs of the EMEP MSC-W oxidant model (Sandnes-Lenschow et al., 2000; Simpson et al.,
10
2003) including information about average temperature, and sum precipitation as well as photosynthetically active radiation (PAR). Figure 3 shows a map of the regional distribution of mean annual temperature and sum of annual precipitation across Europe for the year 2000 and relative differences of these parameters in 1990 as compared to the year 2000. The maps show a typical South-North gradient in temperature and
15
reveal that e.g. in the year 2000 mean annual temperature was >10% higher in Central Europe and approx. 5% lower in Spain and Central Europe as compared to the year 1990. The variation in precipitation between the years 1990 and 2000 was pronounced and in many regions in Europe such as Central Finland, Southern UK or Portugal received >25% precipitation in 2000 than in the year 1990 (Fig. 3).
20
Additionally, the EMEP MSC-W model was used to calculate annual data on atmospheric N deposition (dry and wet) for each EMEP grid cell. Emissions of all pollutants were set to those of the year 2000 (Vestreng et al., 2004), whereas meteorology scenarios were taken from the years 1990, 1995 and 2000 in order to asses meteorological variability. The EMEP model’s simulations of concentrations and
25
BGD
2, 779–827, 2005
Inventories of N2O and NO emissions from European forest
soils M. Kesik et al. Title Page Abstract Introduction Conclusions References Tables Figures J I J I Back Close
Full Screen / Esc
Print Version Interactive Discussion
EGU forests in particular by Westling et al. (2005)2. Since the PnET-N-DNDC model does not
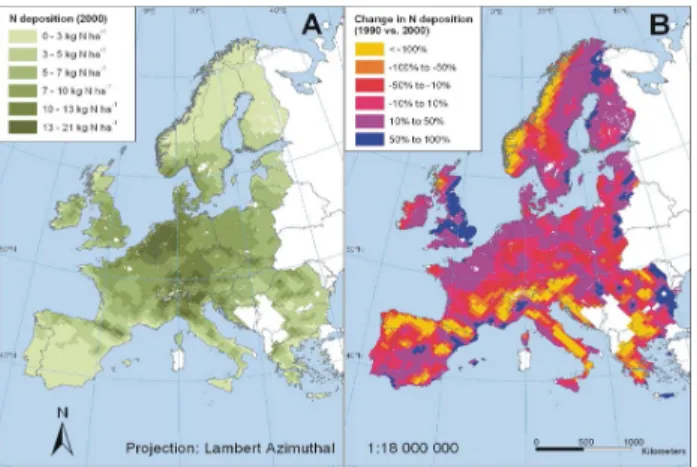
allow consideration of dry deposition of N to forests, we only used the wet deposition values (Fig. 4). The map shows that wet deposition of N with values >13 kg N ha−1yr−1 are especially observed for the Benelux countries and neighbouring North Germany and for parts of South Germany and Northern Italy.
5
2.4. Coupling of the GIS database to the PnET-N-DNDC model
The forest, soil, and climate information was aggregated and linked to the EMEP raster. An individual identification number was assigned to each of the 2527 grid cells of the simulated area. By calling the ID numbers the PnET-N-DNDC model automatically received the individual initialisation and driving parameters of each grid cell. The
10
number of model runs per grid cell depended on the number of forest types found within this cell. For example, three different forest types in one grid cell resulted in three model runs. The results of the individual model runs for one grid cell were weighted depending on the total area of each forest type in the respective grid cell.
2.5. Uncertainty analysis (Monte Carlo, MSF)
15
The focus of the uncertainty analysis was the assessment of the uncertainty of simulation results caused by the necessary generalisations within the GIS database on e.g. soil and vegetation properties. By using the EMEP grid with cells of 50 km×50 km across Europe it was assumed that soil properties within a grid cell were uniform. However, this is of course not the case, since soil properties (e.g. pH, soil organic
20
carbon (SOC) content) are highly variable in space. To assess the effect of sub grid cell variability in soil properties on simulated N trace gas emissions from forest soils the Most Sensitive Factor (MSF) method (Li et al., 2004) as well as a Monte Carlo
2
Westling, O., Fagerli, H., Hellsten, S., Knulst, J. C., and Simpson, D.: Comparison of modelled and monitored deposition fluxes of sulphur and nitrogen to ICP-forest sites in Europe, Biogeosciences, submitted, 2005.
BGD
2, 779–827, 2005
Inventories of N2O and NO emissions from European forest
soils M. Kesik et al. Title Page Abstract Introduction Conclusions References Tables Figures J I J I Back Close
Full Screen / Esc
Print Version Interactive Discussion
approach was used. N trace gas fluxes simulated with the PnET-N-DNDC and also with the DNDC have been shown to be very sensitive to changes in soil texture, pH and SOC (Stange et al., 2000; Butterbach-Bahl et al., 2001; Li et al., 2004). After extensive sensitivity studies of the soil database of Europe we found out that there were general trends regarding the relationship between N2O and NO emissions and the soil
5
factors. For example, the modelled N2O and NO emissions usually increase along with an increase in SOC content as well as a decrease in soil clay fraction and pH. These model reactions are in accordance with a series of results from field and laboratory observations (Li et al., 2005). The MSF method uses the generalized relationships between individual soil factors and the magnitude of N trace gas emissions by grouping
10
a series of soil factors for which minimum and maximum values are available in such a way that N trace gas emissions are either maximized or minimized. This means that PnET-N-DNDC automatically selected the minimum organic matter mass in the forest floor and mineral soil, maximum pH in the forest floor and mineral soil, maximum skeleton rate and minimum clay content to form a scenario which was assumed to
15
produce a low value of N2O and NO flux for this grid cell and the model then selected the maximum organic matter mass and minimum pH in the forest floor and mineral soil, minimum skeleton rate and maximum clay content to form another scenario, which was assumed to produce a high value of N2O and NO flux for the grid cell. Thus PnET-N-DNDC ran twice with the two scenarios for each grid cell to produce an
20
upper and a lower boundary of expected N2O and NO emission rates (three times if the average scenario is included). The calculated N trace gas emission range was assumed to be wide enough to cover the real flux with a high probability. To verify the MSF method, we also implemented a Monte Carlo routine into the PnET-N-DNDC. This allowed us to directly quantify the uncertainties derived by soil heterogeneity of
25
individual EMEP grid cells (for details see Li et al., 2004). When PnET-N-DNDC ran in the Monte Carlo mode, the observed range for each soil factor in a grid cell was divided into eight intervals. For example, if the pH in a grid cell ranged from 3.5 to 5.6 the Monte Carlo approach would run with the pH values 3.5, 3.8, 4.1, 4.4. . . , 5.6.
BGD
2, 779–827, 2005
Inventories of N2O and NO emissions from European forest
soils M. Kesik et al. Title Page Abstract Introduction Conclusions References Tables Figures J I J I Back Close
Full Screen / Esc
Print Version Interactive Discussion
EGU PnET-N-DNDC selected randomly an interval of each of the six soil properties (clay
content, organic mass in mineral soil and forest floor, forest floor and mineral soil pH, and skeleton rate) to form a scenario. The process was repeated 5000 times so that 5000 N2O and NO emission estimates were calculated for one grid cell. The results were then compared with the results of the MSF method. For the Monte Carlo approach
5
we selected randomly 50 EMEP grid cells across Europe and compared the results of the frequency distribution of N2O and NO emissions with the ranges of N2O and NO emissions as derived from the MSF method. The comparison of the MSF method with the Monte Carlo approach showed that the range of NO emissions calculated with the MSF method covered in average more than 79% of the variability in N trace
10
gas emissions calculated with the Monte Carlo approach. However, this value was remarkably lower with regard to N2O. The maximum N2O emissions calculated with the MSF method were in average approx. 50% lower compared to the emissions using the Monte Carlo approach. The minimum N2O emissions calculated with the MSF method were in average two fold higher than the N2O emissions calculated with the
15
Monte Carlo method. However, since the lower boundary of N2O emissions ranged between 0.1 to 0.2 kg N ha−1yr−1 this differences can be neglected for the purpose of this study.
3. Results
3.1. Model testing
20
The model was applied to the different field sites with identical and fixed internal parameter settings for microbial C and N turnover processes. Figure 5 shows daily simulation results for NO and N2O emissions for the sites H ¨oglwald (spruce, Germany), Sorø (beech, Denmark), Hyyti ¨al ¨a (Pine, Finland) and Glencorse (Sitka spruce, Scotland) as compared to observed N trace gas emissions. For the H ¨oglwald
25
BGD
2, 779–827, 2005
Inventories of N2O and NO emissions from European forest
soils M. Kesik et al. Title Page Abstract Introduction Conclusions References Tables Figures J I J I Back Close
Full Screen / Esc
Print Version Interactive Discussion
emissions. Overestimation of N2O emissions mainly occurred during the first half of the year, whereas in autumn N2O emissions tended to be underestimated in average by approx. 10–15%. The model captured the period with peak emissions in summer, but predicted the peak emission a few days earlier than observed in the field (Fig. 5). Simulated NO emissions for the H ¨oglwald spruce site were in good agreement with
5
field observations throughout the year with respect to seasonality and magnitude of fluxes. For most periods, except for three 1–2 week long periods in June, August and October, simulated results deviated only within 10–20% from observed NO emissions. However, in the short periods mentioned emissions were overestimated by a factor of two. The simulated seasonality of NO and N2O emissions at the H ¨oglwald site
10
matched the seasonality as observed in the field, e.g. high NO emissions during summer versus comparably low emissions in the winter period (Fig. 5). Also the differences in magnitude of NO and N2O emissions between both sites, which are mainly due to differences in litter quality and soil pH, were well reproduced by the model. The model also realistically predicted differences in the magnitude of N trace
15
gas emissions for different field sites across Europe, i.e. low N2O emissions in Hyyti ¨al ¨a and Glencorse, and slightly elevated N2O emissions at Sorø. However, especially for the beech site at Sorø simulated emissions for the first few months of 2002 tended to be higher than field observations. This was mainly due to a simulation of elevated N2O emissions during freezing-thawing events by the PnET-N-DNDC
20
model, which were not confirmed during field measurements. However, for this period field measurements also revealed a pronounced spatial variability of N2O emissions (Fig. 5). N2O and sporadically performed NO emission measurements at the Hyyti ¨al ¨a site showed that N trace gas emissions are close to zero. A comparable result was also delivered by the PnET-N-DNDC model. For the Glencorse site the model
25
captured the temporal variation in NO emissions during the summer period of 2002, but failed to predict the increase in NO emissions from the end of October onwards (Fig. 5). For the period during which NO field measurements had been performed the model underestimated NO emissions by approx. 30% (field mean: 4.9 g N ha−1day−1;
BGD
2, 779–827, 2005
Inventories of N2O and NO emissions from European forest
soils M. Kesik et al. Title Page Abstract Introduction Conclusions References Tables Figures J I J I Back Close
Full Screen / Esc
Print Version Interactive Discussion
EGU simulation: 3.4 g N ha−1day−1).
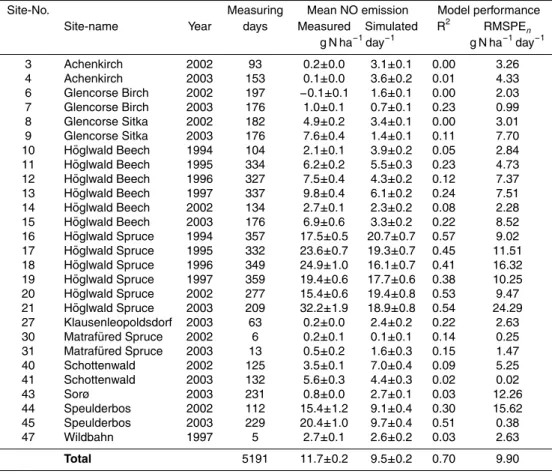
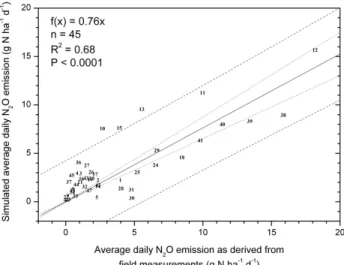
Figures 6 and 7 and Tables 2 and 3 summarize results of model testing for all 19 field sites for which data from N trace gas emission measurements were available. The graph shows that the model was capable of capturing observed differences between high and low emitting sites, based on general information on soil and
5
vegetation properties and by considering the local meteorological conditions. The relative variation between observed and simulated N2O emissions was higher for sites with N trace gas emissions <3 g N ha−1day−1 as compared to sites with N trace gas emissions >5 g N ha−1day−1. The linear regression of all simulated and observed mean N2O emission rates resulted in r2=0.68 (Fig. 6). On average over all test sites the
10
model underestimated emissions by 24% (f (x)=0.76x). For NO the r2value was 0.78 (Fig. 7). Like in the case of N2O the model also tended to underestimate NO emissions at the test sites by on average 27% (f (x)=0.73x). Given the wide range of complex processes involved in mediating soil N emissions, these results are very encouraging. These results of model testing for a wide variety of forest ecosystems across Europe
15
(see also details in Tables 2 and 3) provided solid basis for the application of the PnET-N-DNDC model on a regional scale.
3.2. N2O emissions from European forest soils
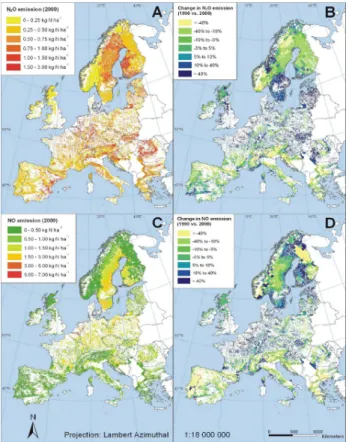
Figure 8A shows modelled N2O emissions from forest soils across Europe resulting from the regional application of the GIS-coupled PnET-N-DNDC model. For the
20
year 2000 simulated N2O emissions from European forest soils ranged between 0.01 to 2.9 kg N ha−1yr−1. N2O emissions >2.5 kg N ha−1yr−1 were predicted for some forest ecosystems in the Netherlands. Simulated annual N2O emissions for wide areas of Central Europe, West Spain, Slovakia and Romania were also found to be
>1.0 kg N ha−1yr−1. Furthermore, high N2O emissions were also predicted for soils
25
with high amounts of organic carbon content in the forest floor in Southwest Finland and in the Northern parts of Sweden (1.0 to 1.8 kg N ha−1yr−1). Intermediate emissions
BGD
2, 779–827, 2005
Inventories of N2O and NO emissions from European forest
soils M. Kesik et al. Title Page Abstract Introduction Conclusions References Tables Figures J I J I Back Close
Full Screen / Esc
Print Version Interactive Discussion
in the range of 0.75 to 1.5 kg N ha−1yr−1 were simulated for large parts of Poland and the Baltic states, whereas N2O emissions <0.5 kg N ha−1yr−1 were calculated for most Mediterranean and maritime regions including France and the UK, Ireland and Norway as well as large parts of central and northern Finland (Fig. 8A). The average N2O emission of all forest sites across Europe calculated for the year 2000
5
was 0.58 kg N ha−1yr−1 (Table 4). This average N2O emission value changed only slightly when the model was initialized with the meteorological drivers for the years 1990 and 1995. For 1990 an average value of 0.62 kg N ha−1yr−1 was calculated, whereas for 1995 the mean N2O emission was 0.55 kg N ha−1yr−1(Table 4). However, on a regional scale the magnitude of N2O emissions between individual years can
10
change significantly, as shown in Fig. 8B. The map shows that e.g. in the year 2000 the N2O emissions from forest soils in Southern Sweden were >40% higher than in the year 1990, whereas in other areas such as the Mediterranean region N2O emissions were 10 to >40% lower. Total N2O emissions from forest soils across Europe for the years 1990, 1995 and 2000 were in a range of 77.6 to 86.8 kt N2O year−1 (Table 4).
15
Due to their large forested areas Sweden and Finland contributed most to total N2O emissions (11.9 and 10.3 kt N year−1). However, on a per hectare basis forests in the Netherlands (1.26 kg N ha−1yr−1) and Romania (0.96 kg N ha−1yr−1) were found to be the strongest emitters (Table 4).
3.3. NO emissions from European forest soils
20
Figure 8C shows the modelled NO emissions from forest soils across Europe for the year 2000. As for N2O, the highest NO emissions were simulated for forest soils in the Netherlands and neighbouring areas in Belgium and Germany. The maximum NO emission for a grid cell in this area was 7.0 kg N ha−1yr−1. For forest soils in most parts of Germany, Belgium, Poland and the Massif Central in France, simulated NO
25
emissions were in a range of 1.0 to 3.0 kg N ha−1yr−1. Furthermore, elevated NO emissions of up to 3.0 kg N ha−1yr−1 were found for large areas of Sweden. This
BGD
2, 779–827, 2005
Inventories of N2O and NO emissions from European forest
soils M. Kesik et al. Title Page Abstract Introduction Conclusions References Tables Figures J I J I Back Close
Full Screen / Esc
Print Version Interactive Discussion
EGU finding was mainly related to the low soil pH values usually found for forest soils in this
region, causing a high NO production via chemo-denitrification in the model. Mostly low emissions of NO (<0.5 kg N ha−1yr−1) were simulated for forest soils in Norway, most of Finland and the Mediterranean region (Fig. 8C). The average NO emission from forest soils across Europe in the year 2000 was calculated to be 0.7 kg N ha−1yr−1
5
and, thus, slightly higher than for N2O (0.58 kg N ha−1yr−1). However, the average NO emission from forest soils varied only slightly between individual simulation years (1990: 0.7 kg N ha−1yr−1, 1995: 0.6 kg N ha−1yr−1) (Table 4). Total NO emission for all forests within the simulation area was 99.2 kt N in the year 2000 which was almost the same as in the year 1990 (98.4 kt N) and slightly lower than in the year 1995 with
10
84.9 kt N. The major contributors to total NO emissions from forest soils in Europe were Sweden and Germany (Table 4). The interannual variability in NO emissions due to changes in meteorological conditions was pronounced. Figure 8D shows relative changes in the NO emission strength of forest soils across Europe. The map shows that NO emissions were mostly higher in Central Europe and Northern Europe but
15
lower in the Mediterranean Region for meteorology from the year 2000 as compared to using meteorology from the year 1990.
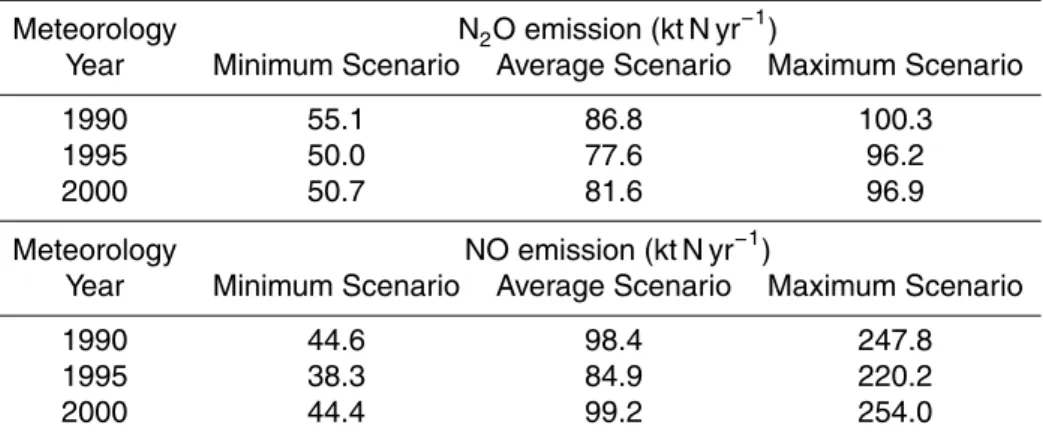
3.4. Uncertainty estimates
Using the Most Sensitive Factor (MSF) method, which was re-evaluated prior to its use with a Monte Carlo approach (see Sect. 2.5), we calculated for each grid cell a minimum
20
and a maximum scenario for the emission strength of N2O and NO from forest soils. The cumulative sum for the minimum and the maximum scenarios as well as the results from the “average” scenario for the years 1990, 1995 and 2000 are given in Table 5. The table shows that e.g. in the year 2000 model initialisation with mean values for all grid cells resulted in a total N2O emission from forest soils of 81.6 kt N yr−1. The range
25
of uncertainty for this respective year was 50.7 to 96.9 kt N yr−1, which is equivalent to a relative range of −40 to+16% as compared to the average scenario. The uncertainty for the prediction of NO emissions was significantly higher as compared to N2O. Here,
BGD
2, 779–827, 2005
Inventories of N2O and NO emissions from European forest
soils M. Kesik et al. Title Page Abstract Introduction Conclusions References Tables Figures J I J I Back Close
Full Screen / Esc
Print Version Interactive Discussion
we calculated a total NO emission of 99.2 kt N yr−1(year 2000) for the average scenario with a range of uncertainty of 44.3 to 254.0 kt N yr−1. The relative range as compared to the mean value thus equals to −66 to+156%. These remarkable differences in the uncertainty ranges between modelled N2O and NO emissions were found to be mainly due to the pH sensitivity of NO production via chemo-denitrification.
5
4. Discussion
GIS coupled biogeochemical models have recently been used in a number of studies for the calculation of regional or global inventories of N2O and NO emissions from soils (e.g. Potter et al., 1996; Davidson et al., 1998; Butterbach-Bahl et al., 2001, 2004; Brown et al., 2002; Li et al., 2001, 2004). This approach has several advantages as
10
compared to a pure statistical approach where single or a series of field measurements at one or several site(s) are extrapolated to larger regions. Advanced biogeochemical models summarize our current understanding of environmental factors which are affecting the magnitude of trace gas emissions from soils such as meteorological conditions, soil properties (pH, SOC, texture) or – if turning especially to agricultural
15
soils – management practices. In a series of studies all these factors have been shown to largely influence the production, consumption and emission of N trace gases (e.g. Barnard and Leadley, 2005; Conrad 2002). By using biogeochemical models in inventory studies one assumes that the complexity of processes involved in N trace gas emissions and interacting factors, which is the main reason for the widely
20
observed spatial and temporal variability in emissions, will at least partly be mimicked by the models (Li et al., 2000, 2001). In this paper we provided evidence that the PnET-N-DNDC model is indeed a powerful and reliable tool to simulate N trace gas emissions from forest soils. The application of the model to a range of field sites showed that the model can reproduce observed differences in N trace gas fluxes. The
25
model was able to explain 68% of the site variability for N2O and even 78% of the site variability for NO. However, the detailed site evaluation also showed that the model is
BGD
2, 779–827, 2005
Inventories of N2O and NO emissions from European forest
soils M. Kesik et al. Title Page Abstract Introduction Conclusions References Tables Figures J I J I Back Close
Full Screen / Esc
Print Version Interactive Discussion
EGU still far from perfect, e.g. with regard to the timing of peak emissions or the magnitude of
the seasonality of N trace gas emissions (see e.g. Fig. 5 and Tables 2 and 3). Further improvement requires a better understanding and parameterisation of the microbial N turnover processes, especially with regard to denitrification with an emphasis on the ratio of N2 to N2O production. Furthermore, also the mechanistic description of the
5
dynamics of plant N uptake versus microbial N uptake remains a challenge, since our understanding of the competition between the plant and microbial communities for N is still limited (Rennenberg et al., 1998). Also, more detailed site specifications such as the changes in soil properties with soil depth or the hydrological condition of a site in relation to its landscape position (e.g. with regard to the distance to the groundwater
10
or occurrence of interflow) would further improve the basis for the simulation results. On the other hand this would require a further extension of the list of initializing and driving parameters and thus would strongly reduce the applicability of such a model on a regional basis due to the restricted availability of such data on a regional scale.
One can still find arguments that biogeochemical models such as the PnET-N-DNDC
15
model are over-parameterised and that one may produce comparable results with more simple empirical approaches. However, due to the still limited number of field measurements and the observed importance of meteorological conditions and soil properties for the magnitude of N trace gas emissions from soils a pure empirical approach is unlikely to work. Furthermore, empirical models can only be used for the
20
range for which they have been validated, whereas in theory biogeochemical models can also be used as predicting tools e.g. for sites with significant different site properties as the one for which the model was tested.
There still remains an argument with regard to the availability and quality of GIS information for initializing and driving complex models. In view of e.g. the spatial
25
inhomogeneity of soil properties and the sensitivity of the PnET-N-DNDC model to changes in e.g. SOC or soil pH (Stange et al., 2000) the uncertainty about the regional distribution of these parameters results in a significant increase of the prediction error. In this study we addressed this problem on a regional scale with the Most Sensitive
BGD
2, 779–827, 2005
Inventories of N2O and NO emissions from European forest
soils M. Kesik et al. Title Page Abstract Introduction Conclusions References Tables Figures J I J I Back Close
Full Screen / Esc
Print Version Interactive Discussion
Factor (MSF) method (Li et al., 2004) and with a Monte Carlo approach for selected grid cells across Europe. By this we were able to produce an uncertainty range, which most probably covers the mean N trace gas emission of a given grid cell.
4.1. N2O emissions
In our study we estimated that total average N2O emissions from forest soils across
5
Europe in the years 1990, 1995 and 2000 were in the range of 77.6 to 86.8 kt N yr−1. The respective uncertainty range – as calculated with the MSF method by Li et al. (2004) – is 50 to 100 kt N yr−1. Furthermore, we calculated that the average N2O emission per ha forest soil and year was 0.55 to 0.62 kg N ha−1yr−1, with elevated emissions in Central Europe and Western Spain but also in parts of Scandinavia
10
where soils with high organic C content in the forest floor are found. Lower emissions were calculated for the UK and some boreal forest areas. Based on a literature review by Brumme et al. (2005) N2O emissions from boreal forests ranged between 0.1 and 0.3 kg N ha−1yr−1. For most forested areas in Norway, Finland and Sweden our simulation results are in line with this estimate. However, especially for those
15
areas in Scandinavia and the Baltic States for which elevated C stocks in the forest floor are reported, considerably higher N2O emissions with values >0.75 kg N ha−1 were calculated. The estimate by Brumme et al. (2005) was mainly based on N2O emission measurements from mineral soils in the boreal region (e.g. Martikainen, 1996), whereas estimates in other recent publications, in which N2O emissions in
20
the boreal zone from forest soils rich in humus were reported (von Arnold et al., 2005; Maljanen et al., 2001, 2003), resulted in annual N2O emission rates in the range of 1.0 to 10.0 kg N ha−1yr−1. The highest N2O emissions from boreal forest soils have been reported from peat soils, which have been used for agriculture prior to forestation (Maljanen et al., 2003). In the contrary, nutrient poor organic forest soils
25
have been reported to emit negligible amounts of N2O to the atmosphere (Regina et al., 1996). The huge discrepancy between both estimates is obvious and cannot be further
BGD
2, 779–827, 2005
Inventories of N2O and NO emissions from European forest
soils M. Kesik et al. Title Page Abstract Introduction Conclusions References Tables Figures J I J I Back Close
Full Screen / Esc
Print Version Interactive Discussion
EGU clarified at present. We only can assume that C-rich soils from former peatlands, which
have widely been drained in Fennoscandia for improving forest growth (Paavilainen and P ¨aiv ¨anen, 1995) are indeed a stronger source for atmospheric N2O than other soils poorer in C content in this area.
N2O emission measurements from temperate forest soils in Europe have been
5
reported to vary substantially over a wide range from 0 to 20 kg N ha−1yr−1 (see e.g. data compilation by Papen and Butterbach-Bahl, 1999) with a mean range of 0.2 to 2.0 kg N ha−1yr−1. The variability in the emission strength was found to be influenced by soil properties such SOC, pH, N deposition and stand properties (e.g. Papen and Butterbach-Bahl, 1999; Brumme et al., 1999; Zechmeister-Boltenstern et al., 2002;
10
Jungkunst et al., 2004). Furthermore, the occurrence of high winter N2O emissions during freezing and thawing events was acknowledged as a major factor determining the magnitude of annual N2O emissions (Butterbach-Bahl et al., 2002b; Teepe and Ludwig, 2004). To reduce the uncertainty in estimates of N2O emissions from temperate forest ecosystems different approaches from empirical based stratifications
15
(Brumme et al., 1999) towards the use of process-oriented models (Butterbach-Bahl et al., 2001, 2004) have been followed. Using a stratification approach in combination with functions for N2O production in dependency from soil water content and temperature, Schulte-Bisping and Brumme (2003) estimated that the average N2O emission from forest soils in Germany is 0.32 kg N2O N ha−1yr−1. This estimate may represent the
20
lower boundary of emissions since neither N deposition effects nor freezing-thawing events were considered in this approach (Schulte-Bisping and Brumme, 2003). Both of these factors were considered in the studies by Butterbach-Bahl et al. (2001, 2004) who used an older version of the PnET-N-DNDC model for estimating the regional emission strength of forest soils in South Germany and Saxony. Their estimate of a
25
mean annual N2O emission of approx. 2 kg N ha−1yr−1 is significantly higher than the one of Schulte-Bisping and Brumme (2003). It is also higher than estimates calculated with the recent version of PnET-N-DNDC for Germany as presented in this paper (0.6 to 0.8 kg N ha−1yr−1, see Table 4), which is partly due to a) an improved parameterisation
BGD
2, 779–827, 2005
Inventories of N2O and NO emissions from European forest
soils M. Kesik et al. Title Page Abstract Introduction Conclusions References Tables Figures J I J I Back Close
Full Screen / Esc
Print Version Interactive Discussion
of processes in the new model which was based on laboratory studies (Schindlbacher et al., 2004; Kesik et al., 20051), b) the aggregation of site information on the EMEP grid (ca. 50 km by 50 km) raster instead of defined polygons as in the earlier studies, and c) different simulation years.
With regard to the Mediterranean region only limited information about the magnitude
5
of N2O emissions from soils is available (see review by Butterbach-Bahl and Kiese, 2005). The few publications available show that forest soils in this area can even function as sinks for atmospheric N2O (Rosenkranz et al., 20053). Except for parts of Eastern Spain also our model calculated low estimates of N2O emissions in the Mediterranean region (<0.5 kg N m−2yr−1), which was largely due to a model-intrinsic
10
limitation of microbial N turnover processes by water stress. 4.2. NO emissions
NO emissions from forest soils across Europe in the years 1990, 1995 and 2000 were calculated to be in the range of 84.9 to 99.2 kt N yr−1 and, thus, approx. 10% higher than for N2O. The range of uncertainty as calculated with the MSF method
15
is 38.3 to 254.0 kt N yr−1. Using either a methodology based on Skiba et al. (1997) or Davidson and Kingerlee (1997), Simpson et al. (1999) estimated NO emissions from soils covered with natural or semi-natural vegetation in Europe. By applying the Skiba et al. (1997) methodology excluding Russia, Ukraine and the former Yugoslavia the authors came up with an estimated NO emissions of approx. 20 kt N yr−1 from
20
forest soils across Europe. The respective range for the Davidson and Kingerlee methodology was 10 to 300 kt N yr−1 (Simpson et al., 1999). The differences in the magnitude of estimated NO emissions from forest soils in Europe between the Skiba et al. (1997) methodology as applied in Simpson et al. (1999) and our approach is mainly
3
Rosenkranz, P., Br ¨uggemann, N., Papen, H., Xu, Z., Seufert, G., and Butterbach-Bahl, K.: N2O, NO and CH4exchange, and microbial N turnover over a Mediterranean pine forest soil, Biogeosciences, submitted, 2005.
BGD
2, 779–827, 2005
Inventories of N2O and NO emissions from European forest
soils M. Kesik et al. Title Page Abstract Introduction Conclusions References Tables Figures J I J I Back Close
Full Screen / Esc
Print Version Interactive Discussion
EGU due to the intended simplicity of the Skiba et al. (1997) methodology which mainly
considers temperature and N input to natural systems as parameters for estimating soil bound NO emissions but neglects effects of texture, SOC or pH.
The simulated average NO emission per ha forest soil was 0.6 to 0.7 kg N ha−1yr−1, which is in agreement with estimated average NO emissions from forest soils in the
5
Southeastern United States (Davidson et al., 1998). In our study the highest emissions of NO from forest soils (>3 kg N ha−1yr−1) were simulated for highly N-affected forest areas in the Benelux states and Northern Germany, which is in accordance with field observations by Van Dijk and Duyzer (1999), who reported average NO emissions
>6 kg N ha−1yr−1 for beech and Douglas fir forests exposed to an atmospheric N
10
deposition of approx. 40 kg N ha−1yr−1at Speulderbos, Netherlands. The latter results were also confirmed by measurements within the NOFRETETE project. Also for the H ¨oglwald region in Southern Germany, for which long-term measurements of NO emissions from beech and spruce forests are available (Gasche and Papen, 1999; Butterbach-Bahl et al., 2002b) simulated emissions are in accordance with field
15
observations. For the respective grid cell we simulated an average emission of 1.5 to 3.0 kg N ha−1yr−1, which is lower than the observed NO emissions from the spruce site of the H ¨oglwald Forest (>6 kg N ha−1yr−1), but in agreement with observed average NO emissions from the beech site (approx. 2.8 kg N ha−1yr−1) (Butterbach-Bahl et al., 2002b). The relatively minor discrepancies are only due to differences in scale, since
20
in our approach generalized information for the 50 km by 50 km grid cell was used, e.g. with regard to soil properties or atmospheric N deposition. However, for large forest areas in Sweden also NO emissions in a range of 1.5 to 3.0 kg N were calculated (Fig. 8C), that are not confirmed by any measurements at present. Johansson (1984) who carried out measurements in forests close to Stockholm found that NO emissions
25
from unfertilized forest soils were lower than 0.1 kg N ha−1yr−1. One still can argue that the differences in scales make it difficult to compare the results, but by studying the reasons why simulated NO emissions in large parts of Sweden were elevated we found that this was mainly due to increased NO production via chemo-denitrification. Since
BGD
2, 779–827, 2005
Inventories of N2O and NO emissions from European forest
soils M. Kesik et al. Title Page Abstract Introduction Conclusions References Tables Figures J I J I Back Close
Full Screen / Esc
Print Version Interactive Discussion
the mechanisms in the PnET-N-DNDC model which are dealing with NO production via chemo-denitrification are in accordance with results from laboratory and field studies (e.g. van Cleemput and Baert, 1984; Gasche and Papen, 1999; Kesik et al., 20051), the main reason for such a discrepancy may be due to an underestimation of NO consumption in the model. At present the model only considers that NO can be
5
consumed by denitrification, but in soil incubation studies it was shown that also oxidative NO consumption may significantly contribute to NO consumptions especially in soils rich in SOC (Dunfield and Knowles, 1997). However, since the mechanistic basis of oxidative NO consumption is not well described at present this process is still not included in the model. A further reason for the discrepancy between observed
10
and simulated NO emissions for parts of Scandinavia may be due to differences in soil properties which were used in our model simulations as compared to those found in the individual studies. The soil pH at the sites where Johansson (1984) carried out his measurements was 4.0 or 4.5, respectively. But the soil information derived from the Soil Geographical Data Base of Europe and used in the present work revealed that
15
the soil pH in most parts of Scandinavia is <4.0 (see Fig. 2D), i.e. at a level where chemo-denitrification in the PnET-N-DNDC model is active (Li et al., 2000).
4.3. Relevance of N trace gas emissions from forests soils in Europe as compared to other sources
Fertilized agricultural soils are assumed to be the predominant source for atmospheric
20
N2O. Boeckx and Van Cleemput (2001) evaluated the emission of N2O from agricultural soils in Europe using the IPCC methodology (Mosier et al., 1998). They estimated that the average direct N2O emission from agricultural soils across Europe is 5.6 kg N ha−1yr−1. Somewhat lower numbers where calculated by Freibauer and Kaltschmitt (2003) who considered besides the amount of N fertilization also climatic,
25
soil and management factors for the calculation of their estimate. For agricultural, minerotrophic soils for the temperate and sub-boreal climate regions in Europe they came up with an average emission of 2.0 kg N ha−1yr−1. This means that agricultural
BGD
2, 779–827, 2005
Inventories of N2O and NO emissions from European forest
soils M. Kesik et al. Title Page Abstract Introduction Conclusions References Tables Figures J I J I Back Close
Full Screen / Esc
Print Version Interactive Discussion
EGU soils are approx. a four to ten-fold stronger source for N2O as compared to forest
soils, where the average emission was calculated to be in a range of 0.55 to 0.62 kg N ha−1yr−1. However, if the total N2O emissions for each land use type for different countries are calculated, the importance of forest soils as sources for atmospheric N2O becomes evident. Using our approach and the estimates by Boeckx
5
and Van Cleemput (2001) the emission strength of forest soils for N2O is on average 14.5% of the emission strength of agricultural soils in Europe (Fig. 9).
Pyrogenic emissions are the dominating source for atmospheric NOx in Europe. Using estimates of Vestreng et al. (2004), total pyrogenic emissions for our simulation area in the year 2000 would amount to approx. 10 000 kt N yr−1. Our calculations for
10
NO emissions from forest soils using meteorology for the years 1990, 1995 and 2000 was in the range of 85 to 99 kt N yr−1, which is <1% of the pyrogenic NOx emissions. Using a temperature function developed by Williams et al. (1992), Stohl et al. (1996) estimated that emissions of NO from all soils including forest, grassland and arable soils, to be only 1.6% of total pyrogenic emissions. Simpson et al. (1999) presented
15
calculations of soil-NO emissions with a range of methods (a modified version of Skiba et al., 1997; BEIS-2 – from Novak and Pierce, 1993; Yienger and Levy, 1995; Davidson and Kingerly, 1997) accounting in some of these for N inputs from atmospheric N deposition or fertilizer. The range of estimates was very large, with application of the Davidson and Kingerly methodology alone given between 13 to 350 kt N yr−1 for
20
forests, depending upon the application of the default N emission rate. Compared to the approaches documented in Simpson et al. (1999), the PnET-N-DNDC approach as presented here is much more complicate but with sounder physical basis, since it considers besides temperature and N availability also the effect of e.g. soil pH, moisture or texture on NO emissions from forest soils.
BGD
2, 779–827, 2005
Inventories of N2O and NO emissions from European forest
soils M. Kesik et al. Title Page Abstract Introduction Conclusions References Tables Figures J I J I Back Close
Full Screen / Esc
Print Version Interactive Discussion
5. Conclusions
The GIS-coupled process-oriented model PnET-N-DNDC, which was tested prior to its regional use on a large field data set, was used for the calculation of inventories of N2O and NO emissions from forests soils in Europe. The results demonstrate that forest soils are a significant source of N2O in Europe. With regard to NO, forest
5
soils only contribute <1.0% to total NOx emissions in Europe. However, due to the seasonality of NO emissions the relative contribution of NO emissions from forest soils to total NOx emissions can be larger during the vegetation period and can be of importance especially in rural areas. After a thorough validation of the model against field observation and an extensive sensitivity analysis of the model performance we
10
conclude that the PnET-N-DNDC performs very well simulating NO and N2O emissions from European forest soils. This work demonstrates that GIS-coupled process-oriented models are valuable tools to realistically estimate biogenic N trace gas emissions from soils. From our point of view this is the most comprehensive effort to date to simulate NO and N2O emissions from European forest soils.
15
Acknowledgements. The work was funded by the European Commission in the NOFRETETE
project (EVK2-CT2001-00106) of the fifth framework program.
References
Aber, J. D., Nadelhoffer, K. J., Steudler, P., and Melillo, J. M.: Nitrogen saturation in northern forest ecosystems, BioScience, 39, 378–386, 1989.
20
Aber, J. D. and Federer, C. A.: A generalized, lumped-parameter model of photosynthesis, evaporation and net primary production in temperate and boreal forest ecosystems, Oecologia, 92, 463–474, 1992.
Ambus P. and Christensen S.: Spatial and seasonal nitrous oxide and methane fluxes in Danish forest-, grassland-, and agroecosystems, J. Environ. Qual., 24(5),993–1001, 1995.
25
Barnard, R. and Leadley, P. W.: Global change, nitrification and denitrification: a review, Global Biogeochem. Cycl., 19, GB1007, doi:10.1029/2004GB002282, 2005.