SCIENTIFIC ARTICLE
Cone beam computed tomography for diagnosis
of bisphosphonate-related osteonecrosis of the jaw: evaluation
of quantitative and qualitative image parameters
Roman Guggenberger&Emrah Koral&
Wolfgang Zemann&Christine Jacobsen&
Gustav Andreisek&Philipp Metzler
Received: 20 January 2014 / Revised: 11 June 2014 / Accepted: 20 June 2014 / Published online: 5 July 2014 # ISS 2014
Abstract
Objective To assess the diagnostic performance of quantita-tive and qualitaquantita-tive image parameters in cone-beam computed tomography (CBCT) for diagnosis of bisphosphonate-related osteonecrosis of the jaw (BRONJ).
Materials and methods A BRONJ (22 patients, mean age 70.0 years) group was age and gender matched to a healthy control group (22 patients, mean age 68.0 years). On CBCT images two independent readers performed quantitative bone density value (BDV) measurements with region and volume-of-interest (ROI and VOI) based approaches and qualitative scoring of BRONJ-associated necrosis, sclerosis and perios-teal thickening (1 = not present to 5 = definitely present).
Intraoperative and clinical findings served as standard of reference. Interreader agreements and diagnostic performance were assessed by intraclass correlation coefficients (ICC), kappa-statistics and receiver-operating characteristic (ROC) analysis.
Results Twenty-three regions in 22 patients were affected by BRONJ. ICC values for mean BDV VOI and mean BDV ROI were 0.864 and 0.968, respectively (p<0.001). The area under the curve (AUC) for mean BDV VOI and mean BDV ROI was 0.58/0.83 with a sensitivity of 57/83 % and specificity of 61/77 % for diagnosis of BRONJ, respectively. Kappa values for presence of necrosis, sclerosis and periosteal thickening were 0.575, 0.617 and 0.885, respectively. AUC values for qualitative parameters ranged between 0.90–0.96 with sensi-tivity of 96 % and specificities between 79–96 % at respective cutoff scores.
Conclusions BRONJ can be effectively diagnosed with CBCT. Qualitative image parameters yield a higher diagnostic performance than quantitative parameters, and ROI-based attenuation measurements were more accurate than VOI-based measurements.
Keywords Cone beam CT . Bisphosphonate .
Bisphosphonate-related osteonecrosis of the jaw (BRONJ) . Diagnostic performance
Introduction
Bisphosphonates are inorganic pyrophosphates effective in inhibiting bone resorption and have been approved and used in the past for different indications such as osteoporosis, Paget’s disease, hypercalcemia related to malignancy, multiple myeloma and symptomatic fibrous dysplasia [1–4]. Since 2003, a growing number of reports have been published on
No portion of the article is under consideration for publication elsewhere. The submission of this manuscript has been approved by all authors and by institutions where the work has been carried out. There are no violations of ethical standards or conflicts of interest. None of the authors has financial interests in the subject matter.
R. Guggenberger (*)
:
E. Koral:
G. AndreisekDepartment of Diagnostic and Interventional Radiology, University Hospital Zurich, Raemistrasse 100, 8091 Zurich, Switzerland e-mail: [email protected]
E. Koral
e-mail: [email protected] G. Andreisek
e-mail: [email protected]
W. Zemann
:
C. Jacobsen:
P. MetzlerDepartment of Cranio-Maxillofacial and Oral Surgery, University Hospital Zurich, Frauenklinikstrasse 24, 8091 Zurich, Switzerland W. Zemann e-mail: [email protected] C. Jacobsen e-mail: [email protected] P. Metzler e-mail: [email protected]
avascular necrosis of the jaw associated with the use of bisphosphonates, known as bisphosphonate-related osteonecrosis of the jaw (BRONJ) [5, 6]. The incidence of BRONJ is strongly dependent on oral or intravenous applica-tion and largely varies between 0.0 and 27.5 % depending upon the specific type of bisphosphonate, duration of therapy and the condition for which bisphosphonates were administered [7]. It is characterized by exposed bone in the maxillofacial area that has been present for more than 8 weeks in the setting of prior bisphosphonate treatment. Prior radiation therapy has to be excluded [3]. Different hypotheses exist for the pathogenesis of BRONJ including infection, loss of blood supply, inhibition of bone turnover and dentoalveolar trauma [8,9]. Independent of etiology, early recognition of BRONJ is crucial and seems to be the best strategy to limit its progression [10].
BRONJ is primarily diagnosed clinically but imaging is essential for determining the extent of disease, diagnosing early stages, identifying metastatic disease and excluding fractures [3,11]. Different radiological examinations have been applied in cases of BRONJ but no gold standard has been agreed upon [12–14]. However, conventional radiography and CT scans are widely used and may show periosteal reaction, sclerotic lesions and also mixed bone changes with ill-defined areas of lucency potentially leading to formations of a sequestrum. In the last several years cone-beam computed tomography (CBCT) has been introduced as a diagnostic tool utilizing cone-beam geom-etry, flat panel detectors and 3D reconstruction algorithms. Relatively low radiation doses have been reported compared with conventional CT scans at high isotropic spatial resolution [15–17]. The recent advances in CBCT techniques and soft-ware tools for postprocessing have led to its use in surgical planning especially for head and neck procedures and for detection and quantification of BRONJ [18].
Diagnosis of BRONJ in CBCT is usually based on classical subjective image parameters, such as the detection of perios-teal thickening, sclerosis or bone lucencies, i.e., necrosis [19]. Additionally, changes in bone density lead to changes in x-ray attenuation that can be quantified by calculating mean bone density values (BDV) of a certain area or volume. This can either be measured by 2D regions of interest (ROI) on multiplanar reformations or 3D volumes of interest (VOI) generated from a 3D CBCT data set. The latter approach may potentially facilitate workflow and allow for semiauto-matic BDV measurements. However, CBCT using flat-panel detector technology is known to be susceptible to certain gray-level inconsistencies, i.e., variation of x-ray attenuation [20]. Hence, adequate VOIs and cutoff attenuation values may be influenced by these inconsistencies but have to be applied in order to reliably detect BRONJ.
The purpose of this study was to assess the diagnostic per-formance and consistency of quantitative and qualitative image parameters used in CBCT for the diagnosis of BRONJ with clinical and intraoperative findings as standard of reference.
Materials and methods
Due to the retrospective nature of this study, ethical board approval was not required by local laws and regulations, and the informed consent requirement was waived by the depart-ments where the study was carried out. The study was per-formed according to the guidelines of the Declaration of Helsinki concerning Ethical Principles for Medical Research Involving Human subjects.
Patients
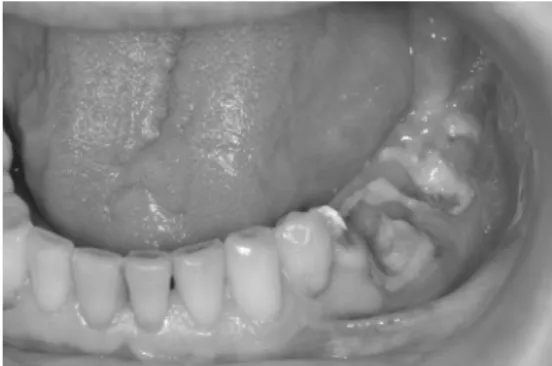
Twenty-two patients (17 females, 5 males, mean age 70.0 years; age range 46–85 years) with BRONJ were retro-spectively included between January 2011 and December 2013. Inclusion criteria were overt BRONJ (Fig.1) diagnosed by a maxillofacial surgeon (XX) with 10 years of professional experience based on generally accepted diagnostic criteria of the American Association of Oral and Maxillofacial Surgeons (AAOMS) [21–23], i.e., exposed bone in the maxillofacial area that has been present for more than 8 weeks in the setting of prior bisphosphonate treatment. Radiation therapy had to be excluded by definition. Other exclusions included any signs of soft tissue infection (swelling, abscess formation) and/or hard tissue infection (osteolysis of spongiotic bone with irregular margins) within the maxilla or mandible. Final exclusions included invasive sinusitis, periapical lesions due to pulpal infection resulting in osteomyelitis and bone tumors of the jaw (primary or metastatic). BRONJ group individuals were re-ferred to the Department of Cranio-Maxillofacial Surgery for clinical and radiological evaluation prior to possible scheduled surgery and had histories of bisphosphonate intake due to osteoporosis (n=7), osseous metastasis and malignancy (n= 15) (Table1). Although BRONJ could not be definitely dis-tinguished from possible metastatic disease by imaging alone, necrotic foci in BRONJ are often associated with bone lysis and fragmentation on the background of bone sclerosis, a finding that is rather rare in bone metastases. Also clinical history with prior bisphosphonate treatment for a substantial amount of time (mean 33.1 months, range 8–120 months) was
Fig. 1 A 65-year-old male patient with clinically overt BRONJ and extensive areas of necrosis and exposed bone in the left mandible
highly suggestive of BRONJ. Definite diagnosis was established by one and/or multiple biopsies obtained by direct surgical excision and subsequent histopathologic analysis. Both clinical and radiological evaluations were used to iden-tify, guide and obtain the target tissue.
An age- and gender-matched healthy control group (be-tween January 2012 and December 2013) included 22 indi-viduals (mean age 68.0 years, age range 45–83 years) whose personal records and CBCT imaging reports revealed no bone pathology of their jaws.
CBCT
All study subjects underwent imaging using the standard clinical cone beam system and standard imaging parameters as established at the authors departments. The following sys-tem was used: a KaVo 3-D eXam (KaVo Dental GmBH, Biberach, Germany) CBCT unit with an amorphous silicon flat-panel detector (20×25 cm). Imaging parameters were as follows: The exposure volume was uniformly set at a height of 102 mm. The size of the minimal isotropic voxel was 0.4 mm. The scan was set at a high-frequency constant potential of 120 kVp. The occlusal plane of each patient was set parallel to the
floor base using ear rods and a chin rest, and patient position was adjusted according to alignment laser beams. All scans were performed by a uniquely trained team of experienced dento-maxillofacial radiographers. According to the manufac-turer’s instructions, the CBCT unit and its software were regularly calibrated using normalized phantom material rec-ommended by the manufacturer.
Acquired 3D data were reconstructed at a transaxial slice thickness of 0.4 mm and transferred to an independent work-station (GE Healthcare, Advantage Workwork-station, AW 4.2) where postprocessing and readout were performed by two independent readers who were blinded to each other and patient data (one radiologist with 4 years of experience in head-and-neck imaging and one surgeon with 5 years of experience in maxillofacial surgery).
Postprocessing and readouts
In a first postprocessing step, volume rendering of the trans-ferred images was performed. In order to exclude soft tissue but include high density/bone material, only lower and upper threshold attenuation values of voxels were set at 200 and 3,071 HU. Then, the mandible was neatly segmented out of
Table 1 Demographics of patients with BRONJ
Gender Age
(years)
Disease Bisphosphonate Duration of treatment
before BRONJ (months)
History of trauma
F 85 Breast cancer Zoledronate 48 Tooth extraction
F 57 Breast cancer Zoledronate 48 –
F 77 Breast cancer Zoledronate 8 Tooth extraction
F 80 Breast cancer Zoledronate 9 Tooth extraction
F 69 Breast cancer Zoledronate 22 Explantation
F 67 Osteoporosis Zoledronate Tooth extraction
F 67 Breast cancer Zoledronate 34 –
M 71 Breast cancer Denosumab 24 Tooth extraction
M 67 Renal cell cancer Zoledronate Explantation
F 67 Osteoporosis Alendronate 36 Tooth extraction
F 75 Osteoporosis Alendronate 120 Tooth extraction
F 64 Breast cancer Zoledronate 9 Tooth extraction
F 83 Osteoporosis Ibandronate 12 Poorly fitting denture
F 46 Melanoma Zoledronate –
F 79 Osteoporosis Ibandronate 18 Tooth extraction
F 61 Malignant mesothelioma Zoledronate 18 Tooth extraction
F 75 Osteoporosis Alendronate 36 –
M 70 Multiple myeloma Zoledronate Implantation
M 65 Lung cancer Zoledronate 36 –
F 60 Breast cancer Zoledronate Tooth extraction
M 79 Prostate cancer Zoledronate 48 –
F 75 Osteoporosis Pamidronate 36 Tooth extraction
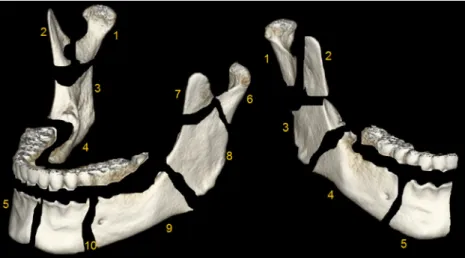
the total volume-rendered scan and each mandible divided into ten different regions (i.e., VOIs) with characteristic anatomic boundaries: condylar process (head and neck), coronoid pro-cess, ascending ramus, posterior mandible and anterior man-dible (Fig.2). Teeth were carefully cropped from the whole mandible and thus not considered for subsequent analysis.
Quantitative analysis
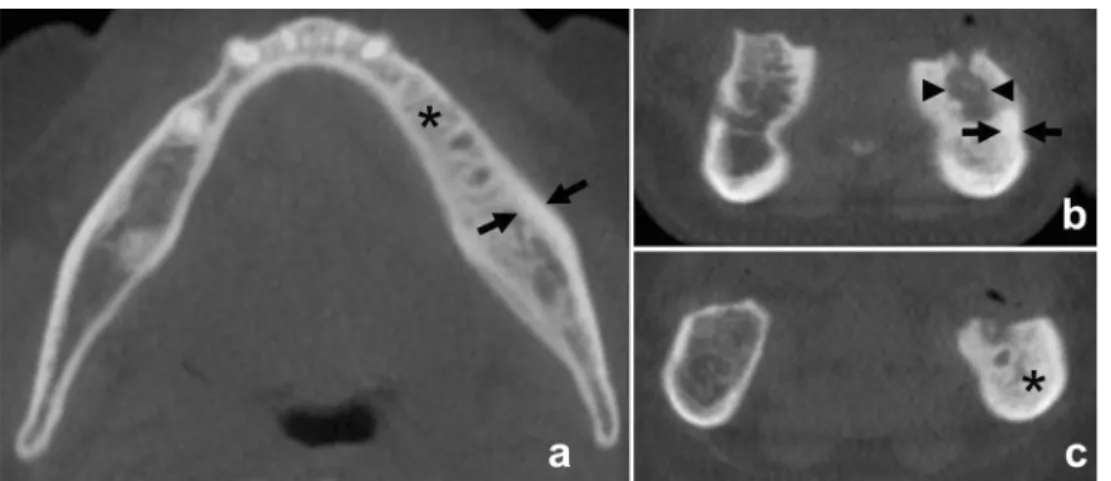
Based on the attenuation value of each voxel, mean bone attenuation, i.e., density values in HU, was measured by placing equally sized ROIs (10 mm2) in the center of each segmented mandibular region on axial images of each mandible. Care was taken to include spongiotic bone only and to exclude cortical bone (Fig.3). The mean BDVs of each segmented VOI and the entire volume of each mandible were recorded.
Qualitative analysis
Transaxial plane views of the mandible were used for qualitative analysis. Two independent readers visually scored each mandib-ular region for the presence of BRONJ according to three differ-ent parameters: necrosis with lucency, sclerosis and periosteal thickening. Each parameter was graded on a 5-point Likert scale (1=not present, 2=probably present, 3=slightly present, 4= moderately present and 5=markedly present) (Fig.4).
Statistical analysis
All statistical analysis was performed using SPSS version 19.0 (SPSS, IBM Corp., NY, NY, USA). For quantitative evalua-tion the interreader agreement was assessed by calculating intraclass correlation coefficients (ICCs). Interreader agree-ment for qualitative parameters was assessed by calculating
kappa values. According to Landis and Koch [24], ICC and kappa values were interpreted as follows: <0 as poor, 0–0.2 as slight, 0.21–0.4 as fair, 0.41–0.60 as moderate, 0.61–0.80 as substantial and values between 0.81 and 1 as almost perfect agreement . Quantitative and qualitative data were also ana-lyzed with receiver-operating characteristic (ROC) analysis, and the area under ROC curve was employed as an estimate of the diagnostic performance. From optimal cutoff values re-spective sensitivities and specificities were calculated. Un-paired Student’s t-tests were used to compare mean BDVs of mandibular bone between different groups. Spearman rank test was used to analyze correlation between the BDVs and anatomic region of healthy mandibles. A p-value of 0.05 was considered statistically significant.
Results
All intraoperatively taken specimens showed distinct histo-pathological features of BRONJ. In total 23 regions (100 %)
Fig. 2 Whole mandible (left) and right hemimandible (right). The man-dible was neatly segmented out of the total volume-rendered scan volume and divided into ten different regions: right hemimandible: condylar process=region 1, coronoid process=region 2, ramus=region 3, posterior mandible=region 4, anterior mandible=region 5, left hemimandible:
condylar process=region 6, coronoid process=region 7, ramus=region 8, posterior mandible=region 9, anterior mandible=region 10. Note: the alveolar process including teeth was carefully cropped from the whole mandible and not considered for ensuing analysis
Fig. 3 Equally sized ROIs (10 mm²) were placed in the center of each mandibular region on axial images. ROIs 4 and 9 indicate posterior mandible, 5 and 10 indicate anterior mandible regions. Care was taken to include spongiotic bone only and to exclude cortical bone. Note BRONJ with increased bone density in the left posterior mandible (region 9)
were affected by BRONJ: 7 cases in region 4 (30 %), 2 cases in region 5 (9 %), 12 cases in region 9 (52 %) and 2 cases in region 10 (9 %) of the mandible. Consecutively, four cases were in the anterior mandible (18 %), while the majority of total lesions (19 lesions, 82 %) were localized in the posterior mandible.
Quantitative analysis
Descriptive data of the quantitative mean BDV VOI and ROI of affected (BRONJ) and nonaffected regions of the mandible are presented in Table 2. An illustration of the distribution
among the ten different regions is provided by box plots (Fig.5).
Overall interreader agreements for mean BDV VOI and mean BDV ROI were“almost perfect.” Corresponding ICCs were 0.864 and 0.948, respectively (all p<0.001). Mean BDV VOIs of whole mandibles were not significantly different between the BRONJ and control group (p=0.099).
An increase in the mean bone density value from the condylar process (head/neck) to the anterior hemimandible in healthy individuals was found [484 to 992 (Δ508) HU for BDV VOI and 206 to 834 (Δ628) HU for BDV ROI]. Spearman correlation coefficients for mean BDV VOI with region number were 0.89 (p<0.001) and for mean BDV ROI
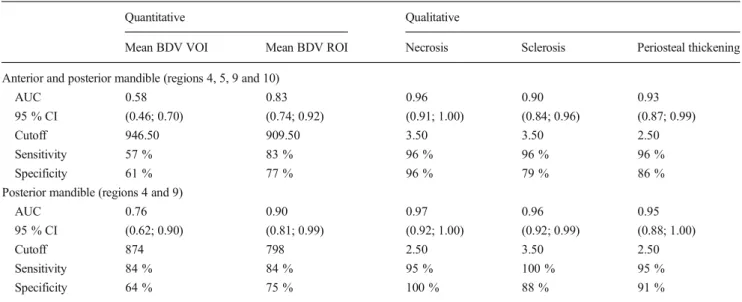
Fig. 4 a BRONJ with sclerosis (asterisk) and periosteal thickening (arrows) in the left anterior and posterior mandible of a 70-year-old male patient with multiple myeloma receiving zoledronate for an uncertain period of time. Sclerosis and periosteal thickening were rated 3 (slightly present) and 4 (moderately present) on the 5-point Likert scale,
respectively. b and c BRONJ in the left anterior mandible of a 65-year-old man with lung cancer receiving zoledronate for 36 months with marked bone necrosis (arrowheads), periosteal thickening (arrows) and adjacent sclerosis (asterisk). Findings were all rated 5 (markedly present) on the 5-point Likert scale
Table 2 Descriptive data of mean bone density values (BDV) in Hounsfield units (HU) of affected (BRONJ) and nonaffected mandibular regions
VOI ROI Mandibular region Number of mandibles affected (n) Mean BDV VOI nonaffected (± SD) Mean BDV VOI affected (± SD)
P value Mean BDV ROI
nonaffected (± SD) Mean BDV ROI affected (± SD) P value 1 – 480.4 (±49.0) 202.2 (±116.4) 2 – 710.1 (±77.2) 881.9 (±03.1) 3 – 724.1 (±83.3) 541.5 (±206.7) 4 7 855.6 (±76.6) 946.1 (±63.3) 0.005 669.9 (±181.9) 1,044.3 (±136.7) 0.001 5 2 1,002.4 (±96.5) 982.0 (±101.8) 0.772 840.3(±211.4) 1,165.0 (±195.2) 0.039 6 – 488.0 (±62.6) 209.7 (±131.2) 7 – 725.2 (±82.3) 885.6 (±202.1) 8 – 737.3 (±96.2) 550.8 (±257.2) 9 12 853.2 (±72.9) 934.1 (±119.8) 0.009 631.2 (±175.1) 985.7 (±240.7) 0.001 10 2 981.7 (±108.2) 1,063.0 (±8.5) 0.299 828.2 (±213.2) 1,139.0 (±231.9) 0.051
Regions: right hemibandible: condylar process=region 1, coronoid process=region 2, ramus=region 3, posterior mandible=region 4, anterior mandible=region 5; left hemibandible: condylar process=region 6, coronoid process=region 7, ramus=region 8, posterior mandible=region 9, anterior mandible=region 10. Note: data of whole mandibles (region 11) showed no significant differences between affected and nonaffected jaws but are not depicted in this table in order to keep with consistent region numbering from 1 to 10
0.48 (p<0.001), and if regions 2 and 7 (=coronoid process) were excluded, the correlation coefficient for mean BDV VOI was 0.92 (p < 0.001) and for mean BDV ROI 0.79 (p < 0.001).
ROC Analysis
The area under the curve (AUC) for mean BDV VOI and mean BDV ROI was 0.58 and 0.83, respectively. Using a
cutoff BDV of 947 and 910 HU, a sensitivity of 57 and 83 % with a specificity of 61 and 77 % was calculated, respectively (Fig.6and Table3).
If the analysis was restricted only to posterior mandible regions (regions 4 and 9) where 82 % of the total lesions were located, the AUC values for mean BDV VOI and mean BDV ROI were 0.76 and 0.9, respectively. Using a cutoff BDV of 874 and 798 HU, a sensitivity of 84 % with a specificity of 64 and 75 % was calculated, respectively.
Fig. 5 Box plot diagram shows the mean BDV VOI a and mean BDV ROI b distribution for BRONJ-affected and -nonaffected regions of the mandible. Right hemimandible: condylar process=region 1, coronoid process = region 2, ramus = region 3, posterior mandible = region 4,
anterior mandible=region 5, left hemimandible: condylar process=region 6, coronoid process=region 7, ramus=region 8, posterior mandible= region 9, anterior mandible=region 10. Asterisks mark statistical signif-icance: * <0.05, **<0.01, ***<0.001
Fig. 6 Receiver-operating characteristic (ROC) curves for mean BDV VOI and mean BDV ROI a and for necrosis, sclerosis and periosteal thickening b considering clinical and intraoperative findings as standard of reference for the presence of BRONJ
Qualitative analysis
The frequencies of the qualitative parameters for BRONJ-affected regions are presented in Table4. The mean score for the three qualitative parameters (necrosis, sclerosis and perios-teal thickening) were 4.61 (SD±0.89), 4.74 (SD±0.86) and 4.39 (SD±0.99); 17 (74 %) out of 23 BRONJ foci showed osteolytic changes/necrosis, and periostal thickening was seen in 14 (61 %) foci. There was moderate to almost perfect interreader agreement for presence of necrosis, sclerosis and periosteal thickening (kappa values: 0.575, 0.617 and 0.885, respectively).
ROC Analysis
AUC values from ROC analysis for qualitative parameters were 0.96 for necrosis, a cutoff score of 3.50 resulting in
sensitivity of 96 % and specificity of 96 %; 0.90 for sclerosis, a cutoff score of 3.50 resulting in sensitivity of 96 % and specificity of 79 %; 0.93 for periosteal thickening, a cutoff score of 2.50 resulting in sensitivity of 96 % and specificity of 86 %. Thus, high accuracies were obtained for all qualitative parameters (Fig.6and Table3).
If the analysis was restricted only to posterior mandible regions (regions 4 and 9) where 82 % of the total lesions were located, AUC values from ROC analysis for qualitative pa-rameters were 0.96 for necrosis, a cutoff score of 2.5 resulting in sensitivity of 95 % and specificity of 100 %; 0.96 for sclerosis, a cutoff score of 3.5 resulting in sensitivity of 100 % and specificity of 88 %; 0.95 for periosteal thickening, a cutoff score of 2.50 resulting in sensitivity of 95 % and specificity of 91 %.
Discussion
Several reports have evaluated the appearance of BRONJ in different imaging modalities. Radiography is usually consid-ered as first-line, while CT and MRI as second-line imaging modalities. MRI may not only help to determine the number and extension of foci, including soft tissue involvement, but also allow for early disease detection [25]. However, major issues were discovered when research studies were performed comparing radiography, CT, MRI, scintigraphy, SPECT-CT and positron emission tomography. Several studies revealed substantial differences in interpretation of disease extent based
Table 3 ROC analysis for quantitative (mean bone density values, mean BDV) and qualitative image parameters (necrosis, sclerosis and periosteal thickening) of BRONJ-affected mandibular regions
Quantitative Qualitative
Mean BDV VOI Mean BDV ROI Necrosis Sclerosis Periosteal thickening
Anterior and posterior mandible (regions 4, 5, 9 and 10)
AUC 0.58 0.83 0.96 0.90 0.93
95 % CI (0.46; 0.70) (0.74; 0.92) (0.91; 1.00) (0.84; 0.96) (0.87; 0.99)
Cutoff 946.50 909.50 3.50 3.50 2.50
Sensitivity 57 % 83 % 96 % 96 % 96 %
Specificity 61 % 77 % 96 % 79 % 86 %
Posterior mandible (regions 4 and 9)
AUC 0.76 0.90 0.97 0.96 0.95
95 % CI (0.62; 0.90) (0.81; 0.99) (0.92; 1.00) (0.92; 0.99) (0.88; 1.00)
Cutoff 874 798 2.50 3.50 2.50
Sensitivity 84 % 84 % 95 % 100 % 95 %
Specificity 64 % 75 % 100 % 88 % 91 %
Regions: right hemibandible: condylar process=region 1, coronoid process=region 2, ramus=region 3, posterior mandible=region 4, anterior mandible=region 5; left hemibandible: condylar process=region 6, coronoid process=region 7, ramus=region 8, posterior mandible=region 9, anterior mandible=region 10
Table 4 Frequencies of scores of qualitative parameters for BRONJ-affected anterior and posterior mandible regions
Necrosis Sclerosis Periosteal thickening
Score Frequency (Percentage of total) Frequency (Percentage of total) Frequency (Percentage of total) 1 1 (4.3) 1 (4.3) 1 (4.3) 2 3 2 (8.7) 4 5 (21.7) 2 (8.7) 6 (26.1) 5 17 (73.9) 20 (87.0) 14 (60.9)
Scores:1=not present, 2=probably present, 3=slightly present, 4=mod-erately present and 5=markedly present
upon the imaging modality used [12–14]. These variances hindered clear-cut definition of disease borders and straight-forward therapy planning. As CBCT has gained increasing attention in recent years because of the presumably reduced radiation dose when compared to standard multidetector CT, it has become more important to assess its diagnostic perfor-mance in the detection and quantification of BRONJ, espe-cially when surgical therapy is planned. In a recent study, Cankaya et al. found attenuation measurements in CBCT using Hounsfield units (HU) to be efficient in the diagnosis of BRONJ [1], corroborating the current notion of bone den-sity changes in the evolution of BRONJ. We could show that quantitative BDV assessments are reliable procedures with high interreader agreement, based on either ROI or VOI measurements (ICC values for mean BDV VOI and mean BDV ROI of 0.864 and 0.968, p<0.001), reflecting rather high reproducibility independent of reader experience. We have however found different performances for both postprocessing algorithms. ROI-based measurements resulted in a higher AUC than VOI-based measurements. Consecu-tively, sensitivity/specificity at the respective cutoff BDVs amounted to only 57/61 % in VOI- as opposed to 83/77 % in ROI-based BDV measurements. This unexpected moderate performance of VOI-based measurements might be partly due to the specific segmentation process during postprocessing. Although it was a semiautomatic step performed in a stan-dardized way by both readers blinded to the presence or absence of BRONJ, the region borders had to be chosen according to each reader’s judgement. This was based on what they thought would cover the affected bone areas and on what the typical anatomic region borders of the mandible were. On the other hand, ROIs were simply placed in the center of each region excluding cortical bone. However, if a region was affected by BRONJ with concomittant locally altered anato-my, volume loss or density changes in the centrally positioned ROI could have been inadvertently placed in the peripheral, mostly sclerotic area of a BRONJ. Thus, BDVs of ROIs in BRONJ-affected regions were likely higher than in standard-ized VOI segmentations. Additionally, although much care was taken to crop teeth, including radices, minimal radicular remnants may have slightly increased the mean BDVs of VOIs, thereby reducing discrimination of healthy from path-ologic conditions.
Interestingly, no difference was seen between the mean BDV of whole mandibles between healthy and diseased indi-viduals (p=0.099). The overall bone density changes might be too small to detect when looking at whole mandibles. How-ever, in healthy individuals an interesting increase of mean BDV was seen from the condylar process toward the anterior hemimandible in both ROI and VOI algorithms. This correla-tion was even more pronounced when the very thin and mostly sclerotic coronoid process was excluded from the analysis. To the authors’ knowledge, this has not been
described before. Mean bone density reflects adaptive reac-tions to biomechanic forces [26]. Regions with increased BDV may therefore be exposed to increased masticatory forces, as is the case in the mandibular body. This finding is important as different cutoff BDVs for discrimination of physiologic from pathologic conditions apply to different regions of the mandible. The cutoff BDVs for ROI and VOI based measurements presented herein apply to the anterior and/or posterior mandibular body only, as only these regions were affected by BRONJ in our study population. Eighty-two percent of total lesions in our study population were localized in the posterior mandible regions. When focusing only on these cases, respective AUCs from ROC analyses increased considerably with improved sensitivity and specificity for both VOI- and ROI-based approaches. We acknowledge the fact that respective cutoff attenuation values may perform best when applied in these specific situations. However, diagnostic performance is also rather good when dealing with BRONJ in the combined anterior and posterior mandible, i.e., the entire mandibular body. In the authors’ experience, other parts of the mandible may rarely be affected with BRONJ, and attenuation changes may not occur or be easily detected, e.g., the coronoid process.
Surprisingly, qualitative analysis scores for necrosis, scle-rosis and periosteal thickening showed a higher diagnostic performance than quantitative BDV measurements. AUCs with sensitivity and specificity were high for all criteria, with the highest values seen for necrosis and periosteal thickening. This finding supports the personal experience of the authors and other reports [1,3] that early and mostly subtle changes in BRONJ often begin with periosteal thickening prior to evolv-ing into overt sclerotic foci. On the other hand, focal osteolytic changes reflect bone degradation specific to advanced stages of osteonecrosis. Seventeen (74 %) out of 23 BRONJ foci showed osteolytic changes/necrosis, and periosteal thickening was seen in 14 (61 %) foci. Sclerosis at different degrees was also common. These scores seem to reflect rather advanced stages of BRONJ in our study population. Although interreader agreements for qualitative analysis were moderate to almost perfect, they were somewhat inferior to the quanti-tative results. In our study population there was a high inci-dence of third generation bisphosphonates, i.e., highly potent, nitrogen-containing compounds with anti-bone resorptive and -angiogenic effects, which have been associated with higher incidences of BRONJ [27]. However, age is an independent risk factor for development of BRONJ, and the mean patient age of the study population was 70 years, i.e., rather high. In addition, prior to diagnosis most of the patients had undergone surgical procedures such as tooth extraction. This traumatiza-tion of the jaw bone may additraumatiza-tionally have triggered and increased the incidence of BRONJ with development of ad-vanced stages. Hence, the diagnostic performance of CBCT in early stages unfortunately cannot be inferred from our data.
Early stages of BRONJ are associated with nonspecific clin-ical symptoms, and imaging is often delayed or may be nondiagnostic. CBCT may be able to detect early changes, e.g., periosteal thickening or bone density changes, before overt necrotic bone is seen on visual inspection. This however should be the focus of future studies, as earlier detection may lead to more efficient therapy.
We acknowledge certain limitations to this study. First, a rather small sample size of 22 patients with BRONJ was analyzed. The study was retrospective, and control subjects were included nonconsecutively. In addition, BRONJ foci were mostly found in the posterior mandible (82 %). Further studies with larger cohorts and varied BRONJ locations are required. Second, each group (healthy vs. BRONJ) consisted of 17 female and only 5 male individuals, leading to a female majority. Therefore, subtle gender-specific differences cannot be ruled out with certainty. Third, CBCT bone density mea-surements do not yield equally robust bone density measure-ments as compared to quantitative multidetector CT (q-CT), for example. However, the CBCT system used in this study to image all patients is regularly calibrated, and identical patient positioning and reconstruction algorithms assure comparable imaging data.
Conclusion
BRONJ can effectively and reliably be diagnosed and quan-tified with CBCT. Qualitative image parameters yield a higher diagnostic performance than quantitative bone density values, among which ROI-based attenuation measurements were more accurate than VOI-based measurements. Future studies should focus on the potential of CBCT to detect early, clini-cally not fully overt BRONJ.
Conflict of interest statement The authors declare that they have no
conflict of interest.
References
1. Cankaya AB, Erdem MA, Isler SC, et al. Use of cone-beam comput-erized tomography for evaluation of bisphosphonate-associated osteonecrosis of the jaws in an experimental rat model. Int J Med
Sci. 2011;8(8):667–72.
2. Fehm T, Beck V, Banys M, et al. Bisphosphonate-induced osteonecrosis of the jaw (ONJ): incidence and risk factors in patients with breast cancer and gynecological malignancies. Gynecol Oncol.
2009;112(3):605–9.
3. Morag Y, Morag-Hezroni M, Jamadar DA, et al. Bisphosphonate-related osteonecrosis of the jaw: a pictorial review. Radiographics.
2009;29(7):1971–84.
4. Orcel P, Beaudreuil J. Bisphosphonates in bone diseases other than osteoporosis. Joint Bone Spine: revue du rhumatisme. 2002;69(1):
19–27.
5. Marx RE, Sawatari Y, Fortin M, Broumand V. Bisphosphonate-induced exposed bone (osteonecrosis/osteopetrosis) of the jaws: risk factors, recognition, prevention, and treatment. J Oral Maxillofac
Surg. 2005;63(11):1567–75.
6. Ruggiero SL, Mehrotra B, Rosenberg TJ, Engroff SL. Osteonecrosis of the jaws associated with the use of bisphosphonates: a review of 63
cases. J Oral Maxillofac Surg. 2004;62(5):527–34.
7. Kuhl S, Walter C, Acham S, Pfeffer R, Lambrecht JT.
Bisphosphonate-related osteonecrosis of the jaws–a review. Oral
Oncol. 2012;48(10):938–47.
8. Migliorati CA, Schubert MM, Peterson DE, Seneda LM. Bisphosphonate-associated osteonecrosis of mandibular and maxil-lary bone: an emerging oral complication of supportive cancer
ther-apy. Cancer. 2005;104(1):83–93.
9. Migliorati CA, Woo SB, Hewson I, et al. A systematic review of bisphosphonate osteonecrosis (BON) in cancer. Support Care Cancer. 2010;18(8):1099–106.
10. Chamizo Carmona E, Gallego Flores A, Loza Santamaria E, Herrero Olea A, Rosario Lozano MP. Systematic literature review of biphosphonates and osteonecrosis of the jaw in patients with osteo-porosis. Reumatol Clin. 2012.
11. Krishnan A, Arslanoglu A, Yildirm N, Silbergleit R, Aygun N. Imaging findings of bisphosphonate-related osteonecrosis of the jaw with emphasis on early magnetic resonance imaging findings. J Comput Assist Tomogr. 2009;33(2):298–304.
12. Dore F, Filippi L, Biasotto M, Chiandussi S, Cavalli F, Di Lenarda R. Bone scintigraphy and SPECT/CT of bisphosphonate-induced osteonecrosis of the jaw. J Nucl Med. 2009;50(1):30–5.
13. Stockmann P, Hinkmann FM, Lell MM, et al. Panoramic radiograph, computed tomography or magnetic resonance imaging. Which im-aging technique should be preferred in bisphosphonate-associated osteonecrosis of the jaw? a prospective clinical study. Clin Oral Investig. 2010;14(3):311–7.
14. Guggenberger R, Fischer DR, Metzler P, Andreisek G, Nanz D, Jacobsen C, et al. Bisphosphonate-induced osteonecrosis of the jaw: comparison of disease extent on contrast-enhanced MR imag-ing, [18 F] Fluoride PET/CT, and conebeam CT imaging. AJNR Am J Neuroradiol. 2012.
15. Kyriakou Y, Kolditz D, Langner O, Krause J, Kalender W. [Digital volume tomography (DVT) and multislice spiral CT (MSCT): an objective examination of dose and image quality]. Röfo.
2011;183(2):144–53.
16. De Vos W, Casselman J, Swennen GR. Cone-beam computerized tomography (CBCT) imaging of the oral and maxillofacial region: a systematic review of the literature. Int J Oral Maxillofac Surg.
2009;38(6):609–25.
17. Miracle AC, Mukherji SK. Conebeam CT of the head and neck, part
1: physical principles. AJNR Am J Neuroradiol. 2009;30(6):1088–
95.
18. Miracle AC, Mukherji SK. Conebeam CT of the head and neck, part
2: clinical applications. AJNR Am J Neuroradiol. 2009;30(7):1285–
92.
19. Wilde F, Heufelder M, Lorenz K, et al. Prevalence of cone beam computed tomography imaging findings according to the clinical stage of bisphosphonate-related osteonecrosis of the jaw. Oral Surg
Oral Med Oral Pathol Oral Radiol. 2012;114(6):804–11.
20. Mori S, Endo M, Komatsu S, Kandatsu S, Yashiro T, Baba M. A combination-weighted feldkamp-based reconstruction algorithm for
cone-beam CT. Phys Med Biol. 2006;51(16):3953–65.
21. Colella G, Campisi G, Fusco V. American Association of oral and maxillofacial surgeons position paper: bisphosphonate-related osteonecrosis of the jaws-2009 update: the need to refine the
22. Ruggiero SL, Dodson TB, Assael LA, et al. American association of oral and maxillofacial surgeons position paper on
bisphosphonate-related osteonecrosis of the jaws–2009 update. J Oral Maxillofac
Surg. 2009;67(5 Suppl):2–12.
23. Advisory Task Force on Bisphosphonate-Related Ostenonecrosis of the Jaws AAoO, Maxillofacial S. American association of oral and maxillofacial surgeons position paper on bisphosphonate-related
osteonecrosis of the jaws. J Oral Maxillofac Surg. 2007;65(3):369–
76.
24. Landis JR, Koch GG. The measurement of observer agreement for
categorical data. Biometrics. 1977;33(1):159–74.
25. Garcia-Ferrer L, Bagan JV, Martinez-Sanjuan V, et al. MRI of man-dibular osteonecrosis secondary to bisphosphonates. AJR Am J
Roentgenol. 2008;190(4):949–55.
26. Mavropoulos A, Kiliaridis S, Bresin A, Ammann P. Effect of differ-ent masticatory functional and mechanical demands on the structural adaptation of the mandibular alveolar bone in young growing rats.
Bone. 2004;35(1):191–7.
27. Boonyapakorn T, Schirmer I, Reichart PA, Sturm I, Massenkeil G. Bisphosphonate-induced osteonecrosis of the jaws: prospective study of 80 patients with multiple myeloma and other malignancies. Oral