DOI: http://dx.doi.org/10.18753/2297-8224-130
Routine Workers in an Increasingly Automated World of Work: Evidence from
Switzerland
Thomas KURER
1Harvard University
Abstract
This paper explores the distributional consequences of technological change on mid-skilled routine workers in Switzerland in three steps: (1) The first part studies aggregate trends in the labor market and confirms the pattern of an eroding middle: The disadvantages of technological progress are concentrated on routine workers whose share in the labor force has drastically declined over time. (2) In order to better understand the economic conditions associated with this overall pattern, the second part draws on individual-level panel data to study actual employment transitions. The analysis shows that transitions are less frequent than the aggregate pattern might suggest: Only a minority of routine workers actually switches to other jobs while the largest chunk of the decline is explained by ‘natural transitions’ into retirement. (3) The last part of the paper builds on original survey data to examine routine workers’ subjective assessment of their chances in a changing world of work and demonstrates a surprisingly high degree of consciousness about susceptibility to automation. To conclude, I discuss some societal implications of the ‘hollowing of the middle’.
Keywords: Employment Polarization, Automation, Technological Change, Routine Work, Hollowing of the Middle, Panel Data, Switzerland
Introduction
The political economies of the developed world are today on the cusp of a profound trans-formation of labor markets. The most important factor behind long-term occupational change is technology (Manning 2003; Oesch 2013). Rapid advances in automation and computeriza-tion push us into a new era where many existing skills and competencies become increasingly redundant. It should thus not come as a surprise that these rapid improvements in technolog-ical possibilities have sparked a lively public and scientific debate on their impact on labor
1 Thomas Kurer is Berggruen-Weatherhead Postdoctoral Fellow at the Harvard University, Weatherhead Research Clus-ter on Global Populism/Challenges to Democracy: [email protected]
markets and employment opportunities. While some pioneering studies attracted a lot of at-tention with alarmingly high estimates of job replacement (e.g. Frey/Osborne 2013, 2017), the literature more recently has painted a less pessimistic picture of overall employment effects (Arntz et al. 2016; Autor/Salomons 2018). In a new working paper, Gregory et al. (2019) even suggest that new technologies result in a net gain in jobs since positive side effects on the pric-es of tradable goods create labor demand that outweighs direct substitution effects.
Technological change has important distributive implications due to its highly heteroge-neous impact on different occupations. In a seminal contribution to the literature, Autor et al. (2003) established that computers tend to complement workers in non-routine jobs whereas they substitute workers in routine jobs. Routine tasks are understood as activities that follow a given protocol or a set of explicit rules. Computers are a very powerful competitor to humans as long as the required rules are standardized, that is, codifiable, and can subsequently be ap-plied in a repetitive way. It is important to emphasize that routine work should not be mistak-en for low-skilled work. Exactly because of the initial effort to learn and get acquainted with a possibly broad and complex set of rules, most routine jobs require a certain level of education and/or vocational training and are thus located in the (lower) middle of the education and income distribution. Many blue-collar jobs, e.g. mining plant operators or textile machine operators, belong to this category but also a significantly large part of basic white-collar work in administration or accounting.
Much in contrast, many low-pay jobs have so far been less susceptible to automation de-spite lower skill requirements to enter these jobs. Again, this is due to the task content of such jobs, which might be characterized by lower complexity but also lower levels of routineness. In contemporary labor markets, most low-skill work is found in personal services, which often require personal interaction, flexibility due to customer contact, or “hand-eye coordination" (Manning 2003). Examples include security guards, travel stewards, pet groomers, or – at least up to now – services related to personal transportation. While trivial for most humans, such simple non-routine manual tasks are difficult to codify in static protocols and thus harder to automate.
Finally, jobs that combine specialized skills with non-routine tasks are least susceptible to automation. Non-routine cognitive jobs are characterized by a heavy emphasis on analytical capabilities and problem-solving skills and usually require a higher degree. Jobs with a mana-gerial function belong to this category but also most employees in teaching, research and de-velopment, medical practitioners or workers in the creative industry, among others.
The realization that automation and digitalization affect labor demand on the basis of the task-content rather than the skill-content of a job has important distributive consequences. The traditional skill-biased technological change (SBTC) hypothesis (Katz/Autor 1999; Goldin/Katz 2009) expects workers’ benefits from technology to increase with their skill-level, which results in the prediction of a general upgrading of the employment structure over time. The more nuanced routine-biased technological change (RBTC) hypothesis (Autor et al. 2003; Goos/Manning 2007; Goos et al. 2014), in contrast, predicts a polarization of the labor force due to the decline in mid-skilled routine jobs and the growth in both low-skilled and high-skilled non-routine jobs.
Conceptualization of Task Groups
The following sections aim to empirically underpin the conjecture of widespread job po-larization. I follow the aforementioned approach introduced by Autor et al. (2003), which classifies occupations into three conceptually distinct groups according to the bundle of tasks that characterize a job. A task-based approach centers around the task profile of every single occupation. Two different strategies have been used to the end of classifying jobs into task-based categories (see, e.g., Aeppli et al. 2017: p. 42f). On the one hand, labor market experts have created specific and very detailed job databases, which build on various sources such as labor contracts, collective agreements or descriptions of advanced vocational training courses. Arguably the most well-known and most often used database is the Dictionary of Occupation-al Titles (DOT) and its successor O*NET, which contains a rich set of variables to describe both work and worker characteristics. On the other hand, a survey-based approach asks re-spondents directly about the task content of their jobs. In any case, labor market experts can then use these detailed descriptions to categorize jobs into broader groups according to their task profile, or, more precisely, according to the dominating set of tasks that describes an oc-cupation.
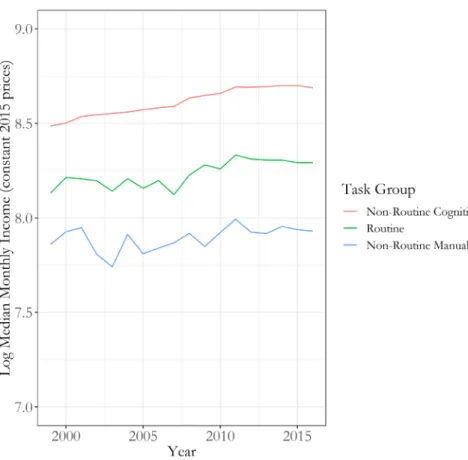
Figure 1: Wage Level by Task Group.
Source: Swiss Household Panel, 1999-2016
I largely rely on Daniel Oesch’s (2013: p. 156) grouping that classifies occupations into six task groups (non-routine service, non-routine manual, routine cognitive, routine manual,
non-routine analytical, and non-routine interactive) but collapse the two subgroups within each of the three aforementioned major task groups in order to comply with simplified stand-ard classification in labor economics (Autor et al. 2003). Table A1 provides all details of the final grouping.2
The resulting three task groups (non-routine manual, routine, non-routine cognitive) are conceptually distinct in that they are (1) dominated by either non-routine or routine tasks and that they (2) vary in skill requirement. The two aspects combined yield a rough ordinal group-ing in terms of occupational prestige and job quality with non-routine manual jobs at the bot-tom, routine jobs in the middle and non-routine cognitive jobs at the top. Figure 1 provides empirical evidence for this rank order by plotting the development of each task groups’ medi-an wage level, a frequent proxy for medi-an ordinal measure of job quality (see, e.g., Goos/Mmedi-anning 2007; Oesch 2013).3 The rank order with respect to earnings is very clear-cut and stable over time. Kurer (2017) shows that the notion of routine workers being in the middle of the occu-pational structure also holds for other worker characteristics, most importantly skill level, and is robust beyond Switzerland since very similar patterns emerge in Germany and the United Kingdom.
Employment Polarization Across Europe
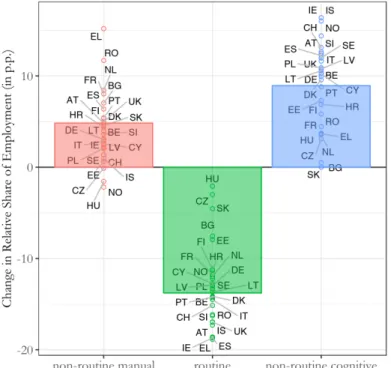
4Before zooming in on Switzerland, this section provides a broad cross-national overview over changes in the employment structure across Europe. Empirical evidence indeed strongly supports the prediction of increasing job polarization. Figure 2 shows relative changes in em-ployment since the mid-1990s across Europe (Kurer/Palier 2019). While distinct institutional set-ups create different shapes of the employment structure, leading to more or less pro-nounced patterns of polarization (Fernandez-Macias 2012), the hollowing of the middle is strikingly consistent. Growing job opportunities at both ends of the skill- and earnings distri-bution are accompanied by a strong decline in routine work in each and every country cov-ered by the data. Acknowledging the fact that job growth in high-skilled non-routine jobs outweighs the increase in low-skilled non-routine jobs, one might describe the displayed evo-lution of the employment structure as “polarized upgrading" (Oesch & Rodriguez-Menes 2011).
2 The exception is the grouping underlying Figure 2 because the used data source (Eurostat) only provides ISCO 1-digit codes. The coding follows the same logic but is based on much more aggregated occupational codes. It can be seen as an approximation of the more precise and reliable approach I apply in the rest of this paper.
3 Wage levels of non-routine cognitive workers are estimated much more precisely because this group is, on average, about double the size of the two other task groups – a reflection of Switzerland’s increasingly high-skilled and largely post-industrial labor force (see also Oesch & Murphy 2017).
Figure 2: Aggregate Employment Changes – Cross-National Perspective:
Source: Kurer/Palier 2019
Note: Country-specific changes are share of labor force in 2017 minus share in first available year (varying, most countries between 1992 and 1998, BG = 2000, HR = 2002). Task groups are classified based on ISCO-1d codes. Non-routine manual = Service and Sales Workers; Elemen-tary Occupations. Routine = Clerical Support Workers; Skilled Agricultural, Forestry and Fish-ery Workers; Craft and Related Trade Workers; Plant and Machine Operators and Assemblers. Non-Routine Cognitive = Managers; Professionals; Technicians and Associate Professionals. Bars are population-weighted average changes across countries. Data source: Eurostat.
Technological Change and Routine Work in Switzerland
The following analysis of routine workers’ labor market prospects in Switzerland addresses the following questions: (1) Does the evolution of the aggregate employment structure resem-ble the cross-national pattern shown above? (2) Where do (former) routine workers end up and what is the relative frequency of different labor market transitions? (3) Are routine work-ers aware of increasingly bleak labor market prospects?
Aggregate Patterns
The first step of the empirical analysis replicates the aggregate patterns shown in the introduc-tion for the Swiss case with better data and a more fine-grained classificaintroduc-tion of occupaintroduc-tions into the three task groups. Figure 3 displays relative changes in employment shares between 1999 and 2016 based on the Swiss Household Panel (SHP) and confirms both a strong decline in routine work and a similarly strong growth in high-skilled non-routine cognitive jobs. In
contrast to other European countries, at least since 1999, Switzerland has not seen an expan-sion in low pay and low-skill non-routine manual jobs (for similar findings based on different data and time spans, see Oesch/Rodriguez-Menes 2011; Nathani et al. 2017). This is a likely consequence of the comparatively high cost of labor, which makes services provided by non-routine manual workers expensive and limits the demand for such jobs.5
Figure 3: Aggregate Employment Changes – Switzerland
Source: Swiss Household Panel, 1999-2016
Coming back to the two initially discussed theoretical approaches, it appears that neither perfectly explains this pattern but that a combination of skill- and task-based explanations fits best. While the RBTC hypothesis correctly predicts the pronounced decline in routine work, the expectation of a growth in all kinds of non-routine jobs, including low-skilled ones, is not met. At the same time, the SBTC hypothesis is correct in its expectation that high skills are complements to new technology but fails to explain the relatively larger decline in mid-skilled as opposed to low-skilled jobs.
5 A recent Financial Times article provided a nice illustration of the consequences of differential labor cost on the de-mand for non-routine manual work by discussing differences in the art of car maintenance between the US and Norway (Sandbu 2019). While human car washers are abundant in the US, this kind of work has ceased to exist in Norway a long time ago. Norwegians either wash their cars in automated car-wash centers – or do the job themselves. The level of wages, especial-ly at the lower end of the income distribution, determines how economical automation is. At the same time, automation increases productivity and, thus, wages. The second aspect is wage compression: the more equal wages are, “the less point there is in paying others to carry out such tasks for you" (Sandbu 2019). The demand for less skilled work thus depends on unskilled wages relative to skilled ones as well as on the relative cost of automation.
Individual Occupational Transitions
While the strong increase in high skill and high pay jobs is certainly good news for the devel-opment of the Swiss employment structure, the persistent decrease of routine jobs is a source of concern. It confronts a shrinking but still sizable and relevant share of the labor force with increasingly bleak prospects in the labor markets of tomorrow. Despite their continuous de-cline, according to the Swiss Household Panel, routine workers still accounted for about a fourth of the Swiss labor force in 2017.
The societal consequences of the decline in routine work strongly depend on routine workers’ exit options out of the squeezed middle. The implications of the hollowing of the middle are very different depending on whether routine workers leave their jobs for the better, e.g. high-paid work in growing non-routine cognitive jobs, or the worse, e.g. low-paid jobs in personal services or, even inferior, unemployment.
In order to better understand the societal implications of the decline in routine work and get beyond pure compositional effects, in this section I examine individual-level employ-ment trajectories. Sticking to the task-based approach provides a parsimonious framework with a straightforward universe of occupational transitions. The focus is on those respondents in the SHP who at the beginning of the observed period hold a routine job. The three distinct task groups thus offer three different trajectories, which I call upgrading (routine → non- rou-tine cognitive), surviving (rourou-tine → rourou-tine), and downgrading (rourou-tine → non-rourou-tine man-ual), respectively. In addition, routine workers might drop out of the labor force (routine → unemployment) or reach pension age (routine → retirement).
For each respondent, I code the occupational status in the first and last observation captured by the SHP. The coding necessarily results in varying time spans between the first and last observation per respondent. By design, the resulting transition matrix is a weighted average of different time spans with a mean duration of slightly below five years. Evaluating different sub-samples of respondents with different time spans demonstrates that within-labor market transitions are relatively stable over time and transition probabilities increase only slightly. The obvious exception is the transition into retirement, which naturally becomes more likely with longer time spans of observation, i.e. increasing age of respondents.6
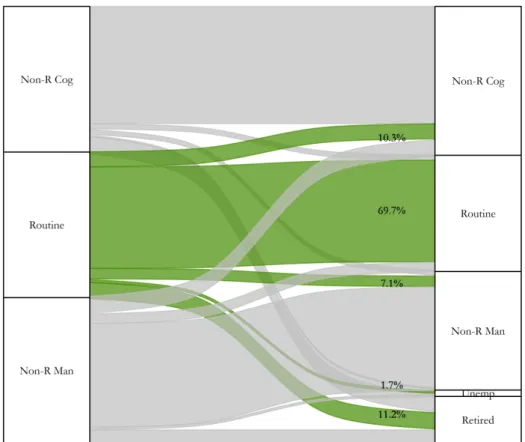
Figure 4 displays the resulting transition pattern in an alluvial plot, where routine workers’ transitions are highlighted in green. The most striking aspect of the figure is the large share of survivors: More than two out of three routine workers cling to their jobs despite the strong aggregate decline of this task group. Regarding transitions between task groups, the plot shows that about every tenth routine worker manages to upgrade into the growing sector of high-skilled non-routine cognitive work. Even though these jobs often require tertiary de-grees, they are apparently not entirely unreachable for routine workers who often lack this educational background. A slightly smaller share of 7.1% is forced out of routine work but able to find non-routine manual employment, which usually is lower paid work in the service sector. In contrast to what aggregate numbers might suggest at first sight, only a very small minority ends up unemployed. Finally, the most frequent transition is the one into retirement.
6 See Kurer/Gallego (2019) for a more detailed discussion of the implications of varying time windows and an empirical analysis based on panel data for the United Kingdom.
Table A2 in the Appendix shows the full transition matrix and allows for a comparison of relative likelihoods of switching between different task groups and exit options.
Figure 4: Individual Transition Pattern – Switzerland
Source: Swiss Household Panel, 1999-2016
The examination of individual occupational transitions adds important nuance to the aggregate pattern discussed before. Despite the gradual decline of routine jobs, most affected workers manage to either stay in their jobs until retirement or are able to find alternative solu-tions within the labor market. The most powerful driver behind the decline in routine work is thus natural turnover over cohorts or generations. A large majority exits routine work in non- traumatic ways, most often via (early) retirement, while young labor market entrants do not seem to replace them in similar numbers (see Cortes 2016; Kurer/Gallego 2019 for similar analyses on the U.S. and the United Kingdom).
Taken together, while those roughly 10% of routine workers who are forced to down-grade or even end up unemployed as a consequence of technological change are certainly a reason for concern, an overwhelming majority does not face an immediate deterioration of socio-economic conditions despite an occupational environment of structural decline. One important reason is certainly that some of the replacement has taken place before the time span under consideration, which creates positive selection effects for the remaining routine workers who are arguably more specialized and less susceptible to automation. Another rea-son explaining this pattern is that work as well as workers themselves change and adapt over
time. Arntz et al. (2016) have made the important argument that the undoubted disappear-ance of routine tasks does not always and necessarily mean that routine jobs disappear but that these jobs’ task content changes in a process of adjusting to automation. This is why Arntz and colleagues, in stark contrast to the sensational study by Frey/Osborne (2017), arrive at less pessimistic estimates of the share of jobs that will disappear as a consequence to techno-logical innovation.
Subjective Perceptions
This last empirical section examines the final link between structural changes of the economy and individual well-being by bringing in subjective perceptions. While the previous sections have established the aggregate pattern of a hollowing of the middle as well as the underlying transition patterns, this section asks to which degree objective risk and the subjective sense of insecurity are aligned. Do routine workers realize that they are in an insecure position with regard to their future in the labor market and to what extent are they concerned about this situation? Technological change transforms the employment structure in a very gradual way, raising the question of how aware routine workers are about their increasingly bleak prospects in labor markets. Subjective perceptions are an important piece to assess how survivors in routine work might react to the threats of automation and, therefore, to better understand the societal consequences of technological change. If labor market stagnation and bleak prospects create discontent and status anxiety, routine workers in the lower middle class might accumu-late behaviorally relevant grievances despite the relative stability in socio-economic condi-tions.
Existing survey data hardly ever involves specific questions on perceived risk of auto-mation and attitudes towards technological change. A single notable exception is a study by Dekker et al. (2017) who examine attitudes towards robots at the workplace. More general questions about individual perceptions of susceptibility to automation are scarce in survey research. In order to fill this lacuna, I cooperated with the research institute gfs.bern and Credit Suisse to add an item battery on technological change to the 2018 “Worry Barometer"7 Firstly, we asked respondents directly about their guess of how likely it is that a job like theirs will be automated by the means of new technology within the next ten years.8 Secondly, we added various questions about respondents attitudes towards new technology. For this paper, I focus on two specific questions, one asking about whether respondents believe that new technologies generally decrease their chances on labor markets and one asking whether re-spondents feel overwhelmed by technological change in general. The answers are recorded on a four-point Likert scale (strongly agree, agree, disagree, strongly disagree).
7 With the Worry Barometer, Credit Suisse aims to contribute to the public debate on issues of socio-political relevance. Between July 10 and August 6, 2018, the research institute gfs.bern asked 2’551 voters across Switzerland about their concerns on behalf of Credit Suisse. For details, see the following link to the executive summary: Worry Barometer 2018.
8 The original wording in German is: “Wie hoch schätzen Sie die Wahrscheinlichkeit (0-100), dass ihre Arbeitsstelle in den nächsten zehn Jahren durch einen Roboter, neue Technologie oder intelligente Software automatisiert wird?"
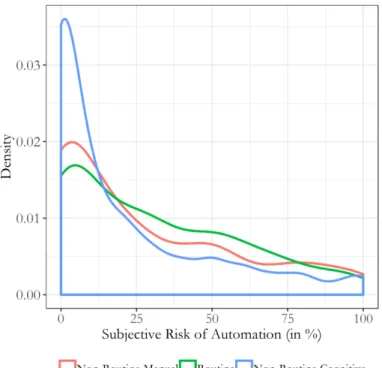
Figure 5: Subjective risk of automation (Distribution) – Switzerland
Source: Worry Barometer 2018. N=1350
Let us first look at subjective perceptions of susceptibility to automation among the three task groups. The following two visualizations provide evidence that routine workers’ objectively high exposure to new technology is indeed reflected in subjective risk perceptions. Figure 5 shows grouped densities of respondents’ probability estimates that their own job will be replaced by machines in the near future. Many respondents are not very concerned, result-ing in modes close to the low end of the probability scale for all three task groups. However, the density distributions clearly differ between groups: the large majority of high-skilled non-routine cognitive workers can be found in estimates of lower than 10% replacement probabil-ity, while the estimates of non-routine manual workers and, especially, routine workers are less concentrated in the low-risk region.
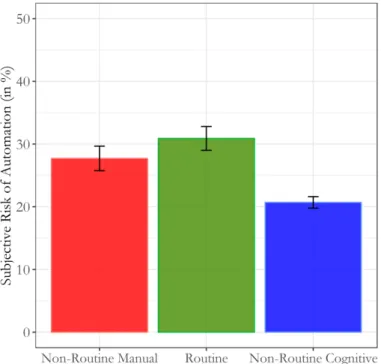
Figure 6 visualizes the same data in a different way by showing mean values of subjec-tively perceived risks of automation by group. On average, respondents estimate the likeli-hood of being replaced by robots or smart software in the near future at 24.5%, a remarkably high value given the relatively narrow time window of ten years. As expected, routine workers do have the highest average estimates but low-skilled non-routine manual workers’ concerns are almost as pronounced. The mean values of these two groups are not statistically distinct based on conventional levels of significance. A likely explanation is that much of the public debate around technological change focuses on substitution processes in the future, e.g. self-driving cars, which will primarily affect low-skilled jobs that have so far been spared from automation. Accordingly, many low-skilled non-routine workers have been heavily primed by the media and may, unfortunately, be correct in their assessment of suffering from a similar risk of automation as routine workers in coming years. In contrast, and in line with theoretical
expectations, workers in non-routine cognitive jobs are considerably less concerned about their risk of being replaced by new technology.
Figure 6: Subjective risk of automation (Average) – Switzerland
Source: Worry Barometer 2018. N=1350. 95% Confidence Intervals.
Similar levels of concern about the risk of automation among low-skilled non-routine workers and mid-skilled routine workers are also reflected in more specific attitudes towards technological change. Figure 7 shows the share of respondents affirming (agree/strongly agree) two negative sentiments towards technological innovation by task group. The left panel shows reactions to a question specifically asking about the impact of technology on respond-ents’ labor market prospects, while the panel on the right plots answers to a more general question asking about whether respondents commonly feel overwhelmed by technological change.
Negative assessments of how technology affects workers’ chances in the labor markets of the future are very widespread. Exactly 50% of the sample voice concerns, whereby the level of agreement decreases with skill level. But even among high-skilled non-routine cognitive workers almost every second respondent thinks that technology decreases his/her prospects at the workplace. A similar pattern on a lower level is observable for the more general question about commonly feeling overwhelmed by developments related to technological innovation. On average, 27.5% agree with the statement but differences between task groups are quite pronounced.
Figure 7: Attitudes towards Technological Change – Switzerland
Source: Worry Barometer 2018. N=840 (left panel) and N=868 (right panel). 95% Confidence Intervals.
Taken together, the evidence on subjective perceptions adds important shades to ob-jective changes on labor markets. While the labor market data clearly shows that routine workers have been hit hardest by technological change, resulting in a strong decline of mid-skilled jobs over time, subjective concerns seem to be influenced at least as much by expecta-tions about the future. In that sense, it is perfectly reasonable that lower skilled, non-routine manual workers show similar or even higher levels of concern than routine workers since much of the public and scientific debate has emphasized the need for specialized skills to thrive in an increasingly automated world of work.
Conclusion
This article has traced the fate of mid-skilled routine workers, who are particularly susceptible to automation, in Switzerland. Analogously to other advanced societies, the empir-ical evidence clearly shows a strong decline in routine jobs over the past 20 years. An analysis of individual-level panel data then decomposes the compositional effect and demonstrates that the aggregate decline does not result in mass unemployment among affected workers. Most routine workers manage to cling to their job but are not replaced once they retire. How-ever, this survival in an environment of structural decline puts considerable strain on routine workers. Data on subjective perceptions from the 2018 Worry Barometer complement the analysis of objective labor market data and shows that a considerable share fears replacement
by a non-human competitor in the next ten years and more than every second routine worker believes that new technologies decrease their labor market prospects.
The results are open to interpretation. On the positive side, the analysis shows that the dramatic decrease in routine work does not go hand in hand with a widespread deterioration of socio-economic conditions. Most routine workers find a non-traumatic exit out of the squeezed middle either via retirement or a transition into different, less exposed occupations. Superficially considered, such a relatively smooth transformation of labor markets in times of automation might not suggest drastic societal repercussions.
However, there are a few reasons for concern. First of all, the analysis of subjective per-ceptions has shown that surviving in routine work is not exactly a comfortable position but comes with considerable levels of strain. Recent research has shown that status anxiety related to occupational change and structural decline is a powerful driver of political discontent (Gidron/Hall 2017; Kurer 2017). Even if the decrease in routine work is a gradual and on the individual level often non-traumatic process, relative changes in social hierarchies and occu-pational prestige might be one driving force behind the recent political disruptions that have been observed in many post-industrial societies.
What is more, the hollowing of the middle, i.e. the disappearance of mid-skilled routine jobs and the ensuing polarization of the labor market, poses thorny inter-generational issues. While routine work has long offered an occupational route that promised secure employment and mid-range incomes to workers without college degrees, this trajectory is increasingly a thing of the past. For routine workers’ children, the only way to match or surpass their par-ents’ social position is a job in non-routine cognitive work, which usually requires higher edu-cation or very good voedu-cational training. If the prospect of social upward mobility for the next generation indeed powerfully mitigates political grievances, as Iversen and Soskice (2019) suggest in their new book on the rise of the knowledge economy, a generous and broadly ac-cessible educational system is key to generate a sense of collective progress and insulate demo-cratic countries against political disruption.
References
Aeppli, Manuel, Vanessa Angst, Rolf Iten, Hansruedi Kaiser, Isabelle Lüthi and Jürg Schweri (2017). Die Entwicklung der Kompetenzanforderungen auf dem Arbeitsmarkt im Zuge der
Digitalisie-rung. SECO Publikation Arbeitsmarktpolitik No 47.
Arntz, Melanie, Terry Gregory and Ulrich Zierahn (2016). The Risk of Automation for Jobs in
OECD Countries. Technical report, OECD Social, Employment and Migration Working Papers Nr.
189.
Autor, David and Anna Salomons (2018). Is Automation Labor-Displacing? Productivity Growth,
Employment, and the Labor Share. Technical Report w24871, National Bureau of Economic Research,
Cambridge, MA.
Autor, David, Frank Levy and Richard J. Murnane (2003). The Skill Content of Recent Technolog-ical Change: An EmpirTechnolog-ical Exploration. The Quarterly Journal of Economics, 1279–1333.
Cortes, G. Matias (2016). Where have the middle-wage workers gone? A study of polarization us-ing panel data. Journal of Labor Economics, 34(1), 63–105.
Dekker, Fabian, Anna Salomons and Jeroen van der Waal (2017). Fear of robots at work: the role of economic self-interest. Socio-Economic Review, 15(3), 539–562.
Fernandez-Macias, Enrique (2012). Job Polarization in Europe? Changes in the Employment Structure and Job Quality, 1995-2007. Work and Occupations, 39(2), 157–182.
Frey, Carl B. and Michael A. Osborne (2013). The future of employment: how susceptible are jobs to
computerisation. Unpublished manuscript.
Frey, Carl B. and Michael A. Osborne (2017). The future of employment: How susceptible are jobs to computerisation? Technological Forecasting and Social Change, 114, 254–280.
Gidron, Noam and Peter A. Hall (2017). The politics of social status: economic and cultural roots of the populist right. The British Journal of Sociology, 68, 57–84.
Goldin, Claudia D. and Lawrence F. Katz (2009). The Race between Education and Technology. Harvard University Press. Google-Books-ID: yGlCFqnakCoC.
Goos, Maarten and Alan Manning (2007). Lousy and Lovely Jobs: The Rising Polarization of Work in Britain. Review of Economics and Statistics, 89(1), 118–133.
Goos, Maarten, Alan Manning and Anna Salomons (2014). Explaining Job Polarization: Routine-Biased Technological Change and Offshoring. The American Economic Review, 104(8), 2509–2526.
Gregory, Terry, Anna Salomons and Ulrich Zierahn (2019). Racing with or Against the Machine?
Evidence from Europe. IZA DP No. 12063.
Iversen, Torben and David Soskice (2019). Democracy and Prosperity Reinventing Capitalism
through a Turbulent Century. Princeton University Press.
Katz, Lawrence and David Autor (1999). Changes in the Wage Structure and Earnings Inequality. In: Ashenfelter, Orley and David Card (eds.), Handbook of Labor Economics, Volume 3A, North Hol-land, 1463–1555.
Kurer, Thomas (2017). The Declining Middle: Political Reactions to Occupational Change. ECPR General Conference Oslo, September.
Kurer, Thomas and Aina Gallego (2019). Distributional consequences of technological change: Worker- level evidence. Research and Politics, 6(1).
Kurer, Thomas and Bruno Palier (2019). Shrinking and shouting: the political revolt of the declin-ing middle in times of employment polarization. Research and Politics, 6(1).
Manning, Alan (2003). Comment on:‘The patterns of job expansions in the USA: a comparison of the 1960s and 1990s’, by Erik Olin Wright and Rachel E. Dwyer. Socio-Economic Review, 1(3), 327– 333.
Nathani, Carsten, Pino Hellmueller, Corina Rieser, Oliver Hoff and Sujehta Nesarajah (2017).
Ur-sachen und Auswirkungen des Strukturwandels im Schweizer Arbeitsmarkt. SECO Publikation
Ar-beitsmarktpolitik No 46.
Oesch, Daniel (2013). Occupational change in Europe: how technology and education transform the
job structure. Oxford: Oxford Univ. Press.
Oesch, Daniel and Emily Murphy (2017). Keine Erosion, sondern Wachstum der Mittelklasse. Der Wandel der Schweizer Berufsstruktur seit 1970. Social Change in Switzerland, 12.
Oesch, Daniel and Jorge Rodriguez-Menes (2011). Upgrading or polarization? Occupational change in Britain, Germany, Spain and Switzerland, 1990–2008. Socio-Economic Review, 9(3), 1–29.
Appendix
Table A1: Occupation per Task Group Task Group ISCO-88
Non-Routine 1000, 1120, 1130, 1141, 1142, 1143, 1200, 1210, 1220, 1221, 1222, 1223, Cognitive 1224, 1225, 1226, 1227, 1228, 1229, 1230, 1231, 1232, 1233, 1235, 1236, 1237, 1239, 1310, 1311, 1312, 1313, 1314, 1315, 1316, 1317, 1318, 1319, 2000, 2110, 2111, 2112, 2113, 2114, 2121, 2122, 2130, 2131, 2139, 2140, 2141, 2142, 2143, 2144, 2145, 2146, 2147, 2148, 2149, 2210, 2211, 2212, 2213, 2221, 2222, 2223, 2224, 2229, 2300, 2310, 2320, 2330, 2340, 2350, 2351, 2352, 2359, 2410, 2411, 2412, 2419, 2420, 2421, 2422, 2429, 2430, 2431, 2432, 2440, 2441, 2442, 2443, 2444, 2445, 2446, 2450, 2451, 2452, 2453, 2454, 2455, 2460, 2470, 3000, 3100, 3110, 3111, 3112, 3113, 3114, 3115, 3116, 3118, 3119, 3121, 3122, 3130, 3131, 3132, 3133, 3140, 3142, 3143, 3144, 3145, 3150, 3151, 3152, 3211, 3212, 3213, 3220, 3222, 3223, 3224, 3226, 3229, 3231, 3232, 3300, 3310, 3320, 3330, 3340, 3400, 3410, 3411, 3412, 3413, 3414, 3415, 3416, 3417, 3419, 3420, 3421, 3422, 3423, 3429, 3432, 3433, 3440, 3441, 3442, 3443, 3449, 3450, 3460, 3470, 3471, 3472, 3474, 3475, 3480 Routine 100, 3430, 3431, 4000, 4100, 4110, 4111, 4112, 4113, 4115, 4120, 4121, 4122, 4130, 4131, 4133, 4141, 4142, 4143, 4144, 4190, 4210, 4211, 4212, 4213, 4215, 4223, 6110, 6111, 6112, 6121, 6129, 6130, 6141, 6152, 6154, 7000, 7110, 7112, 7113, 7124, 7200, 7211, 7212, 7213, 7214, 7215, 7220, 7221, 7222, 7223, 7224, 7230, 7231, 7232, 7233, 7240, 7241, 7242, 7244, 7245, 7311, 7312, 7313, 7321, 7322, 7324, 7330, 7331, 7340, 7341, 7342, 7343, 7344, 7345, 7346, 7410, 7411, 7412, 7413, 7415, 7420, 7421, 7422, 7423, 7424, 7430, 7432, 7433, 7434, 7435, 7436, 7437, 7440, 7441, 7442, 8000, 8100, 8113, 8120, 8122, 8123, 8124, 8139, 8140, 8142, 8143, 8150, 8159, 8160, 8161, 8162, 8163, 8200, 8210, 8211, 8212, 8221, 8222, 8223, 8231, 8232, 8240, 8251, 8253, 8260, 8261, 8262, 8264, 8270, 8273, 8274, 8275, 8278, 8279, 8280, 8281, 8285, 8290, 8340, 9000, 9133, 9150, 9151, 9153, 9160, 9161, 9211, 9300, 9310, 9311 Non-Routine 3221, 3225, 3227, 3228, 4221, 4222, 5000, 5100, 5110, 5111, 5112, 5113, Manual 5120, 5121, 5122, 5123, 5130, 5131, 5132, 5133, 5139, 5140, 5141, 5142, 5143, 5149, 5160, 5161, 5162, 5163, 5169, 5210, 5220, 7120, 7121, 7122, 7123, 7129, 7130, 7131, 7132, 7133, 7134, 7135, 7136, 7137, 7139, 7141, 7143, 8310, 8311, 8312, 8320, 8322, 8323, 8324, 8330, 8332, 8333, 8334, 9100, 9113, 9130, 9132, 9140, 9141, 9142, 9152, 9162, 9312, 9313, 9320, 9330
Table A2: Full Transition Matrix
NRC R NRM Unemp Retire Total
Non-Routine Cognitive N 6137 260 241 82 904 7624 % 0.805 0.034 0.032 0.011 0.119 1 Routine N 494 3343 342 83 536 4798 % 0.103 0.697 0.071 0.017 0.112 1 Non-Routine Manual N 490 289 3047 67 390 4283 % 0.114 0.067 0.711 0.016 0.091 1