SUPPORTING TABLES and FIGURES
1 2
3
Figure S1: Thermal gradient apparatus gradient depicting different temperature zones and fly
4
dispersion (wMelPop). 5
6
7
Figure S2: Schematic of the thermal gradient apparatus used for thermal gradient assays as
8
adapted from Rajpurohit & Schmidt (2016). The polycarbonate tube and length of aluminum 9
gradient within the tube were 58.76cm and temperature was recorded with K-type 10 thermocouples. 11 M <26°C C1 <23°C C2 <21°C C3 <19°C H1 <30°C H2 <34°C <38°CH3 C3 C2 C1 M H1 H2 H3 Aluminum adapter Aluminum Rod (l=74.93cm, d=3.02cm) Polycarbonate tube (l=58.76cm, id=6.35cm) Heat sink Peltier device Thermocouple Water bath
Fly entry point
12
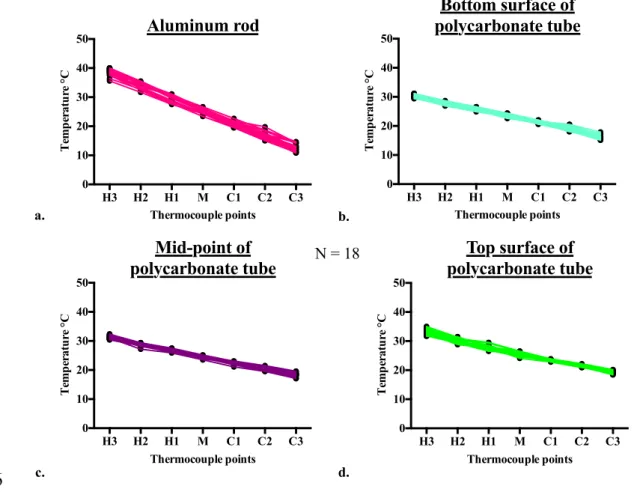
Figure S3: Average + 0.5°C (SD) temperatures from 18 runs that were recorded at each surface
13
measured using k-type thermocouples. There was a linear increase in temperature from cold to 14
hot as measured at each of seven evenly spaced (8.39cm). 15
16
Figure S4: Plots showing linearity of temperature change for the different surfaces (a.
17
aluminum rod, b. top, c. bottom, and mid-point of the polycarbonate tube) as measured with K-18
Aluminum Rod Temps °C
C3 C2 C1 M H1 H2 H3
14 18 22 26 30 34 38
Polycarbonate Tube Temp °C
C3 C2 C1 M H1 H2 H3 17 19 21 23 25 27 29 19 21 23 25 27 29 31 18 20 22 24 26 28 30 Top Mid-point Bottom H3 H2 H1 M C1 C2 C3 0 10 20 30 40 50 Thermocouple points T em p er at u re °C Aluminum rod H3 H2 H1 M C1 C2 C3 0 10 20 30 40 50 Thermocouple points T em p er at u re °C Mid-point of polycarbonate tube a. d. c. b. N = 18 H3 H2 H1 M C1 C2 C3 0 10 20 30 40 50 Thermocouple points T em p er at u re °C Bottom surface of polycarbonate tube H3 H2 H1 M C1 C2 C3 0 10 20 30 40 50 Thermocouple points T em p er at u re °C Top surface of polycarbonate tube
type thermocouples at regular intervals along the length of apparatus from the hottest end (H3) 19 to the coldest (C3). 20 21 22 23
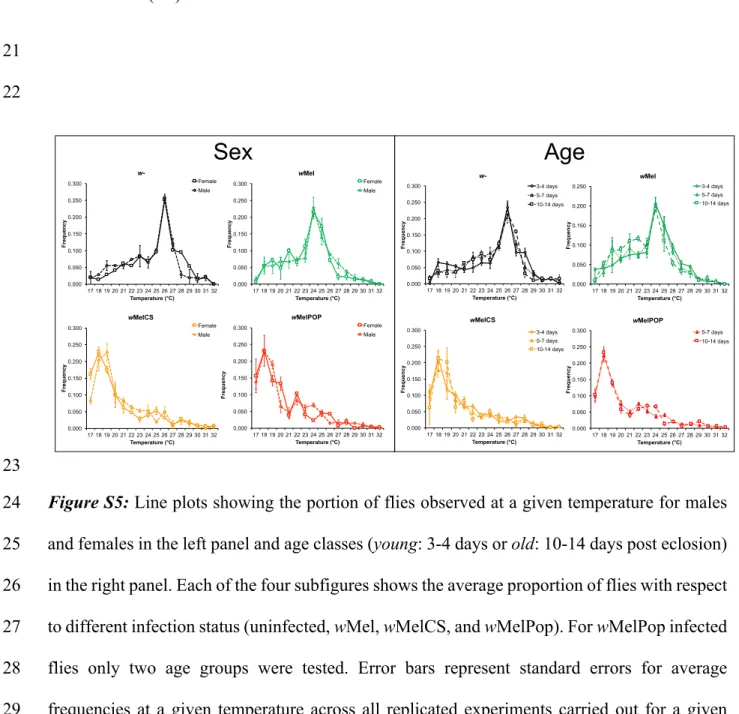
Figure S5: Line plots showing the portion of flies observed at a given temperature for males
24
and females in the left panel and age classes (young: 3-4 days or old: 10-14 days post eclosion) 25
in the right panel. Each of the four subfigures shows the average proportion of flies with respect 26
to different infection status (uninfected, wMel, wMelCS, and wMelPop). For wMelPop infected 27
flies only two age groups were tested. Error bars represent standard errors for average 28
frequencies at a given temperature across all replicated experiments carried out for a given 29
infection type and levels of the factors sex or age. 30 0.000 0.050 0.100 0.150 0.200 0.250 0.300 17 18 19 20 21 22 23 24 25 26 27 28 29 30 31 32 Frequency Temperature (°C) w-Female Male 0.000 0.050 0.100 0.150 0.200 0.250 0.300 17 18 19 20 21 22 23 24 25 26 27 28 29 30 31 32 Frequency Temperature (°C) wMel Female Male 0.000 0.050 0.100 0.150 0.200 0.250 0.300 17 18 19 20 21 22 23 24 25 26 27 28 29 30 31 32 Frequency Temperature (°C) wMelCS Female Male 0.000 0.050 0.100 0.150 0.200 0.250 0.300 17 18 19 20 21 22 23 24 25 26 27 28 29 30 31 32 Temperature (°C) wMelPOP Female Male Frequency 0.000 0.050 0.100 0.150 0.200 0.250 0.300 17 18 19 20 21 22 23 24 25 26 27 28 29 30 31 32 Frequency Temperature (°C) w-0.000 0.050 0.100 0.150 0.200 0.250 17 18 19 20 21 22 23 24 25 26 27 28 29 30 31 32 Frequency Temperature (°C) wMel 0.000 0.050 0.100 0.150 0.200 0.250 0.300 17 18 19 20 21 22 23 24 25 26 27 28 29 30 31 32 Frequency Temperature (°C) wMelCS 0.000 0.050 0.100 0.150 0.200 0.250 0.300 17 18 19 20 21 22 23 24 25 26 27 28 29 30 31 32 Frequency Temperature (°C) wMelPOP
Sex
Age
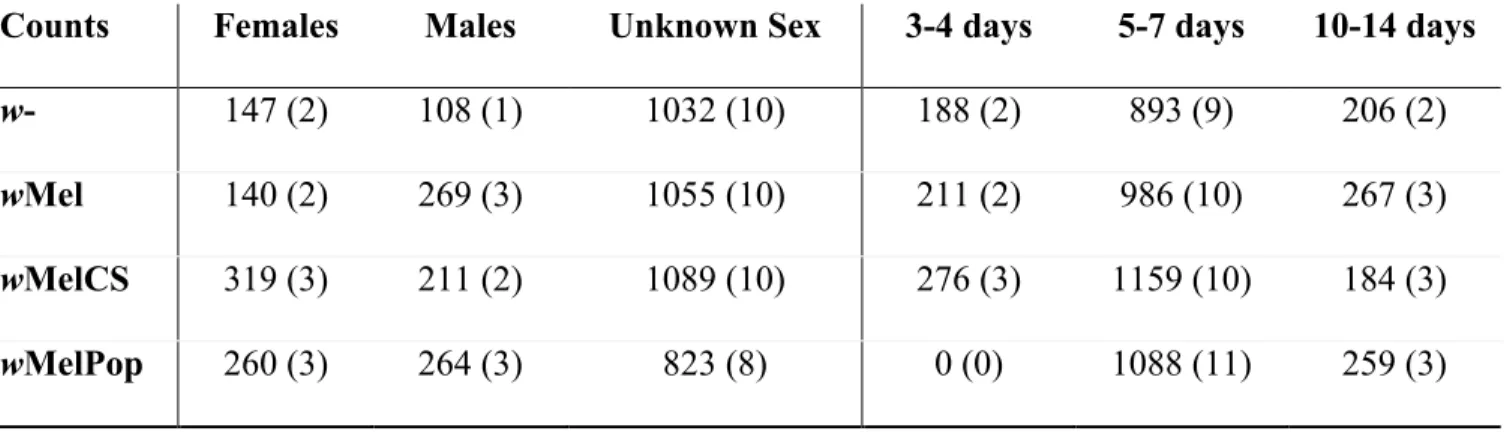
3-4 days 5-7 days 10-14 days 3-4 days 5-7 days 10-14 days 3-4 days 5-7 days 10-14 days 5-7 days 10-14 daysTable S1: Counts of flies and number of replicates (in parentheses) per sex and age class
31
Counts Females Males Unknown Sex 3-4 days 5-7 days 10-14 days
w- 147 (2) 108 (1) 1032 (10) 188 (2) 893 (9) 206 (2) wMel 140 (2) 269 (3) 1055 (10) 211 (2) 986 (10) 267 (3) wMelCS 319 (3) 211 (2) 1089 (10) 276 (3) 1159 (10) 184 (3) wMelPop 260 (3) 264 (3) 823 (8) 0 (0) 1088 (11) 259 (3) 32 33
Table S2: Results of two-way GLMM with independent factors age, Wolbachia and the interaction between them (see Table 2 for more detail).
34
Model Factor n Df !2 P-value
wol + age + wol x age wol 5042 6 149.64 9.19E-30
wol + age + wol x age age 5042 4 0.39 0.98
wol + age + wol x age wol x age 5042 3 0.17 0.98 35