HAL Id: hal-02618817
https://hal.inrae.fr/hal-02618817
Submitted on 10 Nov 2020
HAL is a multi-disciplinary open access archive for the deposit and dissemination of sci-entific research documents, whether they are pub-lished or not. The documents may come from teaching and research institutions in France or abroad, or from public or private research centers.
L’archive ouverte pluridisciplinaire HAL, est destinée au dépôt et à la diffusion de documents scientifiques de niveau recherche, publiés ou non, émanant des établissements d’enseignement et de recherche français ou étrangers, des laboratoires publics ou privés.
Alicia Valdés, Jonathan Lenoir, Pieter de Frenne, Emilie Andrieu, Jorg
Brunet, Olivier Chabrerie, Sara A. O. Cousins, Marc Deconchat, Pallieter de
Smedt, Martin Diekmann, et al.
To cite this version:
Alicia Valdés, Jonathan Lenoir, Pieter de Frenne, Emilie Andrieu, Jorg Brunet, et al.. High ecosystem service delivery potential of small woodlands in agricultural landscapes. Journal of Applied Ecology, Wiley, 2020, 57 (1), pp.4-16. �10.1111/1365-2664.13537�. �hal-02618817�
1 TITLE: “Small but strong: High ecosystem service delivery potential of small woodlands in 2 agricultural landscapes”
3 AUTHOR LIST: Alicia Valdés1*†, Jonathan Lenoir1*, Pieter De Frenne2*, Emilie Andrieu3, 4 Jörg Brunet4, Olivier Chabrerie1, Sara A. O. Cousins5, Marc Deconchat3, Pallieter De Smedt2, 5 Martin Diekmann6, Steffen Ehrmann7, Emilie Gallet-Moron1, Stefanie Gärtner7, Brice
6 Giffard3, Karin Hansen8, Martin Hermy9, Annette Kolb6, Vincent Le Roux1, Jaan Liira10, 7 Jessica Lindgren5, Ludmilla Martin1, Tobias Naaf11, Taavi Paal10, Willem Proesmans2, 8 Michael Scherer-Lorenzen7, Monika Wulf11, Kris Verheyen2**, Guillaume Decocq1**.
9 *These authors contributed equally to the work 10 **Shared last authorship
11 †Corresponding author, e-mail: aliciavaldes1501@gmail.com, present affiliations: Department 12 of Ecology, Environment and Plant Sciences, Stockholm University, Svante Arrhenius väg 20 13 A, SE-106 91 Stockholm, Sweden & Bolin Centre for Climate Research, Stockholm
14 University, Stockholm, Sweden 15 Author affiliations:
16 1“Ecologie et Dynamique des Systèmes Anthropisés” (EDYSAN, UMR CNRS 7058), Jules 17 Verne University of Picardie, 1 rue des Louvels, F-80037 Amiens Cedex 1, France, 2Forest & 18 Nature Lab, Ghent University, Geraardsbergsesteenweg 267, B-9090 Melle-Gontrode,
19 Belgium, 3UMR 1201 DYNAFOR, INRA, Chemin de Borde Rouge, CS 52627 F-31326 20 Castanet, France, 4Southern Swedish Forest Research Centre, Swedish University of
21 Agricultural Sciences, Box 49, SE-230 53 Alnarp, Sweden, 5Landscape Ecology, Department 22 of Geography and Quaternary Geology, Stockholm University, SE-106 91 Stockholm,
23 Sweden, 6Vegetation Ecology and Conservation Biology, Institute of Ecology, FB2,
25 Faculty of Biology, University of Freiburg, Schaenzlestrasse 1, 79104 Freiburg, Germany, 26 8IVL Swedish Environmental Research Institute, Box 210 60, S-100 31 Stockholm, Sweden, 27 9Division Forest, Nature and Landscape Research, University of Leuven (KU Leuven), 28 Celestijnenlaan 200E, B-3000 Leuven, Belgium, 10Institute of Ecology and Earth Sciences, 29 University of Tartu, Lai 40, EE-51005 Tartu, Estonia, 11Leibniz-ZALF (e.V.), Institute of
31 ABSTRACT
32 Global forest loss and fragmentation have strongly increased the frequency of forest 33 patches smaller than a few hectares. Little is known about the biodiversity and 34 ecosystem service supply potential of such small woodlands in comparison to larger
35 forests. As it is widely recognized that high biodiversity levels increase ecosystem 36 functionality and the delivery of multiple ecosystem services, small, isolated
37 woodlands are expected to have a lower potential for ecosystem service delivery than
38 large forests hosting more species.
39 We collected data on the diversity of six taxonomic groups covering invertebrates, 40 plants and fungi, and on the supply potential of five ecosystem services and one 41 disservice within 224 woodlands distributed across temperate Europe. We related their
42 ability to simultaneously provide multiple ecosystem services (multiservice delivery 43 potential) at different performance levels to biodiversity of all studied taxonomic 44 groups (multidiversity), forest patch size and age, as well as habitat availability and
45 connectivity within the landscape, while accounting for macroclimate, soil properties 46 and forest structure.
47 Unexpectedly, despite their lower multidiversity, smaller woodlands had the potential 48 to deliver multiple services at higher performance levels per area than larger
49 woodlands of similar age, probably due to positive edge effects on the supply potential 50 of several ecosystem services.
51 Biodiversity only affected multiservice delivery potential at a low performance level 52 as well as some individual ecosystem services. The importance of other drivers of
54 depended on the level of performance and varied with the individual ecosystem
55 service considered.
56 Synthesis and applications: Though large, ancient woodlands host the highest 57 biodiversity and hence, can deliver a number of ecosystem services, smaller
58 woodlands in agricultural landscapes, especially ancient woodlands, have a higher 59 potential to deliver multiple ecosystem services on a per area basis. Despite their 60 important contribution to agricultural landscape multifunctionality, these small
61 woodlands are currently not considered by public policies. There is thus an urgent 62 need for targeted policy instruments ensuring their adequate management and future
63 conservation in order to either achieve multiservice delivery at high levels or to 64 maximize the delivery of specific ecosystem services.
65 KEYWORDS: Anthropocene, biodiversity, connectivity, habitat fragmentation, island
66 biogeography, management practices, metacommunity dynamics, multifunctionality, 67 woodlands
68 INTRODUCTION
69 Forests deliver a wide range of ecosystem services to human society, and positive
70 relationships between biodiversity and these services have been reported for large forested 71 areas (Gamfeldt et al., 2013; van der Plas et al., 2016). However, there is a lack of knowledge 72 about the relationship between biodiversity and multiple ecosystem services in small
73 woodland patches (Decocq et al., 2016; Mitchell, Bennett, & Gonzalez, 2014). Indeed, in 74 many parts of the world, the original forest cover has been heavily fragmented (Haddad et al., 75 2015; Hansen et al., 2013) due to human activities; more than 70% of the remaining global
76 forest cover lies within 1 km of a forest edge (Haddad et al., 2015). Many of the remaining 77 woodlands are smaller than 10 ha (Estreguil, Caudullo, de Rigo, & San Miguel, 2013) and
78 scattered in a human-transformed matrix of mostly arable lands, pastures and human 79 settlements. Loss of area, increased isolation and greater exposure to human disturbances 80 along forest edges are leading causes of biodiversity loss (Haddad et al., 2015), although
81 small patch size can sometimes be beneficial for biodiversity, as shown by the preponderance 82 of positive significant responses to habitat fragmentation (Fahrig, 2017).
83 Small woodland patches in agricultural landscapes also vary in age, since many of 84 them have developed on farmland that was abandoned at different points in time (Flinn & 85 Vellend, 2005). Consequently, small woodlands not only differ in size and degree of isolation,
86 but also in age, quantified as the time since forest establishment, ranging from very ancient 87 (several centuries or older) to more recent (less than a century). Despite their small size and
88 isolation, patches of (semi-)natural habitats such as small and ancient woodlands can have an 89 important role as refugia for biodiversity (Decocq et al., 2016) and as providers of multiple 90 ecosystem services (Decocq et al., 2016; Mitchell et al., 2014). Therefore, small and ancient
91 forest patches, analogously to other “small natural features” (Hunter, 2017) such as scattered 92 and old trees in agricultural landscapes (Herrera & García, 2009; Manning, Gibbons, &
93 Lindenmayer, 2006; Manning, Fischer, & Lindenmayer, 2009), have an important
94 conservation value. This suggests that the age of these elements in the landscape might also 95 contribute to their conservation value. As it is unknown if the relationships among
96 biodiversity and ecosystem services that emerged from research in large forests (Gamfeldt et 97 al., 2013; van der Plas et al., 2016) apply to small and ancient woodlands, the conservation
98 and management of such elements in agricultural landscapes would strongly benefit from a 99 specific assessment of the drivers of biodiversity and ecosystem service delivery in small 100 woodlands.
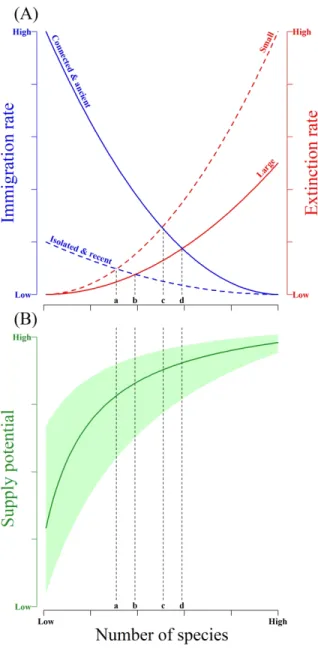
101 The delivery potential of multiple ecosystem services by small and ancient woodlands 102 can be studied by linking the theory of island biogeography (MacArthur & Wilson, 1967) to
103 ecosystem functioning (Fig. 1). Large and spatially well-connected forest patches are 104 expected to host more species compared to small and isolated woodlands (MacArthur & 105 Wilson, 1967). Likewise, patches that have been forested for a long time will likely be more
106 species-rich than recently established forests, which can remain floristically impoverished for 107 centuries (De Frenne et al., 2011) because of the slow immigration rate of forest specialists
108 (Naaf & Kolk, 2015). Together with this variation in taxonomic diversity (Valdés et al., 109 2015), the functional diversity of patches is expected to vary as well since traits of species 110 colonizing and persisting in, for instance, small, young or isolated patches will differ from
111 those inhabiting large, ancient or well-connected patches (Craven, Filotas, Angers, & Messier, 112 2016; Vanneste et al., 2019). These functional responses to patch characteristics can in turn
113 affect their functioning and potential for ecosystem service delivery (cf. Suding et al. 2008). 114 Indeed,the effect of taxonomic or functional diversity on ecosystem functioning and service 115 delivery is widely acknowledged and very well documented in the scientific literature
116 (Balvanera et al., 2006; Balvanera et al., 2013; Bastian 2013; Gamfeldt et al., 2013; Lefcheck 117 et al., 2015; van der Plas et al., 2016; Duffy, Godwin, & Cardinale, 2017). In a rigorous
118 quantitative review covering 446 measures of biodiversity effects on ecosystem functioning 119 and services, Balvanera et al. (2006) found clear evidence that biodiversity has positive 120 effects on most of the ecosystem services assessed in their quantitative review. Similarly, a 121 more recent quantitative review focusing on 67 field studies has demonstrated that biomass 122 production, a key ecosystem service, increases with species richness in a wide range of wild
123 taxa and ecosystems (Duffy, Godwin, & Cardinale, 2017). This positive relationship between 124 biodiversity and the delivery of single ecosystem services has even been extended to the 125 delivery of multiple services (Gamfeldt et al., 2013; van der Plas et al., 2016; Lefcheck et al.,
126 2015). For instance, higher levels of multiple ecosystem services are found in large forests 127 with more tree species (Gamfeldt et al., 2013). If the positive relationship between
128 biodiversity and the delivery of multiple ecosystem services reported for large forested areas 129 (Gamfeldt et al., 2013; van der Plas et al., 2016) would be fully applicable to small
130 woodlands, we could hypothesize that small, isolated and recent woodlands (cf. situation “a”
131 in Fig. 1) would have a lower ecosystem service supply potential (Bodin, Tengö, Norman, 132 Lundberg, & Elmqvist, 2006; Decocq et al., 2016), because they harbor less biodiversity
133 compared to large, connected and ancient forest patches (cf. situation “d” in Fig. 1).
134 Here, we assess the supply potential of multiple ecosystem services provided by small 135 (both recent and ancient) woodlands as well as larger (both recent and ancient) forest patches
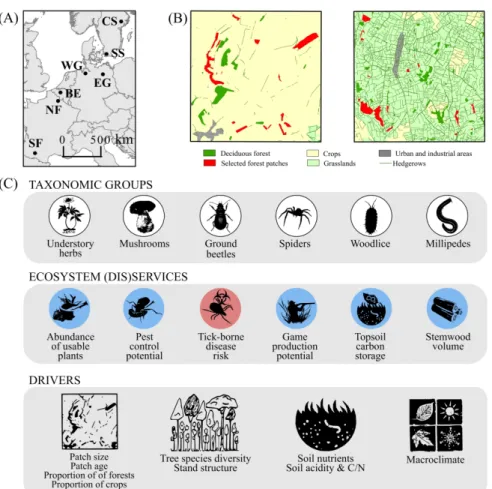
136 (n = 224) in agricultural landscapes distributed along a 2500-km latitudinal gradient spanning 137 the entire temperate forest biome in Europe (Fig. 2). We collected biodiversity data for six
138 taxonomic groups with different functional roles and dispersal potential, as well as data on the 139 supply potential of six important ecosystem (dis)services delivered by woodlands,
140 representing a mixture of provisioning, regulating and cultural services.
141 MATERIALS AND METHODS
143 We studied deciduous forest patches in seven regions along a transect spanning c. 2500 km 144 across the entire temperate forest biome of Europe (Fig. 2). In each region, two 5 × 5 km² 145 landscape windows (14 in total) with two contrasting connectivity levels were selected: (1) a 146 “high-disturbance landscape” with isolated forest patches surrounded by an intensively 147 cultivated matrix, dominated by large open fields with intensive use of pesticides and
148 fertilizers; and (2) a “low-disturbance landscape” with forest patches more or less connected 149 by different types of hedgerows and surrounded by a less disturbed matrix with fewer and 150 smaller crop fields (see Valdés et al. (2015) for more info). In each landscape window, sixteen
151 woodlands were selected for sampling. When possible, these woodlands were chosen to be 152 equally distributed among each of four combinations of size and historical age categories:
153 small-old, small-young, large-old, large-young (see details on patch selection in Appendix S1, 154 and summary statistics for each size and age category per landscape window in Table S1). 155 Data collection
156 Patch features
157 Patch size and historical age were calculated with a geographic information system (GIS,
158 ArcGis 9.3, ESRI), using contemporary and historical maps of the landscape windows (recent 159 aerial photographs, all taken after the year 2000, and maps from the 18th, 19th and 20th 160 centuries). Patch size was calculated using digitized woodlands in each window. For
161 calculating patch historical age, we digitized all woodlands in historical maps, and historical 162 age was estimated using the date of the oldest map on which a patch appeared. As a given
163 patch may contain a mosaic of fragments with different historical ages, we calculated a size-164 weighted average of the historical age of all fragments composing an isolated patch.
165 We used a 500-m buffer centered on each patch to calculate metrics related to habitat
167 (Fahrig, 2013): (1) the proportion of buffer surface covered by forest, with higher values 168 indicating a higher amount of forest habitat availability within the landscape; and (2) the 169 proportion of buffer surface covered by crops, with higher values indicating a lower habitat 170 connectivity, as agricultural intensification of the matrix reduces forest connectivity and 171 increases its ecological isolation (Donald & Evans, 2006).
172 Environmental drivers
173 We calculated values of three groups of environmental drivers that can affect both 174 biodiversity and supply potential of multiple ecosystem services: macroclimatic, soil and
175 forest structural drivers. 176 Macroclimatic drivers
177 We extracted five temperature variables from the EuroLST dataset (250-m resolution, 178 http://www.geodati.fmach.it/eurolst.html) and five precipitation variables from the
179 WorldClim global database (1-km resolution, http://www.worldclim.org/) and averaged each
180 variable for each patch using all pixels intersecting with the patch area. We performed a 181 principal components analysis (PCA, Fig. S1) on these 10 variables representing seasonality
182 and extreme or limiting environmental factors (see details on Fig. S1 legend), and retained the 183 first axis (explaining 74% of the total variance) as an explanatory variable in our models. This 184 variable, called “macroclimate”, indicated high seasonality and low temperature and
185 precipitation. 186 Soil drivers
187 We took soil samples in each patch (see details on soil sampling in Appendix S1), and 188 calculated mean values of depth of the forest floor, C:N ratio, total P content and pH of the 189 mineral topsoil at the patch level and used them to perform a PCA (Fig. S2). We then retained
191 variables in our models. Axis 1, called “soil nutrients”, was positively correlated with the total 192 P in the mineral topsoil and negatively correlated with the depth of the forest floor. Axis 2, 193 called “soil acidity & C/N” was positively correlated with the C:N ratio in the mineral topsoil 194 and negatively correlated with the pH of the mineral topsoil.
195 Forest structural drivers
196 We calculated two variables describing variation in forest composition and structure,
197 respectively: tree diversity, calculated as a stem number-based Shannon diversity index; and 198 structural diversity, calculated as the coefficient of variation (CV) of tree diameters (see
199 details on data collection in Appendix S1). These variables were selected based on data 200 availability on the one hand and their relevance for explaining variation in tree and
forest-201 associated biodiversity and in ecosystem functioning (e.g. van der Plas et al., 2016 and 202 Penone et al., 2019) on the other hand.
203 Biodiversity
204 In order to assess patch biodiversity (hereafter multidiversity sensu Allan et al. 2014), we 205 surveyed species richness for six different taxonomic groups that are representative of
forest-206 associated ground-dwelling biota: ground beetles (i.e. Insecta); spiders (i.e. Arachnida); 207 millipedes (i.e. Myriapoda); woodlice (i.e. Crustacea); understory herbs (i.e. focusing on 208 vascular plant species only); and mushrooms (i.e. focusing on species with visible and
above-209 ground fruiting bodies such as stem, cap and gills). The selected groups cover different 210 trophic levels (primary producers, predators and decomposers) and are assumed to directly or
211 indirectly influence the potential delivery of the six studied ecosystem services. We refer to 212 Appendix S1 for more information on field surveys specific to each taxonomic group. 213 Proxies for supply potential of multiple ecosystem services
214 In addition to patch multidiversity, we assessed the potential of a given patch to
215 simultaneously provide multiple services (hereafter multiservice delivery potential). Here we 216 included two proxies for provisioning services (abundance of usable plants and stemwood 217 volume), three for regulating services (pest control potential, tick-borne disease risk and 218 topsoil carbon storage), and one for a cultural or recreational service (game production
219 potential). See Appendix S1 for more information on each service/disservice and details on 220 data collection.
221 Calculation of multidiversity and multiservice delivery
222 For each patch i, we calculated a multidiversity index (MD) according to Allan et al. (2014) 223 using the raw species richness values of understory herbs (UH), mushrooms (MU), carabid
224 beetles (CB), spiders (SP), millipedes (MI) and woodlice (WO). Each raw species richness 225 value for a given taxonomic group was divided by the mean of the five highest values among 226 all studied patches to account for extreme values (Allan et al., 2014). MD was calculated as:
227 (Equation 1)
228 Based on the raw values of each individual ecosystem service/disservice, we used a 229 multiple threshold approach (Byrnes et al., 2014) to define service-specific threshold values
230 representing low, intermediate and high performance levels of ecosystem service supply 231 potential (see details in Table S2). The performance level is the amount of the provided
232 service (or disservice) supply potential per area unit and could either be low, intermediate or 233 high. Examples of high performance levels are, for instance, small woodland patches that 234 simultaneously provide a large total stemwood volume (> 300 m3 per ha) and have a low
235 density of ticks (< 50 nymphs per 100 m2) and thus minimize the prevalence of tick-borne 236 diseases in the human population. For each of the three performance levels, we calculated
237 multiservice delivery potential as the proportion of ecosystem service proxies (sometimes less 238 than six measured ecosystem proxies per patch if the data was not available for a given proxy 239 within a focal patch) for which the amount of the provided service (or disservice) proxy per 240 area unit exceeded (or was lower than) a proxy-dependent threshold (Table S2). For instance, 241 if one service proxy exceeded its high-threshold value and two exceeded their respective
low-242 threshold values within a given patch for which five services were measured in total, then the 243 high-performance multiservice delivery potential is 0.2 and the low-performance multiservice 244 delivery is 0.4 for this patch. This threshold approach is considered as the state-of-the-art
245 standard method to evaluate multiservice delivery (Byrnes et al., 2014; Gamfeldt, Hillebrand, 246 & Jonsson, 2008; Lefcheck et al., 2015). Multiple thresholds are used because it has been
247 shown that the sign of the relationship between biodiversity and ecosystem multifunctionality 248 can differ when low-performance versus high-performance thresholds are applied (van der 249 Plas et al., 2016).
250 Statistical modeling
251 We used piecewise structural equation modeling (piecewise SEM, Lefcheck, 2016) to study
252 the response of low-, intermediate- and high-performance multiservice delivery potential to 253 multidiversity, patch characteristics (size, age and the interaction between size and age) as 254 well as habitat availability and connectivity within the landscape, while accounting also for
255 macroclimate, soil and forest structural characteristics. We chose a piecewise approach
256 (instead of the traditional variance-covariance based SEM) because of its ability to fit multiple
257 separate linear models with non-normal distributions and random effects, which was well-258 suited for our data. In our models, we considered both direct responses of multiservice
259 delivery potential to the different predictors, and indirect responses mediated by effects of the
260 different predictors on multidiversity. The piecewise SEM consisted of four component 261 models:
262 1. A linear mixed-effects model (LMM) with tree diversity as the response variable and 263 patch size (log-transformed), historical age, habitat availability (proportion of
264 forests) and connectivity (proportion of crops), macroclimate (PC1) and soil (PC1 265 and PC2) as predictor variables.
266 2. A LMM with structural diversity as the response variable and patch size
(log-267 transformed), historical age, habitat availability (proportion of forests) and 268 connectivity (proportion of crops) and tree diversity as predictor variables. 269 3. A LMM with multidiversity as the response variable and patch size
(log-270 transformed), historical age (and their interaction term to account for the species-271 time-area relationship; Adler et al. 2005), habitat availability (proportion of forests)
272 and connectivity (proportion of crops), macroclimate (PC1), soil (PC1 and PC2), tree 273 diversity and structural diversity as predictor variables.
274 4. A generalized linear mixed-effects model (GLMM) with a binomial error distribution
275 with multiservice delivery potential as the response variable and multidiversity, patch 276 size (log-transformed), historical age, habitat availability (proportion of forests) and
277 connectivity (proportion of crops), macroclimate (PC1), soil (PC1 and PC2), tree 278 diversity and structural diversity as predictor variables.
279 LMMs were used for response variables with approximately normal distributions (tree
280 diversity, structural diversity and multidiversity), and a binomial GLMM was used for 281 multiservice delivery potential (proportional). We used “region” and “window type” nested
282 within “region” as random effect terms in all four component models to account for the 283 hierarchical, nested structure of the sampling design along the studied gradient. This
284 piecewise SEM model structure was tested for the three levels of performance of multiservice
286 service, separately. Overall fit of the piecewise SEM models was assessed using Shipley's test 287 of direct separation (Shipley, 2009), which evaluates the probability that none of the paths 288 missing from the hypothesized causal network contain useful information, and yields the 289 Fisher's C statistic. A χ2-value of Fisher's C below the significance level (p < 0.05) indicates 290 that the model is inconsistent with the data, and should be rejected. Statistical analyses were
291 carried out in R 3.4.2 (R Core Team, 2018) using the packages piecewiseSEM (Lefcheck, 292 2016) and nlme (Pinheiro, Bates, DebRoy, & Sarkar, 2016).
293 RESULTS
294 Tree species diversity increased with patch historical age, while structural diversity, in turn, 295 increased with tree species diversity (Fig. 3). Multidiversity was higher in the larger and more
296 ancient patches, as shown by the positive interaction effect (p = 0.03) between patch size and 297 historical age (Fig. 3).
298 The response of multiservice delivery potential to multidiversity, patch characteristics,
299 habitat availability and connectivity and environmental drivers depended on the level of 300 performance considered. Multiservice delivery potential at a low performance level increased
301 with multidiversity and was also indirectly positively affected by the interaction between 302 patch size and historical age as larger and more ancient patches hosted higher levels of 303 multidiversity (Fig. S3). Multiservice delivery potential at an intermediate performance level
304 was not affected by any of the studied drivers (Fig. S3). Multiservice delivery potential at a 305 high performance level increased directly with patch historical age and decreased directly
306 with patch size, i.e. it was maximal in the smallest and most ancient woodlands (Fig. 3). It 307 also decreased with soil acidity & C/N, i.e. it was maximal in less acidic soils with lower C:N 308 ratio (Fig. 3).
309 Each individual ecosystem service/disservice showed a particular response to the array 310 of drivers studied (Fig. 4). Patch size affected three ecosystem service proxies and patch age 311 only one. Smaller woodlands exhibited a higher game production potential and topsoil carbon 312 storage capacity, but lower tick-borne disease risk than larger patches. More ancient
313 woodlands showed a higher topsoil carbon storage. Multidiversity, mediated by the positive
314 interaction effect of patch size × patch age, had a significant positive impact on three out of 315 the six individual ecosystem services studied: abundance of usable plants, pest control
316 potential and game production potential, while tick-borne disease risk, topsoil carbon storage,
317 and stemwood volume were unaffected by multidiversity. The landscape variables only had a 318 limited effect on the ecosystem service delivery potential, with only the abundance of usable
319 plants positively related to habitat connectivity. The abundance of usable plants was also the 320 only service proxy affected by macroclimate; enhanced seasonality had a positive effect. Soil 321 drivers affected several individual ecosystem services. Soil nutrient availability increased the
322 abundance of usable plants and decreased tick-borne disease risk, game production potential 323 and topsoil carbon storage. Tick-borne disease risk and game production potential increased
324 in more acidic soils with higher C:N ratio, while the abundance of usable plants and
325 stemwood volume decreased. Forest structure affected two proxies: game production potential 326 increased with tree species diversity and decreased with structural diversity, and stemwood
327 volume, which decreased with tree species diversity and increased with structural diversity. 328 All piecewise SEM models reported here were consistent with the data (p > 0.05 in all cases).
329 DISCUSSION
330 We showed that multidiversity was highest in large and ancient forest patches. Multiservice 331 delivery potential at high performance levels per area was maximal in the smallest and most
333 delivery potential at low performance levels, as well as some of the individual ecosystem 334 services.
335 The interplay between patch biodiversity, age and size and their effects on multiservice 336 delivery potential
337 Our results show that, although larger and more ancient woodlands hosted a higher
338 biodiversity, as predicted by the species-time-area relationship (Adler et al., 2005), this was 339 unrelated to a high-performance multiservice delivery potential. Contrary to our expectations, 340 high-performance multiservice delivery potential decreased as patch size increased,
341 independent of the positive effect of patch size on multidiversity. This means that smaller 342 woodlands potentially deliver multiple services at higher performance levels on a per area
343 basis than larger woodlands of a similar age, even if the larger woodlands harbor a higher 344 biodiversity. This unexpected result may be explained by the positive edge effect on the 345 delivery potential of some ecosystem services (Bodin et al., 2006; Mitchell et al., 2014). As
346 smaller woodlands have a relatively high edge-to-core ratio (Ewers & Banks-Leite, 2013; 347 Weathers, Cadenasso, & Pickett, 2001), they are highly exposed to external influences; they
348 receive, for example, proportionally more light penetrating through the edge, a warmer and 349 drier microclimate and more nutrient input from surrounding agricultural lands compared to 350 large forests. These conditions promote, among others, higher patch-level microclimate
351 heterogeneity (Frey et al., 2016) as well as a more dense vegetation cover and an increased 352 biomass production at forest edges (Remy, Wuyts, Van Nevel, et al., 2018; Remy, Wuyts,
353 Verheyen, Gundersen, & Boeckx, 2018) in small woodlands. This altered functioning in turn 354 increases the delivery potential of some services, such as game production potential, due to an 355 increased quantity of food available for game, and topsoil carbon storage, due to the faster
357 due to decreased larval densities in the unfavorable (e.g. hotter and drier) microclimatic 358 conditions at the edge (Ehrmann et al., 2017).
359 On the other hand, the positive and indirect interaction effect of patch size and age, 360 mediated by a higher multidiversity, increased multiservice delivery potential at a
low-361 performance level, as well as some individual ecosystem services. Therefore, it seems that the
362 higher biodiversity hosted by larger and more ancient woodlands is able to maintain a 363 minimal level of multiservice supply potential, while the maintenance of higher levels is less 364 dependent on the amount of biodiversity. The supply potential of several individual ecosystem
365 services indirectly increased in larger and more ancient woodlands because it was dependent 366 on higher levels of biodiversity. For example, abundance of usable plants and game
367 production potential might have increased due to a positive correlation with vascular plant 368 diversity, while pest control potential probably increased due to bottom-up effects through the 369 trophic chain (Scherber et al., 2010). On the contrary, tick-borne disease risk, topsoil carbon
370 storage and stemwood volume were unrelated to multidiversity, probably because they 371 depended on particular environmental conditions or on the presence and abundance of
372 specific species (Winfree, Fox, Williams, Reilly, & Cariveau, 2015) rather than on species 373 richness per se.
374 Finally, it should be noted that we focused on the service delivery potential on a per
375 area basis and that the total amount of services provided by large patches might still be larger 376 than that of small patches. Our findings should therefore not be interpreted as a trade-off
377 between large, biodiverse patches versus small patches that have a higher potential to deliver 378 services, but rather as an observation that small woodlands in agricultural landscapes have the 379 potential to deliver a high flow of services relative to their size.
381 The amount of forest cover around each woodland (cf. the habitat amount hypothesis, Fahrig, 382 2013) had no effect on multidiversity, multiservice delivery potential and individual services, 383 which indicates that habitat availability within the landscape did not influence the service 384 supply potential. This lack of effect may be a consequence of the disruption of
385 metacommunity functioning in highly fragmented systems, with the dispersal of species
386 among small forest patches dramatically reduced (Jamoneau, Chabrerie, Closset-Kopp, & 387 Decocq, 2012). Both models (Thompson & Gonzalez, 2016) and experiments (Haddad et al., 388 2015) predict reduced multifunctionality in such highly fragmented systems. The delivery of
389 some ecosystem services may decline with low habitat connectivity, and with an intensively 390 managed landscape matrix, as we have observed for the abundance of usable plants, which
391 decreased with the proportion of crops surrounding the forest patch. Such an effect most 392 likely results from a greater exposure of the forest edges to the biocides and fertilizers used in 393 the adjacent croplands (Chabrerie, Jamoneau, Gallet-Moron, & Decocq, 2013).
394 Macroclimatic conditions affected neither multidiversity nor multiservice delivery 395 potential, although we studied a large climatic gradient covering the entire European
396 temperate biome. Only one of the individual services, the abundance of usable plants, was 397 positively affected by macroclimate seasonality, increasing towards northern latitudes. This 398 overall lack of effects of macroclimate suggests that the expected major biogeographic
399 gradients influencing ecosystem service delivery potential are lost in highly fragmented forest 400 ecosystems, at least partly due to the loss of macroclimate-driven biodiversity gradients
401 (Valdés et al., 2015, Vanneste et al., 2019) and a decoupling between sub-canopy and free-air 402 temperatures (De Frenne et al., 2013, 2019; Frey et al., 2016; Lenoir, Hattab, & Pierre, 2017). 403 Similarly, other potentially influential microclimate factors such as soil moisture and relative
404 air humidity, not assessed in this study, could contribute to the observed lack of effects of 405 macroclimate on multidiversity and multiservice delivery.
406 Future research avenues
407 This study is a first step towards a better understanding of the factors that influence the 408 biodiversity and multiservice delivery potential of woodland patches in agricultural
409 landscapes. Obviously, not all possible services were considered here (see Decocq et al. 2016 410 for an overview) and this raises the question of whether inclusion of other services, like
411 erosion control and water quality regulation, both acting at a landscape scale, would alter the 412 results. This is not unlikely, since it has been shown that different services are underpinned by 413 different forest attributes (Felipe-Lucia et al., 2018). Next, inclusion of more driving
414 variables, e.g. those that quantify the past and current management and the microclimate in 415 the patches, may help to further clarify how human actions in these patches influence their
416 biodiversity and ecosystem service delivery potential. Another research avenue along the 417 same lines is making the step from ecosystem service delivery potential towards actual
418 ecosystem delivery. Indeed, not all services play an equally important role in all landscapes or
419 for all stakeholders, and potential ecosystem service assessments should ideally be 420 complemented by socio-economic analyses quantifying the importance and value of the
421 studied services (e.g. Bagstad et al., 2014; Zoderer et al., 2019). Finally, such integrated 422 analyses will require the use of more sophisticated indicators that better reflect the actual 423 ecosystem services that are delivered than the indicators we used.
424 CONCLUSIONS
425 Our study responds to the call for empirical research into the nature of the relationships
426 between fragmentation and ecosystem service supply potential (Mitchell et al., 2015). We 427 have shown that both large and small woodland patches in agricultural landscapes fulfill 428 important roles. The large, ancient woodlands host the highest biodiversity and are
429 particularly important for conservation. They also have the potential to deliver a considerable 430 flow of services, but smaller woodlands have a higher potential to deliver multiple ecosystem
431 services on a per area basis than the larger woodlands, especially when they are ancient. This 432 higher potential of small woodlands might be caused by edge effects that can enhance the 433 delivery potential of several services. Preserving the small woodlands is hence important to 434 increase the multifunctionality of agricultural landscapes. This is an important finding 435 because especially the small woodlands are currently not included in major national and
436 international policies affecting biodiversity and ecosystem services in agricultural landscapes, 437 such as the EU Natura 2000 network, the EU water Directive and the Common Agricultural 438 Policy (Pe’er et al., 2014). Our findings advocate for the development of relevant policy
439 instruments in order to ensure their future conservation. Next, we also found that the
440 importance of drivers vary depending on performance levels of the ecosystem service and on
441 the individual (dis-)service considered. A given driver may thus affect individual services in 442 opposite directions, which leads to trade-offs among services (Gamfeldt et al., 2013; Lefcheck 443 et al., 2015; Felipe-Lucia et al., 2018). Consequently, different management strategies of
444 these woodlands would be required to achieve multiservice delivery at high performance 445 levels or to maximize (respectively minimize) the delivery of a specific ecosystem service
446 (respectively disservice). For some services and performance levels, biodiversity conservation 447 and ecosystem service delivery go hand in hand, but in other cases there may be a trade-off 448 between both. This should be taken into account when designing policies and management
449 strategies for small woodlands in agricultural landscapes.
450 AUTHORS' CONTRIBUTIONS
451 Author contributions: AV, JL and PDF contributed equally to the work. KV and GD share the 452 last authorship. AV, JL, PDF, KV and GD designed the study. All authors collected the data. 453 JL, AV, PDF and KV analyzed the data. AV, JL, PDF, KV and GD wrote the first draft of the
454 paper. All authors contributed substantially to the writing and gave final approval for 455 publication.
456 ACKNOWLEDGEMENTS
457 We acknowledge Catherine Bataillon, Déborah Closset-Kopp, Katharina Filzen, Kent 458 Hansson, Aurélien Jamoneau, Tom Macheleidt, Willem Proesmans, Laurent Raison, Robert 459 Saguez, Ilka Strubelt, Johan Van Keer, Rieneke Vanhulle, Stephan Wehling, Jérôme Willm 460 and Christina Wolterink for fieldwork, Filip Moldan, Luc Willems, Greet de Bruyn and Lars
461 Rosenqvist for help with soil analyses, Régis Courtecuisse and Pierre-Arthur Moreau for help 462 with mushroom identification, Jérôme Buridant for help with patch history, Justine Louvel for 463 database elaboration, Peter Manning for comments on an earlier version of the manuscript and
464 Margot Vanhellemont for checking the English language. Funding: This research was funded 465 by the ERA-Net BiodivERsA project smallFOREST, with the national funders ANR (France),
466 MINECO (Spain), FORMAS (Sweden), ETAG (Estonia), DFG (Germany), BELSPO 467 (Belgium) and DLR (Germany) part of the 2011 BiodivERsA call for research proposals.
468 DATA ACCESSIBILITY
469 Should the manuscript be accepted, the data supporting the results will be archived in an 470 appropriate public repository (e.g. Dryad) and the data DOI will be included at the end of the
471 article.
472 REFERENCES
Adler, P. B., White, E. P., Lauenroth, W. K., Kaufman, D. M., Rassweiler, A., & Rusak, J. A. (2005). Evidence for a general species–time–area relationship. Ecology, 86(8), 2032–2039. doi: 10.1890/05-0067 Allan, E., Bossdorf, O., Dormann, C. F., Prati, D., Gossner, M. M., Tscharntke, T., … Fischer, M. (2014).
Interannual variation in land-use intensity enhances grassland multidiversity. Proceedings of the
Bagstad, K., Villa, F., Batker, D., Harrison-Cox, J., Voigt, B., & Johnson, G. (2014). From theoretical to actual ecosystem services: mapping beneficiaries and spatial flows in ecosystem service assessments. Ecology
and Society, 19(2). doi: 10.5751/ES-06523-190264
Balvanera, P., Pfisterer, A. B., Buchmann, N., He, J.-S., Nakashizuka, T., Raffaelli, D., & Schmid, B. (2006). Quantifying the evidence for biodiversity effects on ecosystem functioning and services. Ecology
Letters, 9(10), 1146–1156. doi: 10.1111/j.1461-0248.2006.00963.x
Balvanera, P., Siddique, I., Dee, L., Paquette, A., Isbell, F., Gonzalez, A., … Griffin, J.N. (2013). Linking biodiversity and ecosystem services: current uncertainties and the necessary next steps. BioScience,
64(1), 49–57. doi: 10.1093/biosci/bit003
Bastian., O. (2013). The role of biodiversity in supporting ecosystem services in Natura 2000 sites. Ecological
Indicators, 24(1), 12–22. doi: 10.1016/j.ecolind.2012.05.016
Bodin, Ö., Tengö, M., Norman, A., Lundberg, J., & Elmqvist, T. (2006). The value of small size: loss of forest patches and ecological thresholds in Southern Madagascar. Ecological Applications, 16(2), 440–451. doi: 10.1890/1051-0761(2006)016[0440:TVOSSL]2.0.CO;2
Byrnes, J. E. K., Gamfeldt, L., Isbell, F., Lefcheck, J. S., Griffin, J. N., Hector, A., … Emmett Duffy, J. (2014). Investigating the relationship between biodiversity and ecosystem multifunctionality: challenges and solutions. Methods in Ecology and Evolution, 5(2), 111–124. doi: 10.1111/2041-210X.12143
Chabrerie, O., Jamoneau, A., Gallet-Moron, E., & Decocq, G. (2013). Maturation of forest edges is constrained by neighbouring agricultural land management. Journal of Vegetation Science, 24(1), 58–69. doi: 10.1111/j.1654-1103.2012.01449.x
Craven, D., Filotas, E., Angers, V. A., & Messier, C. (2016). Evaluating resilience of tree communities in fragmented landscapes: linking functional response diversity with landscape connectivity. Diversity and
Distributions, 22(5), 505–518. doi: 10.1111/ddi.12423
De Frenne, P., Baeten, L., Graae, B. J., Brunet, J., Wulf, M., Orczewska, A., … Verheyen, K. (2011).
Interregional variation in the floristic recovery of post-agricultural forests. Journal of Ecology, 99(2), 600–609. doi: 10.1111/j.1365-2745.2010.01768.x
De Frenne, P., Rodríguez-Sánchez, F., Coomes, D. A., Baeten, L., Verstraeten, G., Vellend, M., … Verheyen, K. (2013). Microclimate moderates plant responses to macroclimate warming. Proceedings of the National
De Frenne, P., Zellweger, F., Rodríguez-Sánchez, F., Scheffers, B. R., Hylander, K., Luoto, M., … Lenoir, J. (2019). Global buffering of temperatures under forest canopies. Nature Ecology & Evolution, 3(5), 744. doi: 10.1038/s41559-019-0842-1
Decocq, G., Andrieu, E., Brunet, J., Chabrerie, O., Frenne, P. D., Smedt, P. D., … Wulf, M. (2016). Ecosystem services from small forest patches in agricultural landscapes. Current Forestry Reports, 2(1), 30–44. doi: 10.1007/s40725-016-0028-x
Donald, P. F., & Evans, A. D. (2006). Habitat connectivity and matrix restoration: the wider implications of agri-environment schemes. Journal of Applied Ecology, 43(2), 209–218. doi:
10.1111/j.1365-2664.2006.01146.x
Duffy, J. E., Godwin, C. M., & Cardinale, B. J. (2017). Biodiversity effects in the wild are common and as strong as key drivers of productivity. Nature, 549(7671), 261–264. doi: 10.1038/nature23886 Ehrmann, S., Liira, J., Gärtner, S., Hansen, K., Brunet, J., Cousins, S. A. O., … Scherer-Lorenzen, M. (2017).
Environmental drivers of Ixodes ricinus abundance in forest fragments of rural European landscapes.
BMC Ecology, 17(1). doi: 10.1186/s12898-017-0141-0
Estreguil, C., Caudullo, G., de Rigo, D., & San Miguel, J. (2013). Forest landscape in Europe: pattern, fragmentation and connectivity. EUR Scientific and Technical Research, 25717. Retrieved from
http://vwb-xforest.jrc.it/media/cms_page_media/53/2012-fragmentation_executive%20rep_EUR25717.doc.pdf
Ewers, R. M., & Banks-Leite, C. (2013). Fragmentation impairs the microclimate buffering effect of tropical forests. PLOS ONE, 8(3), e58093. doi: 10.1371/journal.pone.0058093
Fahrig, L. (2013). Rethinking patch size and isolation effects: the habitat amount hypothesis. Journal of
Biogeography, 40(9), 1649–1663. doi: 10.1111/jbi.12130
Fahrig, L. (2017). Ecological responses to habitat fragmentation per se. Annual Review of Ecology, Evolution,
and Systematics, 48(1), 1–23. doi: 10.1146/annurev-ecolsys-110316-022612
Felipe-Lucia, M. R., Soliveres, S., Penone, C., Manning, P., Plas, F. van der, Boch, S., … Allan, E. (2018). Multiple forest attributes underpin the supply of multiple ecosystem services. Nature Communications,
9(1), 4839. doi: 10.1038/s41467-018-07082-4
Flinn, K. M., & Vellend, M. (2005). Recovery of forest plant communities in post-agricultural landscapes.
Frey, S. J., Hadley, A. S., Johnson, S. L., Schulze, M., Jones, J. A., & Betts, M. G. (2016). Spatial models reveal the microclimatic buffering capacity of old-growth forests. Science Advances, 2(4), e1501392.
Gamfeldt, L., Hillebrand, H., & Jonsson, P. R. (2008). Multiple functions increase the abundance of biodiversity for overall ecosystem functioning. Ecology, 89(5), 1223–1231. doi: 10.1890/06-2091.1
Gamfeldt, L., Snäll, T., Bagchi, R., Jonsson, M., Gustafsson, L., Kjellander, P., … Bengtsson, J. (2013). Higher levels of multiple ecosystem services are found in forests with more tree species. Nature
Communications, 4, 1340. doi: 10.1038/ncomms2328
Haddad, N. M., Brudvig, L. A., Clobert, J., Davies, K. F., Gonzalez, A., Holt, R. D., … Townshend, J. R. (2015). Habitat fragmentation and its lasting impact on Earth’s ecosystems. Science Advances, 1(2), e1500052– e1500052. doi: 10.1126/sciadv.1500052
Hall, S. J. G., & Bunce, R. G. H. (2011). Mature trees as keystone structures in Holarctic ecosystems – a quantitative species comparison in a northern English park. Plant Ecology & Diversity, 4(2–3), 243– 250. doi: 10.1080/17550874.2011.586735
Hansen, M. C., Potapov, P. V., Moore, R., Hancher, M., Turubanova, S. A., Tyukavina, A., … Loveland, T. R. (2013). High-resolution global maps of 21st-century forest cover change. Science, 342(6160), 850–853. Herrera, J. M., & García, D. (2009). The role of remnant trees in seed dispersal through the matrix: being alone
is not always so sad. Biological Conservation, 142(1), 149–158.
Hunter, M. L. (2017). Conserving small natural features with large ecological roles: An introduction and definition. Biological Conservation, 211, 1–2. doi: 10.1016/j.biocon.2016.12.019
Jamoneau, A., Chabrerie, O., Closset-Kopp, D., & Decocq, G. (2012). Fragmentation alters beta-diversity patterns of habitat specialists within forest metacommunities. Ecography, 35(2), 124–133. doi: 10.1111/j.1600-0587.2011.06900.x
Jonsell, M. (2012). Old park trees as habitat for saproxylic beetle species. Biodiversity and Conservation, 21(3), 619–642. doi: 10.1007/s10531-011-0203-0
Lefcheck, J. S. (2016). piecewiseSEM: Piecewise structural equation modelling in r for ecology, evolution, and systematics. Methods in Ecology and Evolution, 7(5), 573–579. doi: 10.1111/2041-210X.12512 Lefcheck, J. S., Byrnes, J. E. K., Isbell, F., Gamfeldt, L., Griffin, J. N., Eisenhauer, N., … Duffy, J. E. (2015).
Biodiversity enhances ecosystem multifunctionality across trophic levels and habitats. Nature
Lenoir, J., Hattab, T., & Pierre, G. (2017). Climatic microrefugia under anthropogenic climate change: implications for species redistribution. Ecography, 40(2), 253–266. doi: 10.1111/ecog.02788
Lindenmayer, D. B. (2017). Conserving large old trees as small natural features. Biological Conservation, 211, 51–59. doi: 10.1016/j.biocon.2016.11.012
MacArthur, R. H., & Wilson, E. O. (1967). The theory of island biography. Princeton, New Jersey. Manning, A. D., Gibbons, P., & Lindenmayer, D. B. (2009). Scattered trees: a complementary strategy for
facilitating adaptive responses to climate change in modified landscapes? Journal of Applied Ecology,
46(4), 915–919.
Manning, Adrian D., Fischer, J., & Lindenmayer, D. B. (2006). Scattered trees are keystone structures – Implications for conservation. Biological Conservation, 132(3), 311–321. doi:
10.1016/j.biocon.2006.04.023
Mitchell, M. G. E., Bennett, E. M., & Gonzalez, A. (2014). Forest fragments modulate the provision of multiple ecosystem services. Journal of Applied Ecology, 51(4), 909–918. doi: 10.1111/1365-2664.12241 Mitchell, M. G. E., Suarez-Castro, A. F., Martinez-Harms, M., Maron, M., McAlpine, C., Gaston, K. J., …
Rhodes, J. R. (2015). Reframing landscape fragmentation’s effects on ecosystem services. Trends in
Ecology & Evolution. doi: 10.1016/j.tree.2015.01.011
Naaf, T., & Kolk, J. (2015). Colonization credit of post-agricultural forest patches in NE Germany remains 130– 230 years after reforestation. Biological Conservation, 182, 155–163. doi:
10.1016/j.biocon.2014.12.002
Pe’er, G., Dicks, L. V., Visconti, P., Arlettaz, R., Báldi, A., Benton, T. G., … Scott, A. V. (2014). EU
agricultural reform fails on biodiversity. Science, 344(6188), 1090–1092. doi: 10.1126/science.1253425 Penone, C., Allan, E., Soliveres, S., Felipe‐Lucia, M. R., Gossner, M. M., Seibold, S., … Fischer, M. (2019).
Specialisation and diversity of multiple trophic groups are promoted by different forest features.
Ecology Letters, 22(1), 170–180. doi: 10.1111/ele.13182
Pinheiro, J., Bates, D., DebRoy, S., & Sarkar, D. (2016). nlme: Linear and Nonlinear Mixed Effects Models. R
Package Version 3.1-128.
R Core Team. (2018). R: A language and environment for statistical computing. R Foundation for Statistical
Remy, E., Wuyts, K., Van Nevel, L., De Smedt, P., Boeckx, P., & Verheyen, K. (2018). Driving factors behind litter decomposition and nutrient release at temperate forest edges. Ecosystems, 21(4), 755–771. doi: 10.1007/s10021-017-0182-4
Remy, E., Wuyts, K., Verheyen, K., Gundersen, P., & Boeckx, P. (2018). Altered microbial communities and nitrogen availability in temperate forest edges. Soil Biology and Biochemistry, 116, 179–188. doi: 10.1016/j.soilbio.2017.10.016
Scherber, C., Eisenhauer, N., Weisser, W. W., Schmid, B., Voigt, W., Fischer, M., … Tscharntke, T. (2010). Bottom-up effects of plant diversity on multitrophic interactions in a biodiversity experiment. Nature,
468(7323), 553–556. doi: 10.1038/nature09492
Shipley, B. (2009). Confirmatory path analysis in a generalized multilevel context. Ecology, 90(2), 363–368. doi: 10.1890/08-1034.1
Suding, K. N., Lavorel, S., Chapin, F. S., Cornelissen, J. H. C., Díaz, S., Garnier, E., … Navas, M.-L. (2008). Scaling environmental change through the community-level: a trait-based response-and-effect framework for plants. Global Change Biology, 14(5), 1125–1140. doi: 10.1111/j.1365-2486.2008.01557.x
Thompson, P. L., & Gonzalez, A. (2016). Ecosystem multifunctionality in metacommunities. Ecology, 97(10), 2867–2879. doi: 10.1002/ecy.1502
Valdés, A., Lenoir, J., Gallet-Moron, E., Andrieu, E., Brunet, J., Chabrerie, O., … Decocq, G. (2015). The contribution of patch-scale conditions is greater than that of macroclimate in explaining local plant diversity in fragmented forests across Europe. Global Ecology and Biogeography, 24(9), 1094–1105. doi: 10.1111/geb.12345
van der Plas, F., Manning, P., Allan, E., Scherer-Lorenzen, M., Verheyen, K., Wirth, C., … Fischer, M. (2016). Jack-of-all-trades effects drive biodiversity–ecosystem multifunctionality relationships in European forests. Nature Communications, 7, 11109. doi: 10.1038/ncomms11109
Vanneste, T., Valdés, A., Verheyen, K., Perring, M. P., Bernhardt-Römermann, M., Andrieu, E., … De Frenne, P. (2019). Functional trait variation of forest understorey plant communities across Europe. Basic and
Weathers, K. C., Cadenasso, M. L., & Pickett, S. T. A. (2001). Forest edges as nutrient and pollutant concentrators: potential synergisms between fragmentation, forest canopies and the atmosphere.
Conservation Biology, 15(6), 1506–1514. doi: 10.1046/j.1523-1739.2001.01090.x
Winfree, R., W. Fox, J., Williams, N. M., Reilly, J. R., & Cariveau, D. P. (2015). Abundance of common species, not species richness, drives delivery of a real-world ecosystem service. Ecology Letters, 18(7), 626–635. doi: 10.1111/ele.12424
Zoderer, B. M., Tasser, E., Carver, S., & Tappeiner, U. (2019). Stakeholder perspectives on ecosystem service supply and ecosystem service demand bundles. Ecosystem Services, 37, 100938. doi:
473 Figure 1: Linking island biogeography (MacArthur & Wilson, 1967) and ecosystem
474 functioning for studying the supply potential of multiple ecosystem services by small forest 475 patches. Hypothetical framework on the effects of forest continuity across space and over 476 time on immigration and extinction rates, and thus on the level of biodiversity (i.e. total 477 number of species per forest patch) and the associated supply potential of multiple ecosystem
478 services. (A) MacArthur & Wilson’s theory of island biogeography adapted to forest
479 spatiotemporal characteristics (effect of patch connectivity and age on immigration rate and of 480 patch size on extinction rate). (B) Theoretically expected relationship between species
481 richness and supply potential of multiple ecosystem services. The letters along the x-axis (a, 482 b, c and d) depict different landscapes with different expectations on species richness and thus
483 on supply potential of multiple ecosystem services, consisting of: (a) small, isolated and 484 recent forest patches (a lower species richness is expected); (b) large but isolated and recent 485 forest patches (intermediate levels of species richness are expected); (c) small but connected
486 and ancient forest patches (intermediate levels of species richness are expected); and (d) large, 487 connected and ancient forest patches (a higher species richness is expected). The green line
488 and the green shaded polygon depict the average expected relationship between species 489 richness and supply potential of multiple ecosystem services as well as the hypothetic 490 confidence interval of all possible shapes we can expect for this relationship, respectively.
491 Figure 2: Sampling biodiversity and ecosystem service supply potential in small forest 492 patches in agricultural landscapes. (A) Sampling locations along the 2500-km latitudinal
493 gradient in Europe (SF = South France, NF = North France, BE = Belgium, WG = West 494 Germany, EG = East Germany, SS = South Sweden, CS = Central Sweden). (B) Detail of two 495 of the 14 studied landscapes (low vs. high connectivity) in North France, showing the
497 (C) Detail of the six taxonomic groups, six ecosystem services (blue) or disservices (red) and 498 four groups of drivers assessed within each of the selected forest patches.
499 Figure 3: Linkage between the environment, biodiversity and high-performance multiservice 500 delivery potential in small woodlands across Europe. Results of the piecewise structural 501 equation model (p = 0.512) studying the response of high-performance multiservice delivery
502 potential to multidiversity, patch size, age and connectivity (proportion of forests and crops in 503 a 500-m surface around each patch), while accounting for macroclimate, soil and forest 504 structural characteristics as environmental drivers. Blue arrows indicate positive effects and
505 red arrows indicate negative effects. Arrow thickness is proportional to the effect size. Only 506 significant paths (p < 0.05) are shown, while variables not significantly contributing to the
507 models are attenuated and represented with grey shading.Grey crossed arrows have been 508 included to highlight the lack of effects of multidiversity on multiservice, and of tree species 509 diversity and stand structure on multidiversity. The blue square depicts the positive interaction
510 effect (p = 0.03) between patch size and historical age on multidiversity, as predicted by the 511 species-time-area relationship. Marginal (i.e. fixed effects) and conditional (fixed plus random
512 effects) R2 values are 0.33 and 0.48, respectively. The color ramp from red to blue depicts 513 different historical patch ages ranging from the youngest (10 yrs) to the oldest (270 yrs) 514 sampled patch (n = 200). All covariates (connectivity, macroclimate, soil and stand
515 conditions) in the model except patch size and historical age were set to their mean values. 516 Figure 4: Linkage between the environment, biodiversity and individual ecosystem service
517 supply potential in small woodlands across Europe. Results of the piecewise structural
518 equation models studying the response of each individual ecosystem service to multidiversity, 519 patch size, historical age and connectivity (proportion of forests and crops in a 500-m surface
520 around each patch), while accounting also for macroclimate, soil and forest structural
522 indicate negative effects. Arrow thickness is proportional to the effect size. Only significant 523 paths (p < 0.05) are shown, while variables not significantly contributing to the models are 524 attenuated and represented with grey shading. The overall p-value for each piecewise 525 structural equation model (piecewise SEM) is shown in the heading of each panel.
Figure 1: Linking island biogeography (MacArthur & Wilson, 1967) and ecosystem functioning for studying the supply potential of multiple ecosystem services by small forest patches. Hypothetical framework on the effects of forest continuity across space and over time on immigration and extinction rates, and thus on the level of biodiversity (i.e. total number of species per forest patch) and the associated supply potential of
multiple ecosystem services. (A) MacArthur & Wilson’s theory of island biogeography adapted to forest spatiotemporal characteristics (effect of patch connectivity and age on immigration rate and of patch size on
extinction rate). (B) Theoretically expected relationship between species richness and supply potential of multiple ecosystem services. The letters along the x-axis (a, b, c and d) depict different landscapes with different expectations on species richness and thus on supply potential of multiple ecosystem services, consisting of: (a) small, isolated and recent forest patches (a lower species richness is expected); (b) large
but isolated and recent forest patches (intermediate levels of species richness are expected); (c) small but connected and ancient forest patches (intermediate levels of species richness are expected); and (d) large, connected and ancient forest patches (a higher species richness is expected). The green line and the green shaded polygon depict the average expected relationship between species richness and supply potential of
multiple ecosystem services as well as the hypothetic confidence interval of all possible shapes we can expect for this relationship, respectively.
Figure 2: Sampling biodiversity and ecosystem services in small forest patches in agricultural landscapes. (A) Sampling locations along the 2500-km latitudinal gradient in Europe (SF = South France, NF = North
France, BE = Belgium, WG = West Germany, EG = East Germany, SS = South Sweden, CS = Central Sweden). (B) Detail of two of the 14 studied landscapes (low vs. high connectivity) in North France, showing
the distribution of land uses and the selected forest patches in red. Each landscape is 5 × 5 km2. (C) Detail of the six taxonomic groups, six ecosystem services (blue) or disservices (red) and four groups of drivers
assessed within each of the selected forest patches. 245x215mm (300 x 300 DPI)
Figure 3: Linkage between the environment, biodiversity and high-performance multiservice delivery in small woodlands across Europe. Results of the piecewise structural equation model (piecewise SEM, p = 0.512) studying the response of high-performance multiservice (MS) delivery to multidiversity, patch size,
age and connectivity (proportion of forests and crops in a 500-m surface around each patch), while accounting for macroclimate, soil and forest structural characteristics as environmental drivers. Blue arrows
indicate positive effects and red arrows indicate negative effects. Arrow thickness is proportional to the effect size. Only significant paths (p < 0.05) are shown, while variables not significantly contributing to the
models are attenuated and represented with grey shading. Grey crossed arrows have been included to highlight the lack of effects of multidiversity on multiservice, and of tree species diversity and stand structure on multidiversity. The blue square depicts the positive interaction effect (p = 0.03) between patch
size and historical age on multidiversity, as predicted by the species-time-area relationship. Marginal (cf. fixed effects) and conditional (fixed and random effects) R2 values are 0.33 and 0.48, respectively. The color ramp from red to blue depicts different historical patch ages ranging from the youngest (10 yrs) to the
oldest (270 yrs) sampled patch (n = 200). All covariates (connectivity, macroclimate, soil and stand conditions) in the model except patch size and historical age were set to their mean values.
Figure 4: Linkage between the environment, biodiversity and individual ecosystem services in small woodlands across Europe. Results of the piecewise structural equation models studying the response of each
individual ecosystem service to multidiversity, patch size, historical age and connectivity (proportion of forests and crops in a 500-m surface around each patch), while accounting also for macroclimate, soil and
forest structural characteristics as environmental drivers. Blue arrows indicate positive effects and red arrows indicate negative effects. Arrow thickness is proportional to the effect size. Only significant paths (p
< 0.05) are shown, while variables not significantly contributing to the models are attenuated and represented with grey shading. The overall p-value for each piecewise structural equation model (piecewise
SEM) is shown in the heading of each panel. 294x281mm (300 x 300 DPI)
1 Supplementary Information
3 Appendix S1: Supplementary Methods.
4 Details on patch selection
5 We wanted the subset of patches selected for sampling to be representative of
6 the variation of patch size and historical age within each window. For that
7 purpose, we divided all patches occurring within a given landscape window into
8 two categories of size (small vs. large patches) and historical age (historically
9 old vs. historically young patches), by using the median values of, respectively,
10 patch size and historical age as division points between categories. Next, we
11 selected 16 patches per window (i.e., 224 patches in total). Our aim was to
12 select four patches for each of the combinations of size times historical age
13 categories (small-old, small-young, large-old, large-young), although due to
14 various reasons (e.g. some patches being unsuitable for sampling) this was not
15 always possible. Summary statistics for each category per landscape window
16 are shown in Table S1).
18 Soil samples were taken during the period from August to October 2012 before
19 leaves were shed and when the soil was well moisturized. For each patch, we
20 sampled soil evenly along parallel transect lines located 50-m apart from each
21 other. In the smallest patches (less than 7000 m2) a total of 3-5 soil samples
22 were sampled and subsequently pooled. In bigger patches, the number of soil
23 samples were related to patch size, ranging from 5 to 31 soil samples per patch
24 (mean±SE = 5.99±0.26 samples per patch). We used a frame of 25 × 25 cm2 to
25 collect forest floor samples. Care was taken not to mix forest floor with mineral
26 soil when collecting the samples. The mineral soil was sampled using a metal
27 soil core with a diameter of 4.2 cm. One core sample was taken down to 10 cm
28 in mineral soil at all places where forest floor was removed. A total of 1315
29 forest floor samples and 1315 mineral soil samples were taken.
30 The samples were dried at 40°C and subsequently weighed. Ten percent
31 of the samples were later dried at 105ºC to establish a correction factor for
32 weight loss. The soil was passed through a 1 mm sieve to remove stones and
33 gravel. Fine and coarse roots were removed by hand and weighed. All samples
35 phosphorous (P) in a single laboratory provider. Soil pH (CaCl2) was measured
36 using a glass electrode (Orion, Orion Europe, Cambridge, England, model
37 920A) following the procedure described in ISO 10390:1994(E). The
38 concentration of C and N was measured by high temperature combustion at
39 1150°C using an elemental analyzer (Vario MACRO cube CNS, Elementar,
40 Germany). Total P concentration was measured after complete destruction with
41 HClO4 (65%), HNO3 (70%) and H2SO4 (98%) in Teflon bombs for 4 hours at
42 150°C. P concentrations were measured according to the malachite green procedure 43 (Lajtha, Driscoll, Jarrell, & Elliott, 1999).
44 For each sample, we calculated the average depth of the forest floor (cm), and 45 the total C and N contents (Mg ha-1), the C:N ratio, the total P content (kg ha-1)
46 and the pH (CaCl2) of the mineral topsoil (0-10 cm).
47 Details on data collection for forest structural drivers
48 Data were collected at 1-9 randomly chosen points per patch (number of points
49 depending on patch size, mean±SE = 2.34±0.13) using an adaptation of the Point-50 Center-Quarter (Cottam & Curtis, 1956) method. Instead of one tree per quarter, two 51 trees per quarter were measured, to gain an increased degree of detail per sample point.
52 Trees were chosen to be of small and large diameter per quadrant and would thus 53 represent different layers/historical age classes of the sampled forest patches. Small
54 trees were chosen to be between 7 cm and 30 cm in diameter at breast height (d130) and 55 larger trees were chosen to be larger than 30 cm at d130. For each tree we recorded the 56 species, tree height, number of stems, d130, the distance and angle to the central 57 sampling point and whether the tree was alive. Sampling was restricted to a 20-m radius 58 around the central point and if no tree of either group was found per quadrant, this was
59 recorded.
60 Details on data collection for biodiversity 61 Understory herbs
62 All patches were comprehensively surveyed for all understory herb (i.e. non-woody) 63 species by walking along parallel transects located 10-m apart from each other. Along
64 these transects, we recorded all species seen and thus obtained a quasi-exhaustive value 65 of understory herb species richness for each patch.
66 Arthropods
67 Species richness of arthropods belonging to four taxonomic groups, including ground 68 beetles (Insecta), spiders (Arachnida), millipedes (Myriapoda) and woodlice (Crustacea)
69 was evaluated using pitfall trap sampling. We used pitfall traps with a diameter of 10 70 cm and a depth of 11 cm. Traps were filled with 200 ml of ethylene glycol and water 71 (1:1). A drop of detergent was added to remove water surface tension and the traps were
72 equipped with aluminum roofs. In order to sample as much of the whole species 73 community a sample point was set-up in the center of each patch and a second one was
74 placed at the south-facing edge of the patch. If the south-facing edge was not suitable 75 e.g. bordered by a ditch, road or other physical barrier (38 % of the edges), we used the 76 eastern (16 % of the edges), western (18 %) or northern edge (4 %) instead. Each