Characterization of Rotating Cavitation in a Four Bladed Inducer
The MIT Faculty has made this article openly available.
Please share
how this access benefits you. Your story matters.
Citation
Lettieri, Claudio, Zoltan Spakovszky, David Jackson, and Vincent
Wang. “Characterization of Rotating Cavitation in a Four Bladed
Inducer.” 52nd AIAA/SAE/ASEE Joint Propulsion Conference, July
25-27, 2016, Salt Lake City, UT.
As Published
http://dx.doi.org/10.2514/6.2016-4986
Publisher
American Institute of Aeronautics and Astronautics (AIAA)
Version
Author's final manuscript
Citable link
http://hdl.handle.net/1721.1/105750
Terms of Use
Creative Commons Attribution-Noncommercial-Share Alike
Characterization of Rotating Cavitation in a Four Bladed
Inducer
C. Lettieri
ab, Z. Spakovszky
a, D. Jackson
c, V. Wang
aa) Massachusetts Institute of Technology, Cambridge, Massachusetts, USA b) Delft University of Technology, Delft, The Netherlands
c) Aerospace Corporation, Los Angeles, California, USA
Abstract
This work aims to characterize the dynamic behavior of a four bladed inducer and clarify the physical mechanism that leads to the onset of rotating cavitation. The inducer under consideration is representative of a low-pressure liquid oxygen pump (LPOP) inducer of modern design and incorporates several standard design features used in rocket turbopumps to suppress rotating cavitation. The mechanism is characterized based on a combination of two-phase numerical simulations and inducer experiments. Experimental measurements demonstrate a supersynchronous rotating cavity in the periphery of the inducer inlet at frequencies between 1.2 and 1.6 times rotor frequency and a synchronous 2nd spatial harmonic pattern associated with alternate blade cavitation. The analysis
indicates a causal link between alternate blade cavitation and rotating cavitation, with a distinct cut-on cut-off behavior. Numerical calculations and high-speed videos elucidate the mechanism of breakdown of alternate blade cavitation and the formation of rotating cavitation. The present work suggests that rotating cavitation is caused by the coupling of the cavities on adjacent blades during alternate blade cavitation. Due to the nearly tangential flow, the vortex lines from one of the non-cavitating blades wrap around the blade leading edge of the adjacent blade, which yields a drop in static pressure and cavity formation. The tip vortex cavity interaction with the leading edge of the blade leads to sheet cavity breakdown with periodic growth and collapse of cavities, creating the apparent super-synchronous rotation of the cavitating region.
1.
Introduction
Large-scale liquid rocket engines require high-speed turbopumps to inject cryogenic propellants into the combustion chamber. The turbopumps are one of the most critical components in the engine and often up to 50% of the development costs are ascribed to their design and testing [1]. To provide the required propellant mass flow rate and pressure rise while maintaining low system mass the turbopumps must operate at high rotational speeds, which in turn lead to the formation of vapor cavities at the inlet. Axial inducers can reduce the amount of cavitation but are prone to cavitation instabilities, which can dramatically limit the performance and life of the turbopumps and even cause system failure and loss of the mission [2]. Instabilities due to vapor cavity formation can be classified into two kinds: 1) cavitation surge, characterized by pulsation of the working fluid and 2) rotating cavitation, characterized by synchronous or super-synchronous (i.e. faster than rotor speed) pump
vibrations [3]. Historically, cavitation surge and rotating cavitation were encountered during the development of modern high performance turbopumps such as the LE-7 and LE-7A main engine of the Japanese H-2 rocket [4], in the turbopumps of the Space Shuttle Main Engine (SSME) [5-6], and also during the development of the ARIANE V [7]. While the physical mechanism associated with cavitation surge has been clarified in previous studies [8-9], rotating cavitation (RC) is not fully understood and as such no general design guidelines exist to avoid its onset.
Hashimoto et al. [10] described RC as a cavitating region, which rotates super-synchronously in the periphery of the inducer inlet. The cavity region under certain conditions is synchronous and remains locked to one blade, as described in Tani et al. [11]. In inducers with odd number of blades (three or five), a large cavity can form on one or two blades, and the corresponding mode of operation is often referred to as Asymmetric Cavitation (AC). In inducers with an even number of blades (four), the cavities can occur on alternate
blades, forming Alternate Blade Cavitation (ABC). Watanabe et al. [12], Kimura et al. [13] and Tsujimoto [2] showed that the AC is a precursor of RC in three bladed inducers. Tsujimoto et al. [14] and Kang et al. [15] conducted experiments to characterize RC, suggesting that the instability is likely to occur just before the head fall-off and at flow coefficients higher than design condition. Tsujimoto et al. [2] and Cervone et al. [16] used high-speed videos to investigate the inducer cavitating behavior and estimate the individual blade cavity length as a function of cavitation number at constant flow rate or at different flow rates while maintaining fixed the cavitation number. The optical measurement required frontal and side optical access through a transparent casing, increasing the costs and complexity of the experiment. Static pressure measurements can be used to determine the direction and mode of propagation of the rotating cavity and are usually the method of choice. In this paper we will use a spatial Fourier decomposition of unsteady inlet pressure measurements to define the direction of rotation and the spatial harmonic content of the rotating cavity.
Although previous studies have experimentally characterized the instantaneous cavity behavior, the mechanism of formation and propagation of RC remains unknown and there is no clear indication of what inducer design parameters mostly influence its onset. Kang et al. [15] suggests that the flow coefficient plays an important role in the onset of RC. RC occurs only at high flow rates, and when the flow coefficient is reduced the instability is either absent or changes entirely in nature. Tani et al. [11] clarified the reasons for this behavior, suggesting that RC is caused by the negative flow divergence caused by the blade cavity collapse that leads to reduced incidence for the adjacent blade. When the cavity fills about 65% of the blade pitch, the turning of the flow at the back of the cavity might interact with the adjacent blade, as shown schematically in Fig. 1. The authors conducted numerical calculations of a three bladed inducer and found that when the flow coefficient is large, the backflow is weak, and the interaction of the blade cavity with the adjacent blade is strong. In contrast, at low flow coefficients a large region of backflow forms, suppressing this interaction. However, the authors do not compare the frequency of RC from the computations with experimental data and the proposed mechanism cannot be verified.
Iga et al. [3] have used numerical simulation of a 2D cascade to investigate the mechanism of formation and propagation of RC, suggesting that the apparent super-synchronous rotation is the result of the periodic growth and collapse of each individual blade cavity due to cavity sheet breakoff. In this, the authors assumed the existence of rotating stall at operating points with a negatively sloped characteristic (i.e. stable), which was required to bring the estimated rotating cavity frequencies in agreement with the
measured values. Although the existence of rotating stall at these conditions cannot be confirmed, the variation in cavity sheet breakoff frequency can by itself explain the decrease in rotating frequency of RC with cavitation number, at least qualitatively.
Figure 1 – Mechanism of formation of Rotating
Cavitation – adapted from [11]
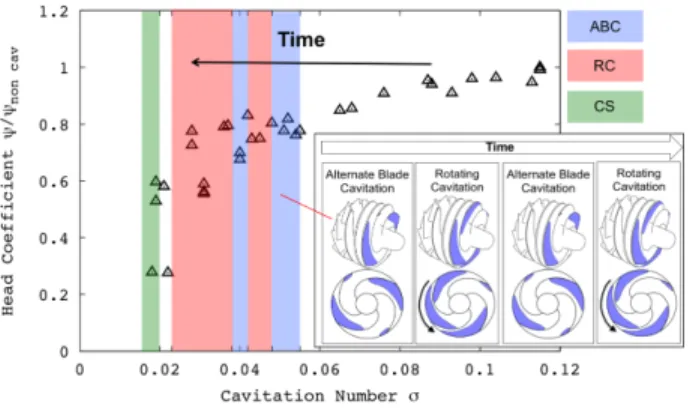
The mechanism of formation and propagation of RC proposed by Tani et al.[11] and Iga et al. [3] cannot explain entirely the dynamic behavior observed in experiments of four bladed inducers. The dynamic behavior of the inducer under consideration in this study is presented in Fig. 2. During the cavitation ramp test the pressure of the system is reduced slowly and continuously, decreasing the cavitation number σ=(P-Pvap)/(0.5ρU22) while acquiring dynamic data. ABC
appears first at σ=0.055 and is observed for cavitation numbers as low as σ=0.048 when RC is encountered. RC is then observed down to σ=0.042 when ABC appears again and persist down to σ=0.038, when RC occurs again, but this time with less prominent signature. In this paper we hypothesize that there are two routes that can lead to breakdown of ABC and onset of RC. At low cavitation numbers, σ<0.035 for the inducer investigated here, the onset of RC is triggered by the cavity sheet breakoff of a cavitating blade that leads to an incidence swing for the adjacent blade, as indicated by Tani et al. [11]. At higher cavitation numbers (σ>0.035) RC is triggered by the tip vortex cavity of one of the non-cavitating blades interacting with the adjacent blade. The tip vortex cavity acts as an enlarged cavity for one of the blades. Due to the nearly tangential flow, the vortex lines from one of the non-cavitating blades wrap around the blade leading edge of the adjacent blade, which yields a drop in static pressure and cavity formation. The tip vortex cavity interaction with the leading edge of the next blade leads to sheet cavity breakdown with periodic growth and collapse of cavities, and creates the apparent super-synchronous rotation of the cavitating region. In this case RC is characterized by large power spectral densities that are associated with strong vibrations. The perturbations are more prominent than for the case at lower
cavitation numbers.
Figure 2 Cavitation regimes on a knee curve.
Kimura et al. [13] combined experiments and single-phase computations to investigate the root cause of RC in three bladed inducers. The authors observed that at flow coefficients where RC is observed, the tip vortex cavity of one blade interacts with adjacent blades. This interaction is inhibited at low flow coefficients due to the action of the backflow that displaces the tip vortex away from the adjacent blade. Tani et al. [11] suggests that the tip vortex interaction is not the primary cause for the onset or RC. This conclusion was based on unsteady Reynolds Averaged Navier Stokes (RANS) calculations of a three bladed inducer. However, AC in inducers with an odd number of blades yields asymmetric loading on the blades that might result in an uneven tip gap around the circumference. The transition to RC is not always observed at the same conditions in the experiments and the tip vortex position cannot be accurately predicted by the numerical calculations. ABC in four bladed inducers yields a symmetric and quasi-stable operating condition of the turbopump and the trajectory of the tip vortex is similar to that of the non-cavitating case as shown by Kimura et al. [13]. In the present study, numerical calculations indicate that at conditions for which RC was observed the tip vortex cavity interacts with the adjacent blade.
2. Scope of Paper
This work aims to experimentally and numerically characterize the cavitating dynamic behavior of a four bladed inducer and clarify the physical mechanism responsible for rotating cavitation. It is hypothesized that RC is initiated by the breakdown of alternate blade cavitation due to the interaction of the tip vortex cavity with the adjacent blades. The change of incidence caused by the formation of the tip vortex cavity at low cavitation numbers leads to the periodic growth and collapse of the individual blade cavities, which is perceived in the absolute frame as a super-synchronously rotating perturbation. The hypothesized mechanism is
supported by a combination of numerical calculations, experimental measurements and optical flow visualizations.
A spatial Fourier decomposition of unsteady inlet pressure measurements is applied to define the direction of rotation and the spatial harmonic content (i.e number of cavities) that characterizes RC. Experimental testing identifies RC at flow coefficients higher than design conditions and at a cavitation numbers away from head drop-off. The analysis also reveals a 2nd spatial harmonic pattern associated with ABC and indicates a link between ABC and RC. Flow visualizations and unsteady numerical calculations under the same conditions as those at which RC was observed show the formation of the tip vortex cavity and the subsequent onset of rotation of the blade cavities.
3. Test Inducer
The inducer under consideration was designed at the Massachusetts Institute of Technology (MIT) with the intent of investigating rotating cavitation (RC) instabilities while representing the steady performance characteristics of a ‘modern’ inducer design. This new design will be referred to as the MIT inducer. Brennen [18] presents several examples of inducer geometries and their performance. Most inducers of recent design are unshrouded, with a swept leading edge and often with a forward cant to the blades. One such inducer is the low-pressure oxidizer pump (LPOP) of the Space Shuttle Main Engine (SSME) [18]. Often the inducer is followed by a set of tandem blades that increase the flow turning and improve the head rise coefficient. The inducer presented in this work yields performance and dynamic behavior similar to the SSME LPOP.
The MIT inducer consists of a 4 bladed, highly backswept inducer followed by 12 tandem blades. The inducer is shown in Fig. 3. The main design characteristics are reported in Table 1. Further details of the geometry are given in [23]. A 4 bladed inducer is chosen over a 3 or 5 bladed design to allow the formation of alternate blade cavitation (ABC). ABC is a stable and symmetric flow condition from which RC develops in a clean manner. Asymmetric cavitation (AC), found in inducers with an odd number of blades, often leads to an asymmetric load on the blades, yielding a non-axisymmetric tip gap flow distribution and strong vibrations, as reported by Tani et al. [11].
The leading edge (LE) tip blade angle, the rotational speed and the design flow coefficient are selected to be similar to those of the SSME LPOP as reported in Brennen [18]. The design rotational speed and flow coefficient are set to 6000 rpm and 0.07 respectively. Sharp LE are often used in turbopump designs to improve the cavitating performance. In this work we hypothesize that if the inducer is well designed
based on incidence, the shape of the LE has little impact on RC. Thus a simple elliptic leading edge shape was chosen. Backsweeps larger than 90 degrees are considered beneficial for mitigating RC. A backsweep of 120 degrees is therefore chosen and the tip clearance is set to 1% of span at inlet and kept constant from LE to TE.
Figure 3 MIT inducer Table 1 Dimensions of MIT-PLOP inducer
Inducer Tandem blades
Inlet design flow coefficient 0.07 0.14 Blades 4 12 Tip radius 37.8 mm 37.8 mm Inlet hub to tip ratio 0.29 0.74 Outlet hub to tip ratio 0.72 0.83 Inlet tip
angle 82.7 Deg 81 Deg Outlet tip
angle 74 Deg 60 deg
Backsweep 120 Deg 0 Deg Inlet tip gap 1% 2.7%
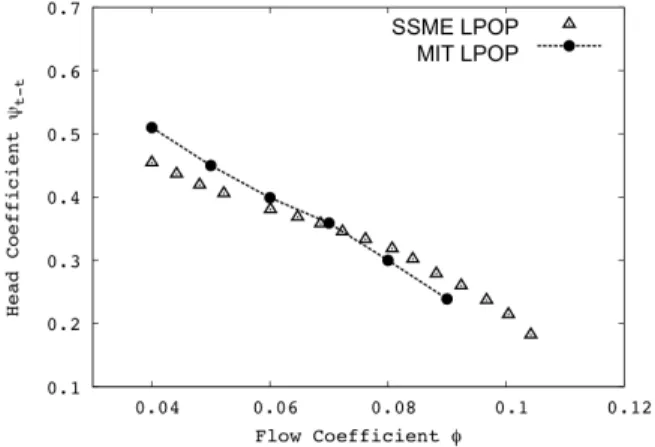
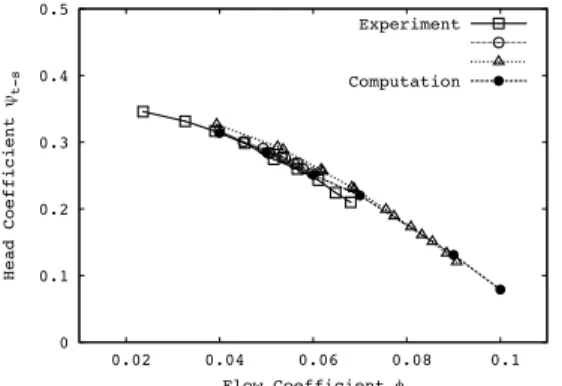
Numerical analysis is conducted using ANSYS CFX 14.5 [20]. The computed performance of the MIT inducer are compared with the measured SSME turbopump performance in Fig 4 and 5, as a reference.
The slope of the total-to-total and total-to-static head rise coefficient calculated for the MIT PLPOP design is in good agreement with that of the SSME-LPOP, indicating that the two designs have similar dynamic behavior. The total-to-static head rise coefficient is about 25% lower for the MIT-LPOP due to the larger tip gap and reduced inlet-to-outlet area ratio that were imposed by size limitations of the inducer test facility used in this study. The computations show a similar depression of the head rise than the experiment.
Figure 4 Computed total-to-static head rise coefficient of MIT
inducer (circles) compared to SSME LPOP data (triangles). The identical slope of the characteristics suggests that the two inducers have similar dynamic behavior – SSME data from Braisted [19].
Figure 5. Computed total-to-total head rise coefficient of MIT
inducer (circles) compared to SSME LPOP data (triangles). – SSME data from Braisted [19].
2. Experimental Assessment
The experimental tests of the MIT inducer were performed in the closed-loop inducer test facility at the Aerospace Corporation. This facility is designed to provide steady and unsteady performance data for inducers over a wide range of operating conditions. The details of the facility can be found in [21-22].
2.1 Steady Inducer Performance
The steady non-cavitating and cavitating performance of the inducer are compared with the numerical predictions in Fig. 6, 7 and 8 to verify the computational method. The commercial solver ANSYS CFX 14.5 was used for all the calculations. The computational method solves the Reynolds Averaged
Navier-Stokes (RANS) equations with the two-equation k-ω shear stress transport (SST) turbulence model. An Euler-Euler formulation is applied in two-phase calculations through a two-phase one-fluid model, which solves a separate conservation equation for the water vapor mass fraction. The mass transfer rate between the liquid and vapor phases is derived from a generalized Rayleigh-Plesset equation that ignores high order oscillation effects and surface tension effects on bubble growth rate. The formulation assumes there is no slip velocity between liquid and gas phases. Further details of the numerical procedure can be found in [20]. Three experimental tests were conducted to assess the repeatability of the results. All tests were conducted in room temperature water. During these tests, the tank ullage is vented to atmosphere to ensure fully wetted conditions at the inducer inlet. After accelerating the inducer to the target test speed, the facility boost pump and flow control valve are used to step through a series of operating points spanning the test range. The flow coefficient range is then spanned in the reverse direction to check for hysteresis and/or measurement uncertainties due to transducer zero drift. The fully wetted data show the expected decrease in head coefficient (pressure rise) with increasing flow coefficient. The calculations in Fig. 6 are within 0.1% of the experimental data in the range of flow coefficients between 0.07 and 0.09 of interest for rotating cavitation (RC). A discrepancy up to 4% is found at lower flow coefficients, which is likely caused by limitations in the computations capturing the extent of the backflow region in the RANS calculations. At low flow coefficient the large incidence leads to increased blade loading and more severe tip gap flow. The tip flow travels far upstream forming a large region of reversed flow. In this region the turbulent scalar fluxes and Reynolds stresses are non-linear and the eddy-viscosity model yields large errors, leading to reduced accuracy of the calculations.
The cavitating performance is shown in terms of a so-called knee curve in Figure 7 at low flow coefficients (ϕ=0.055) and in Figure 8 at flow coefficients for which RC was observed (ϕ=0.082). During this test, the inducer is accelerated to the desired test speed, while the ullage pressure is adjusted to maintain the cavitation number between 0.2-0.3. Once steady state conditions are reached, the ullage pressure is slowly lowered to span the desired cavitation number range establishing steady-state operating conditions and acquiring data points along the way. As the cavitation number decreases, vapor bubbles grow. Eventually these bubbles restrict fluid flow through the inducer blade passages and the head coefficient decreases. The two-phase steady calculations are in good agreement with the experiments at low flow coefficient, with the largest discrepancy below 1%. At ϕ=0.082 the computations can capture the initial performance drop off point but yield large discrepancies in terms of
computed head coefficient, with differences up to 40% compared to the measured data. This is most likely due to underestimation of the cavity blockage in the calculations. Single passage RANS calculations cannot capture the coupling between cavities on adjacent passages. The results suggest that the average cavity size in the CFD is smaller than in the experiment where ABC is observed. Nevertheless simulations yield good agreement of the head fall off point with the experiments.
Figure 6 Non-cavitating total-to-static head coefficient of
MIT inducer – Measurements of three campaigns show good agreement with computations.
Figure 7 Cavitating knee curve at low flow coefficients –
numerical predictions are within 1% of the experimental measurements.
Figure 8 Cavitating knee curve at 0.082 flow coefficient.
0 0.1 0.2 0.3 0.4 0.5 0.02 0.04 0.06 0.08 0.1 Head Coefficient ψt-s Flow Coefficient φ Experiment Computation 0.2 0.4 0.6 0.8 1 1.2 1.4 0 0.05 0.1 0.15 0.2 0.25 0.3 0.35 Head Coefficient ψ / ψnon cav Cavitation Number σ φ=0.055 DO=144 ppb Computation φ=0.055 0.2 0.4 0.6 0.8 1 1.2 1.4 0 0.05 0.1 0.15 0.2 0.25 0.3 0.35 Head Coefficient ψ / ψnon cav Cavitation Number σ DO=162 ppb DO=184 ppb DO=375 ppb DO=635 ppb Computation
2.2 Dynamic Behavior
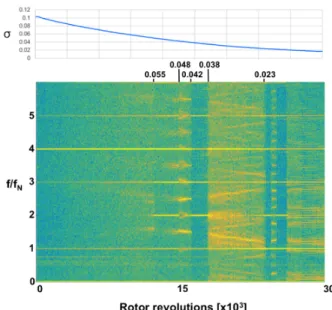
The inducer dynamic behavior is characterized during a cavitation ramp test using the circumferential array of 7 dynamic pressure transducers located near the leading edge of the inducer. The cavitation ramp tests are conducted in a manner similar to the suction performance tests. Typically, the system pressure is slowly and continuously ramped down over the target cavitation number range while simultaneously acquiring dynamic data. During the pressure ramp, adjustments are made to the boost pump and/or flow control valve to maintain a constant flow coefficient. Figure 9 shows the spectrogram of a single sensor over a range of cavitation numbers. Alternate blade cavitation (ABC) appears at σ=0.055 at 2 times the rotor frequency and is observed for cavitation numbers as low as σ=0.048 when the breakdown of ABC initiates rotating cavitation (RC). RC is then observed down to σ=0.042 when ABC reappears. The cut-off of ABC at σ=0.038 leads again to RC, but this time the perturbations are less prominent. A complex spectral pattern is observed in this region as a result of modulation of the fundamental RC mode at 1.5 times the rotor frequency and its harmonics with blade-passage frequencies. RC is first observed at about 1.6 times rotor frequency. The frequency of RC decreases with cavitation number to 1.2 times rotor frequency. This is consistent with typical values observed in literature [1, 4, 18]. At cavitation numbers below 0.025 the dynamic behavior is dominated by in-plane oscillations that become more prominent below σ=0.018 where cavitation surge (CS) is observed. A faint signature is observed at 1.23N at cavitation numbers as low as 0.018, but this signal is most likely a complex mode excited by the interaction of the main surge component at 0.23N and the rotor frequency and it is not associated with rotating cavitation. The inducer dynamic behavior is summarized in the corresponding knee curve in Fig. 2.
4. Characterization of Alternate Blade
Cavitation and Rotating Cavitation
Spatial Fourier decomposition of the unsteady inlet pressure measurements is applied to define the direction of rotation and the spatial harmonic content (i.e number of cavities) that characterizes alternate blade cavitation (ABC) and rotating cavitation (RC). The spatial Fourier decomposition is determined via a (pseudo) Inverse Discrete Fourier Transform of the signals; the spectrum of the decomposed signal is defined as the difference between the positive and negative frequency spectra of the pressure measurements. As such peaks and valleys in the n-th spatial harmonic spectrogram indicate respectively forward and backward travel of n-th
spatial harmonic waves. The first and second spatial harmonics associated respectively with RC and ABC are shown in Figure 10.
Figure 9 Spectrogram of inducer cavitation ramp at
ϕ=0.083 showing ABC and RC signatures.
The positive first spatial harmonic spectrum at cavitation numbers between 0.035 and 0.045 indicates strong forward rotating cavity. A supersynchronous cavity is also observed at 1.6N for σ<0.05, with frequency decreasing with cavitation number to 1.2 N for σ=0.025. The second spatial harmonic Fourier coefficient for the same time window indicates that the dynamic behavior yields also activity at 2N, which is associated with ABC. The onset time of RC corresponds to the end of ABC, with a clear cut-off/cut-on behavior as indicated in the figure.
This information is used to investigate the underlying mechanisms of rotating cavitation instability through high-speed videos. In the case of side-view videos, optical access to the inducer is obtained through a transparent casing. High speed videos of the cavitating inducer are taken with a Photron Fastcam-x 1024 PCI digital video camera equipped with a Sigma EXDG 20mm fixed focal length 1:1.8D lens. The camera is positioned on one side of the inducer. A precise combination of lens aperture, camera shutter speed, and lighting are critical to the successful acquisition of high-speed video in rotating machinery. Video lighting was provided by a combination front and back lighting from high intensity LED sources from Visual Instrumentation. The primary illumination was provided by backlighting from a 24-element LED array, which was diffused through 2 layers of semi-opaque paper. Six 3-element LED spotlights provided fill-in front lighting of the inducer hub and blades. Videos
were taken at frame rates of 2000 and 6000 fps. The water flowrate was measured using an electromagnetic flowmeter and maintained constant during the video acquisition. For the frontal-view experiments, high speed video was taken through a borescope. The camera used was a Photron FASTCAM Mini AX200. The video camera was coupled to a custom borescope manufactured by Cortek Endoscopy to enable a head-on view of the inducer. The inducer was illuminated through the aforementioned transparent casing using the same LED array. Videos were taken at 3000 fps with 331 µsec shutter speed.
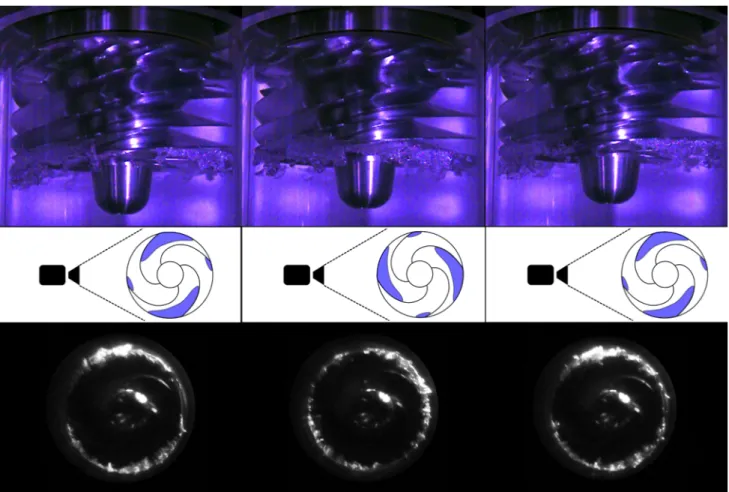
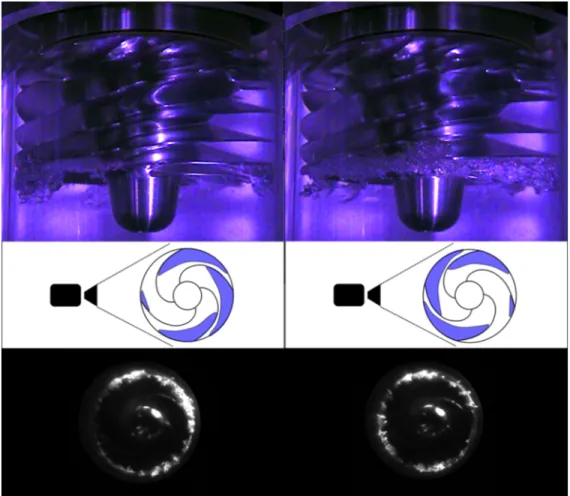
Figure 11 shows ABC in the MIT inducer. The pictures are taken at instants 1/4 of rotor revolution apart and show the cavity behavior in three consecutive passages. Note that the borescope and side video images were not recorded simultaneously and were synched through post processing of videos obtained from separate tests at the same flow coefficient and cavitation number. The second spatial harmonic signature that was observed by the spatial Fourier decomposition is caused by the pattern of alternate small and large cavities. The cavities are locked to the inducer and are stable. As the pressure is lowered the cavity size increases until RC occurs, shown in Fig. 12. A tip vortex cavity is observed forming upstream of the LE of one of the blades with a large cavity (Fig. 13). Subsequent observations reveal rotating cavitation, as shown in Fig. 12. These sequences of images reveal a large cavity that covers three blade passages, with the remaining passage nearly cavitation-free. Careful examination of the high-speed footage reveals a periodic pulsation of the cavities, such that the small cavity grows and the large cavity of the blade immediately upstream collapses. This yields the apparent super-synchronous rotation that was described in Section 1.
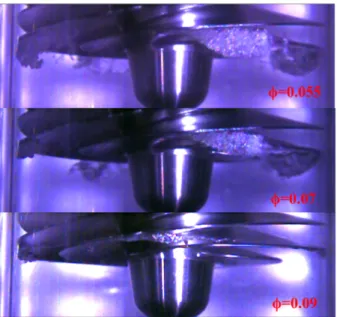
The tip vortex behavior is further investigated at different flow coefficients. The cavitation number is increased to 0.1 to reduce the amount of cavitation at the inlet and allow for a clean picture of the tip vortex cavity. Figure 14 shows the tip vortex cavity behavior at ϕ=0.055, 0.07 and 0.09. At low flow coefficients the tip vortex travels upstream of the inducer, yielding no interaction with adjacent blades. As the flow coefficient is increased, the intensity of tip clearance flow decreases due to the reduced blade loading and the vortex trajectory becomes more tangential. At ϕ=0.09 the tip vortex
is observed close to the blade and is ingested into the blade passage. Figure 15 shows the tip vortex trajectory at ϕ=0.082, for which rotating cavitation (RC) was observed. The LE of the blade can be identified by looking at the cavity and should not be confused with the base of the adjacent blade, which is also visible due to the large backsweep of the LE. At these conditions, the trajectory is tangential and the vortex interacts with the adjacent blade. When the vortex lines wrap round the LE of the blade, the vorticity intensifies and the pressure drops, leading to cavitation. The bottom picture in Fig. 15 highlights the formation of the tip vortex cavity upstream of the adjacent blade. This is also schematically shown in Fig. 16. The increase in blockage caused by tip vortex cavitation leads to increased incidence and cavity sheet breakoff that was not observed at ϕ=0.055, 0.07 and 0.09.
These findings are supported by the analysis of the flow in numerical calculations. The tip vortex trajectory from the calculation is visualized through iso-surfaces of Q-criterion in Fig 17. The pressure-driven tip cavity flow rolls up upstream of the inducer and generates the tip vortex. The strength of the tip gap flow determines the upstream position of the tip vortex. At low flow coefficient the high positive incidence of the inducer blades yields increased blade loading and stronger backflow with the blade tip vortex moved upstream and away from the adjacent blade. At high flow coefficient the reduced incidence unloads the blade and reduces the distance between the blade tip vortex and the adjacent blade leading edge (LE). At even higher flow coefficient the near zero or negative incidence further reduces the tip gap flow and the tip vortex is ingested in the passage, without any interaction with the neighboring blades (not shown here).
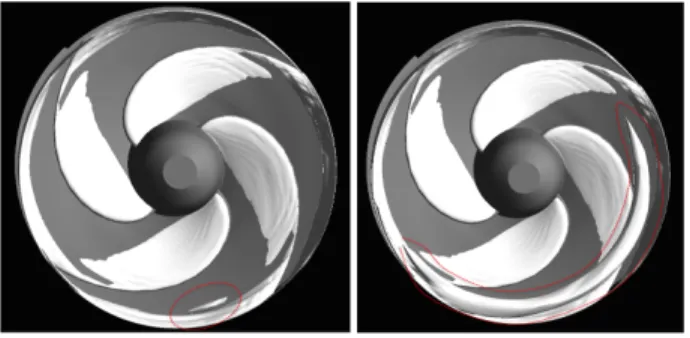
Unsteady calculations are next conducted at ϕ=0.083 and σ=0.045 for 8 rotor revolutions and capture the formation and growth of the tip vortex cavity, illustrated in Fig. 18. The growth and collapse of the blade cavities lead to the oscillation of the tip vortex that moves close to the LE of the adjacent blade. The reduced pressure caused by the interaction of the tip vortex with the LE of the blade leads to the formation of the cavity, which rapidly expands filling the entire vortex. A red dashed circle is used in the figure to highlight the formation and growth of the tip vortex cavity. The tip vortex cavity causes an increase of the incidence for the adjacent blade and the growth of the blade cavity.
Figure 10 Comparison of first and second harmonic evolution indicating cut-on/cut-off behavior between ABC and RC.
Figure 11 Side-view and borescope images of Alternate Blade Cavitation of MIT inducer. Side-view images are taken at ϕ=0.082 and σ~0.039.
Borescope images are taken at the same flow coefficient and comparable cavitation numbers: pictures taken at 1/4 of rotor revolution apart showing the alternate cavities on blades.
Figure 12 Side-view and borescope images of Rotating Cavitation of MIT inducer. Side-view images are taken at ϕ=0.082 and σ~0.037, borescope
images are taken at the same flow coefficient and comparable cavitation numbers: pictures taken at 1/2 of rotor revolution apart showing the cavity layout.
Figure 13 Tip vortex cavity observed near LE of one of the
cavitating blades during ABC into RC transition at ϕ=0.082 and σ estimated between 0.039 and 0.037.
Figure 14 Tip vortex cavity behavior at σ=0.1 and different flow
coefficients.
Figure 15 Tip vortex cavity behavior at ϕ=0.082 corresponding to
RC.
Figure 16 Tip vortex trajectories – isometric view, the cavity
formation upstream of the blade is marked in red.
Figure 17 Isosurface of Q-Criterion in single-phase CFD illustrating
the behavior of the blade tip vortex at different flow coefficients. As the perturbation travels around the circumference a single large cavity forms that rotates at higher super-synchronous frequency. This mechanism is similar to that of propagation of RC described in section 1 of this paper. However, it was not possible in the simulations to capture the transition from ABC to RC. It is conjectured that the absence of asymmetries in the URANS calculations prevents the formation of ABC. In the experiment, small manufacturing imperfections or asymmetric tip clearances yield different blade loading among the passages that can result in the alternate cavities pattern. Furthermore, the absence of non-cavitating passages in the calculations leads to a different tip vortex trajectory, which is pushed further upstream, delaying the interaction with adjacent blades. Nevertheless, the results are encouraging and suggest that the tip vortex cavity plays an important role in the onset of the instability. The trajectory of the tip vortex can indicate when strong coupling of the cavities dynamics can occur. Further simulations will be conducted introducing asymmetries in the geometry or by using source terms in the momentum equations to model the effect of non-uniform tip gap to be
validated against flow visualizations.
Figure 18 Formation and growth of tip vortex cavity from full
annulus unsteady cavitating calculations at ϕ=0.083 and σ=0.045.
5. Conclusions
This paper characterizes through experiment and computation the dynamic behavior of a four bladed inducer and clarifies the physical mechanism of rotating cavitation (RC). It is hypothesized that RC is generated by the breakdown of alternate blade cavitation (ABC) caused by the interaction of the tip vortex cavity of the non-cavitating blades with the adjacent blade passages. The major outcomes can be summarized as follows:
1. Experimental measurements demonstrate a super- synchronous rotating cavity in the periphery of the inducer inlet at frequencies between 1.2 and 1.6 times rotor frequency. The Spatial Fourier decomposition identifies a 1st spatial harmonic oscillation at frequencies between 1.2 and 1.6 times rotor frequency corresponding to RC, and a 2nd spatial harmonic pattern associated with ABC. The analysis indicates a causal link between ABC and RC, with a distinct cut-on/cut-off behavior.
2. Optical observations are conducted at selected ranges of flow coefficients and cavitation numbers to investigate the root cause of RC and corroborate the observations of the Fourier spatial decomposition analysis. The formation of the tip vortex cavity upstream of the blade LE is observed at flow coefficients and cavitation numbers at which RC was encountered. The observed cavity behavior is consistent with that inferred through spatial harmonic analysis of measured unsteady pressure data. The present analysis indicates that the tip vortex cavity interaction with the adjacent blade is either responsible for RC or could be used as an indication of the ranges of flow coefficient and cavitation numbers at which strong coupling among the passages can lead to the instability. 3. Numerical computations are validated with experimental data. The inducer non-cavitating performance agrees with
experiments within 0.5% while the cavitating performance is within 1% of the experiment at low flow coefficient. Two-phase calculations are less accurate at high flow coefficient, with discrepancy up to 40%. The internal flow analysis of steady and unsteady calculations confirms the role of the tip vortex cavity in the onset and propagation of the instability and verifies the hypothesized mechanism.
Acknowledgements
This research was funded by NASA Marshall Space Flight Center, which is gratefully acknowledged. In particular, the authors would like to thank Professor Christopher Brennen, Dr. Andrew Mulder, Dr. Tom Zoladz and Jay Schwille for providing data and support. The authors gratefully acknowledge the contributions made by several individuals during many discussions on the topics described in this paper, including Professor Yoshinobu Tsujimoto, Professor Nick Cumpsty and Professor Yutaka Kawata.
References
[1] Wu, Yulin, et al., “Vibration of hydraulic machinery”.
Berlin: Springer, 2013.
[2] Tsujimoto, Y., “Simple Rules for Cavitation Instabilities in Turbomachinery”, Fourth International Symposium on
Cavitation,Pasadena, CA, June 20-23, 2001. http://caltechconf.library.caltech.edu/118/.
[3] Iga, Y. and Yoshida, Y., “Mechanism of Propagation Direction of Rotating Cavitations in a Cascade”, Journal
of Propulsion and Power, Vol. 27, No. 3, 2011, pp. 675-683. doi: 10.2514/1.49454
[4] Kamijo, K., Yoshida, M., and Tsujimoto, Y., “Hydraulic and Mechanical Performance of LE- 7 LOX Pump Inducer,” AIAA Journal of Propulsion and Power, Vol. 9,
No. 6, pp. 819-826, 1993. doi: 10.2514/3.23695
[5] Young, W. E., Murphy, R. and Reddecliff, J., “Study of Cavitating Inducer Instabilities,” Final Report; 1 Jul. 1971
- 15 May 1972, NASA-CD-123939. NASA-CR-123939, PWA-FR-5131
[6] Ryan, R. S., Gross, L. A., Mills, D. and Mitchell, P., “The Space Shuttle Main Engine Liquid Oxygen Pump High-Synchronous Vibration Issue, the Problem, the Resolution Approach, the Solution,” AIAA-94-3153, AIAA,
1994.
[7] Goirand, B., Mertiz, A,L., Joussellin, F. and Rebattet, C., “Experimental Investigations of Radial Loads Induced by partial Cavitation with a Liquid Hydrogen Inducer,”
ImechE, C453/056, pp.263-269, 1992.
Cavitating Turbopumps”, SpringerWien, New York 2007. [9] Tsujimoto, Y., “Cavitation Instabilities in Inducers.” In Design and Analysis of High Speed Pumps pp. 8-1 – 8-26. 2006 http://www.rto.nato.int/abstracts.asp.
[10] Hashimoto, T., Yoshida, M., Watanabe, M., Kamijo, M. and Tsujimoto, Y., “Experimental Study on Rotating Cavitation of Rocket Propellant Pump Inducers”, Journal
of Propulsion and Power, Vol. 13, No. 4, 1997, pp. 488-494. doi: 10.2514/2.5210
[11] Tani, N., Yamanishi, N., and Tsujimoto, Y., “Influence of Flow Coefficient and Flow Structure on Rotational Cavitation in Inducer”, ASME Journal of Fluids
Engineering., Vol. 134 , No. 2, 2012, pp. 21-30.
doi:10.1115/1.4005903
[12] Watanabe, S., Sato, K., and Tsujimoto, Y., “Analysis of Rotating Cavitation in a Finite Pitch Cascade Using a Closed Cavity Model and a Singularity Method”, Journal
Fluids Engineering, Vol. 121, No. 4, 1999, pp. 834-840.
doi:10.1115/1.2823544
[13] Kimura, T., Yoshida, Y., Hashimoto, T. and Shimagaki, M., “Numerical Simulation for Vortex Structure in a Turbopump Inducer: Close Relationship with Appearance of Cavitation Instabilities” ASME Journal of Fluids
Engineering, Vol. 130, No.5, 05104, 2008. doi:10.1115/1.2911678
[14] Tsujimoto, Y., Yoshida, Y., Maekawa, Y., Watanabe, S. and Hashimoto, T., “Observations of Oscillating Cavitation in an Inducer”, Journal of Fluids Engineering.,
Vol. 119, No.4, pp.775-781, 1997. doi:10.1115/1.2819497
[15] Kang, D., Yonezawa, K., Horiguchi, H., Kawata, Y. and Tsujimoto, Y., “Cause of Cavitation Instabilities in Three Dimensional Inducer”, International Journal of Fluid
Machinery and Systems, Vol. 2, No. 3, 2009, pp.206-214.
[16] Cervone, A., Bramanti, C., Torre, L., Fotino, D. and d’ Agostino, L., “Setup of High Speed Optical System for the Characterization of Flow Instabilities Generated by Cavitation”, Journal of Fluid Engineering, Vol. 129, 2007,
pp. 877-885. doi:10.1115/1.2742738
[17] Zoladz, T., “Overview of Rotating Cavitation and Cavitation Surge in the Fastrac Engine LOX Turbopump”,
NASA George C. Marshall Space Flight Center Huntsville Alabama USA.
[18] Brennen., C., “Hydrodynamics of Pumps”, Concepts ETI
Inc. and Oxford University Press, Oxford, 1994, pp. 123-163.
[19] Braisted D.M., “Cavitation Induced Instabilities Associated with Turbomachines”, Report No. E184.2
Division of Engineering and Applied Science California Institute of Technology, September 1979. NASA contract NAS 8-293113.
[20] ANSYS Academic Research, Release 14.5, Theory Manual, ANSYS, Inc, 2011, Canonsburg, PA
[21] Ehrlich, D. A., Schwille, J. A., Murdock, J., Welle, R., and Hardy, B., “A Water Test Facility for Liquid Rocket Engine Turbopump Cavitation Testing,” Proceedings of
the 7th International Symposium on Cavitation, Ann Arbor,
Michigan, August 2009.
[22] Ehrlich, D. A., and Schwille, J. A., “Development and Validation of Turbopump Cavitation Tools Part 1: High Fidelity Inducer Testing,” 6Th JANNAF Liquid Propulsion
Subcommittee Meeting, , AIAA, Washington, DC, 2011, pp. 103-115.
[23] Lettieri, C., Spakovszky, Z. “Origin of Rotating Cavitation in Four Bladed Turbopump Inducers”, Journal