BROWN DWARFS IN YOUNG MOVING GROUPS
FROM PAN-STARRS1. I. AB DORADUS
The MIT Faculty has made this article openly available. Please share
how this access benefits you. Your story matters.
Citation
Aller, Kimberly M., Michael C. Liu, Eugene A. Magnier, William M. J.
Best, Michael C. Kotson, William S. Burgett, Kenneth C. Chambers,
et al. “BROWN DWARFS IN YOUNG MOVING GROUPS FROM
PAN-STARRS1. I. AB DORADUS.” The Astrophysical Journal vol. 821, no.
2, 120, April 2016, pp. 1-30.
As Published
http://dx.doi.org/10.3847/0004-637X/821/2/120
Publisher
Institute of Physics Publishing (IOP)
Version
Final published version
Citable link
http://hdl.handle.net/1721.1/104865
Terms of Use
Article is made available in accordance with the publisher's
policy and may be subject to US copyright law. Please refer to the
publisher's site for terms of use.
BROWN DWARFS IN YOUNG MOVING GROUPS FROM PAN-STARRS1. I. AB DORADUS
Kimberly M. Aller1,4, Michael C. Liu1, Eugene A. Magnier1, William M. J. Best1, Michael C. Kotson1,2, William S. Burgett1, Kenneth C. Chambers1, Klaus W. Hodapp1, Heather Flewelling1, Nick Kaiser1, Nigel Metcalf3,
John L. Tonry1, Richard J. Wainscoat1, and Christopher Waters1 1
University of Hawaii, Institute of Astronomy, 2860 Woodlawn Drive, Honolulu, HI 96822, USA 2
Lincoln Laboratory, Massachusetts Institute of Technology, USA 3
Department of Physics, Durham University, South Road, Durham DH1 3LE, UK Received 2015 January 25; accepted 2016 March 9; published 2016 April 20
ABSTRACT
Substellar members of young(150 Myr) moving groups are valuable benchmarks to empirically define brown dwarf evolution with age and to study the low-mass end of the initial mass function. We have combined Pan-STARRS1(PS1) proper motions with optical–IR photometry from PS1, Two Micron All Sky Survey (2MASS), and WISE to search for substellar members of the ABDor Moving Group within ≈50 pc and with spectral types of late M to early L, corresponding to masses down to≈30 MJupat the age of the group(≈125 Myr). Including both photometry and proper motions allows us to better select candidates by excludingfield dwarfs whose colors are similar to young ABDor Moving Group members. Our near-IR spectroscopy has identified six ultracool dwarfs (M6–L4; ≈30–100 MJup) with intermediate surface gravities (INT-G) as candidate members of the ABDor Moving Group. We find another two candidate members with spectra showing hints of youth but consistent with field gravities. We alsofind four field brown dwarfs unassociated with the ABDor Moving Group, three of which have
INT-Ggravity classification. While signatures of youth are present in the spectra of our ≈125 Myr objects, neither
their J– K nor W1 – W2 colors are significantly redder than field dwarfs with the same spectral types, unlike younger ultracool dwarfs. We also determined PS1 parallaxes for eight of our candidates and one previously identified ABDor Moving Group candidate. Although radial velocities (and parallaxes, for some) are still needed to fully assess membership, these new objects provide valuable insight into the spectral characteristics and evolution of young brown dwarfs.
Key words: brown dwarfs – stars: low-mass
1. INTRODUCTION
Young moving groups (YMGs) are coeval associations of stars with similar space motions and with ages ranging from ∼10 to 100 Myr. It is believed that these groups have left their natal molecular cloud after formation and dispersed into the field (Zuckerman & Song2004). As such, YMGs link stars in
molecular clouds (∼1 Myr) to field stars (1 Gyr) no longer affiliated with their birth sites. Thus, YMGs are valuable laboratories for studying recent star formation in the solar neighborhood. Because of the proximity of the known YMGs (100 pc), they are ideal candidates for characterizing the initial mass function (IMF) down to substellar masses. Although substellar objects are generally very faint, younger brown dwarfs are more luminous (Chabrier et al. 2000) and
thus more readily detected.
Characterization of young brown dwarfs and directly imaged planets has revealed that their spectral properties differ from those of their oldfield counterparts (e.g., Chauvin et al.2005; Marois et al. 2008; Bowler et al. 2010, 2013; Patience et al. 2010). Young brown dwarfs have redder near-IR (NIR)
colors and have spectra distinct from field objects. Studies of brown dwarfs in young clusters and moving groups have begun to delineate the brown dwarf spectral evolution, due to the lower surface gravity of younger objects (e.g., Allers et al.
2007; Allers & Liu2013). In order to further characterize this
evolution, we need to identify a larger sample of substellar objects at various young ages(∼10–100 Myr). Determining the substellar spectral sequence in YMGs with different ages would be a key step toward better understanding substellar evolution and benchmarking spectral indicators of youth.
The ABDoradus (AB Dor) Moving Group was first recognized as a sparse, comoving group of stars in the Local Association by Zuckerman et al.(2004). The age estimates for
the ABDor Moving Group vary substantially depending on the method, ranging from 50 to 150 Myr. Initially, Zuckerman et al. (2004) estimated an age of ∼50 Myr from color–
magnitude diagrams. Analysis using evolutionary tracks and dynamical masses to study ABDorC, a member of a quadruple system in the ABDor Moving Group, yielded an age for the system of∼75 Myr (Close et al. 2007). However,
color–magnitude diagram comparisons of the lower-mass ABDor Moving Group members with the Pleiades (≈125 Myr; e.g., Basri et al. 1996; Martín et al. 1998) and
IC2391 (∼35–50 Myr; e.g., Barrado y Navascués et al.1999,2004) suggested that the ABDor Moving Group
is roughly coeval with the Pleiades and older than IC2391 (Luhman et al.2005). Traceback of the ABDor Moving Group
kinematics has also concluded that the group and the Pleiades likely formed from the same large-scale star formation event and thus should be nearly the same age (Luhman et al.2005; Ortega et al. 2007). By combining chemical and kinematic
analysis of the ABDor Moving Group members, Barenfeld et al. (2013) have also constrained the group to be
approximately the age of the Pleiades with a lower age limit of 110 Myr.
© 2016. The American Astronomical Society. All rights reserved.
4
Visiting Astronomer at the Infrared Telescope Facility, which is operated by the University of Hawaii under Cooperative Agreement no. NNX-08AE38A with the National Aeronautics and Space Administration, Science Mission Directorate, Planetary Astronomy Program.
Currently, the ABDor Moving Group has one of the largest number of stellar members of the known YMGs, with ≈50 confirmed members with parallaxes (Zuckerman & Song2004; Torres et al.2008; Zuckerman et al.2011). However, the lack
of low-mass stars (0.5 Me) in the known membership has prompted several recent surveys aimed at discovering these missing members. By using photometry and/or kinematics, several additional low-mass stellar candidate members(late K– mid-M dwarfs; ∼0.1–0.5 Me) have emerged (e.g., Shkolnik et al.2009; Schlieder et al.2012; Malo et al.2013). However,
these surveys were less sensitive to the cooler, fainter substellar members. Currently, only CD-352722B (L3; Wahhaj et al. 2011), 2MASSJ1425–3650 (L4; Gagné et al. 2015c),
2MASSJ0355+1133 (L5; Faherty et al. 2013; Liu et al.
2013a), WISEPJ0047+6803 (L7; Gizis et al. 2015), and
SDSSJ1110+0116 (T5.5; Gagné et al. 2015a) have been
confirmed as bona fide substellar members of the ABDor Moving Group. Gagné et al. (2014, 2015c) have begun a
systematic search to identify lower-mass stellar and substellar candidate members using Bayesian inference to calculate their YMG membership probabilities from proper motion, photo-metry, and, if available, radial velocities and distances.
In order to further the search for substellar YMG members, we are conducting a deep, wide-field search based on optical imaging data from Pan-STARRS1. Pan-STARRS1 (PS1) is a multiwavelength, multiepoch, optical imaging survey that covers ≈75% of the sky. PS1 goes ∼1 mag fainter than the Sloan Digital Sky Survey (SDSS) in the z band (York et al. 2000). Also, PS1 has a novel yP1(0.918–1.001 μm)
filter, which extends the wavelength coverage further into the NIR than past optical surveys, such as SDSS. Compared to previous optical surveys, the PS1 red opticalfilters, zP1and yP1,
allow for more sensitivity and better characterization at redder wavelengths, both of which are advantageous for identifying substellar objects. We also combine PS1 and Two Micron All Sky Survey (2MASS) astrometry to compute proper motions for our search(the addition of 2MASS astrometry increases our time baseline by a factor of ∼3). Precise proper motions significantly increase our ability to distinguish faint, substellar candidate ABDor Moving Group members from field interlopers.
We use 2MASS, PS1, and WISE to select substellar ABDor Moving Group candidates. In Section 2 we discuss the PS1 photometry and proper-motion precision and the addition of 2MASS and WISE data. In Section 3 we describe our search method, which uses photometrically determined spectral types and proper-motion analysis to select candidates. In Section 4
we describe our spectroscopic follow-up and reduction. In Section 5 we determine spectral types, determine parallactic and photometric distances, assess the youth of our candidates, consider their membership in the ABDor Moving Group, and estimate their physical properties. Our discussion is in Section 6, and our conclusions are in Section7.
2. SURVEY DATA
PS1 is a 1.8 m, wide-field telescope located on Haleakalā on the island of Maui. The PS1 3πSurvey covers the sky north of −30° decl., ≈75% of the sky. The survey’s five optical filters,
gP1, rP1, iP1, zP1, and yP1, are described in Stubbs et al.(2010)
and Tonry et al.(2012). At each epoch a single field is exposed
for 60 s in gP1, 38 s in rP1, and 30 s in iP1, zP1, and yP1. The
photometry and astrometry from each epoch have been combined to obtain average magnitudes and proper motions.
We used data from the PS1 3π survey (which began in 2010) to construct spectral energy distributions(SEDs) and determine proper motions of our candidates. We chose good-quality data according to the photometric quality flags set in the PS1 Desktop Virtual Observatory(DVO) database (Magnier2006).
Specifically, we select objects characterized by all of the following attributes: fits a point-spread function (PSF) model (not extended), is not saturated, has good sky measurement, is not likely a cosmic ray, a diffraction spike, a ghost, or a glint, does not lie between the image chips(i.e., to choose yP1data we require (yP1:flags & 0x0000.0300)!=0 and (yP1:flags & 0x0000.1000)=0), and has the quality flag psf_qf 0.9 to ensure that at least 90% of the object is unmasked. Furthermore, we require objects to be detected at least twice in a single night in at least one of thefive filters (gP1, rP1, iP1, zP1,
yP1) to remove potential spurious sources that would only
appear as single detections. Finally, we require that a single bandpass measurement error be0.1 mag in order to use that bandpass.
We then matched PS1 objects with their 2MASS counter-parts using the 2MASS Point Source Catalog (Skrutskie et al. 2006). We chose good J, H, and K photometry based
on the following requirements: measurement error 0.2 mag and cc_flg=0 (i.e., no confusion). We also matched PS1 objects with their WISE counterparts from the WISE Point Source Catalog(Wright et al.2010), which was available when
we began our search. We chose objects with good photometry in W1 and W2 with measurement errors 0.2 mag and cc_flg=0 (i.e., no confusion). The final WISE photometry for our objects presented here is from the updated AllWISE Catalog(Kirkpatrick et al.2014), which was released after our
initial search.
We also used astrometric data from PS1 and 2MASS. The PS1 proper motions have a 2–3 yr time baseline. To increase the time baseline from 2–3 yr to ∼10 yr, we combined astrometry from PS1 and 2MASS. For our data set, the typical 2MASS astrometric uncertainties are≈70 mas, far larger than our typical PS1 uncertainties of ≈15 mas. By extending our time baseline, we improved our typical proper-motion precision from≈7 mas yr−1to≈5 mas yr−1.
When calculating the proper motion for our objects, we used an outlier-resistant fitting method that calculates bisquare weights (Tukey’s biweight) and iteratively fits the data to minimize the residuals. This method reduces the effects that potentially spurious data points have on our final proper-motionfit. We determined our proper-motion uncertainties by using bootstrap resampling of our data. We discuss the quality of our PS1+2MASS proper motions in theAppendix.
Finally, we constructed an initial catalog of objects with good-quality PS1+2MASS+WISE photometry and PS1 +2MASS proper motions signal-to-noise ratio (S/N) 10, corresponding to a typical proper motion of 140 mas yr−1. Although by requiring the proper motions to have a high S/N we will miss slower-moving candidate members, only ≈13% of the confirmed ABDor Moving Group members tabulated in Malo et al. (2013) have proper motions below 140 mas yr−1
and are within 50 pc (the approximate photometric distance limit of our search).
2
3. CANDIDATE SELECTION
After combining PS1, 2MASS, and WISE photometry to create an initial catalog of objects with good-quality proper motions and photometry (Section 2), we screened our initial
catalog for probable late M and L dwarfs using the following color cuts: y− J 1.4, z − y 0.5, and W1 − W2 0. In addition, we selected for objects with iP1– zP1 0.9 if the
iP1photometry met our quality requirements (Section 2). In
order to remove potential galaxies from our sample, we chose objects withW2-W33(Wright et al.2010).
Next, we constructed SEDs and estimated spectral types and photometric distances using the template-fitting method of Aller et al.(2013). We first created template SEDs from known
ultracool dwarfs with spectral types of M and L based on the compilations by Kraus & Hillenbrand (2007), Faherty et al.
(2009), Leggett et al. (2010), and DwarfArchives.org. Then we
estimated the spectral type of our candidates by determining the best-matched template SED using a chi-squared fit. Our estimated photometric distances (dphot) were based on the Dupuy & Liu(2012) average J2MASSabsolute magnitudes as a function of spectral type (Section 5.2). We required our
candidates to have estimated spectral types from our SED fit later than M5, which corresponds to the stellar/substellar boundary at the age of the ABDor Moving Group.
In addition, we limited our search to candidates with proper motions between 40 and 1000 mas yr−1. The lower proper-motion limit is set because we only chose candidates with proper motion S/N 10 and our minimum proper-motion uncertainty was≈4 mas yr−1. Also, because we only matched PS1 sources with 2MASS counterparts within a 10″ radius, our proper-motion upper limit was approximately 1000 mas yr−1.
Because moving group members have space motions with a common characteristic direction and amplitude, we further refined our candidate selection using proper motion and sky position. Following Schlieder et al. (2012), we screened for
candidates with space motions consistent with the ABDor Moving Group. Specifically, we used proper motions to calculate the angle (θ) projected onto the plane of the sky between our candidates’ proper motions and the average space motion vector of the known members of the ABDor Moving Group(Torres et al.2008). We also determined the kinematic
distance (dkin), namely, a candidate’s distance if it were a member of the ABDor Moving Group with the same absolute proper-motion velocity(i.e., velocity in km s−1) as the average of the known members. In order to determine our selection criteria, we calculatedθ and dkinfor the known members of the ABDor Moving Group with parallaxes from Torres et al. (2008) and determined that these members mainly have
θ40° (Figure 1). In addition, the 1σ distance range for
known ABDor Moving Group members is within 50 pc (Gagné et al. 2014). Therefore, we required our candidate
ABDor Moving Group members to have q-stheta40° and
s
-dkin dkin50 pc. Finally, we also chose objects with dphot
less than 50 pc(dphot-sdphot50 pc) and consistent with their
dkinwithin the uncertainties in both dkinand dphot. We allowed the dphot to vary within 50% to allow for uncertainties in determining photometric distance and in the absolute magni-tudes of our candidates based on estimated spectral type.
In addition to photometric and kinematic information, we limited our search for ABDor Moving Group members by sky positions. Based on the positions of known members, all candidates were selected to have Galactic latitude below 60°
and declinations below 70°. We also ignored objects within 3° of the Galactic plane because of crowding.
Given the photometric distance limit of our search, we could detect objects with spectral types of ≈L4 at 50 pc, which corresponds to a mass of ≈30 MJupgiven the age of the ABDor Moving Group. Thus, our search is sensitive to candidate substellar ABDor Moving Group members with masses from the substellar-stellar boundary down to ≈30 MJupout to 50 pc. We tabulate the photometry, proper motions, dphot, dkin, and θ for our new candidate ABDor Moving Group members in Table1.
4. OBSERVATIONS
Field M and L dwarfs have similar colors and are more numerous than M and L dwarf members of the ABDor Moving Group. Therefore, we require spectroscopy to determine whether our candidates are young brown dwarfs and thus potential members of this young (≈125 Myr old) moving group. Young brown dwarfs are spectroscopically distinguishable fromfield ultracool dwarfs because their lower surface gravity affects the depths of absorption lines and the overall continuum shape in the NIR (e.g., Allers et al. 2007; Allers & Liu2013).
Figure 1. The kinematic distance (dkin) and θ for the known ABDor Moving
Group members with membership probability greater than 90% and parallaxes (Torres et al. 2008). We required our candidate ABDor Moving Group members to haveθ40° because the majority of the known members also satisfy this requirement.
Table 1
Observed Properties and Membership
Property
PSOJ004.7
+41 PSOJ035.8–15 PSOJ039.6–21 PSOJ167.1+68 PSOJ232.2+63 PSOJ236.8–16 PSOJ292.9–06 PSOJ306.0+16 PSOJ318.4+35 PSOJ334.2+28 PSOJ351.3–11 PSOJ358.5+22 μαcosδ (mas yr−1) 100.5±4.4 135.1±1.9 95.5±1.5 −221.9±3.1 −125.6±3.4 −70.1±1.5 21.0±2.9 63.5±4.3 109.0±1.9 76.8±26.7 148.8±2.3 97.0±2.1
μδ(mas yr−1) −130.3±1.1 −137.7±2.4 −150.4±4.3 −193.7±3.9 32.5±3.4 −148.9±3.7 −105.7±2.6 −83.0±6.2 −71.0±1.6 −52.6±11.0 −132.3±1.9 −88.3±1.9
μαcosδlita(mas yr−1) 94.2±5.6 147.8±8.8 102±7.3 −238±5.8 −119.7±3.6 −64.1±5.9 L L L L 146.1±6.9 93.5±7.3
μδ,lita(mas yr−1) −138±8.4 −148.8±9 −158.4±9.4 −197.7±8.4 44.5±6.9 −129.6±6.6 L L L L −144.0±6.9 −98.9±8.9 iP1(mag) 18.09±0.01 16.98±0.04 19.12±0.01 17.733±0.005 15.40±0.01 18.42±0.015 17.48±0.01 20.258±0.015 18.91±0.01 21.56±0.08 16.816±0.006 19.74±0.02 zP1(mag) 16.60±0.02 16.00±0.06 17.47±0.06 16.214±0.002 14.06±0.01 16.905±0.002 16.15±0.01 18.843±0.011 17.36±0.01 20.21±0.03 15.7±0.004 18.2±0.02 yP1(mag) 15.80±0.01 15.24±0.06 16.55±0.01 15.211±0.002 13.30±0.01 15.931±0.003 15.43±0.01 17.872±0.0124 16.30±0.01 19.20±0.03 15.1±0.005 17.2±0.02 Jb(mag) 14.10±0.03 14.0±0.02 14.8±0.04 13.12±0.02 11.64±0.02 13.86±0.03 13.86±0.03 15.58±0.06 14.3±0.03 16.84±0.17 13.6±0.02 15.4±0.05 Hb(mag) 13.50±0.03 13.3±0.03 14.2±0.04 12.24±0.02 10.94±0.03 13.24±0.03 13.20±0.02 14.56±0.06 13.4±0.03 15.9±0.2 13.0±0.03 14.6±0.04 Kb(mag) 13.10±0.03 13.0±0.02 13.8±0.05 11.58±0.02 10.55±0.02 12.74±0.03 12.79±0.02 13.98±0.05 12.8±0.03 15.08±0.16 12.7±0.03 14.0±0.05 W1(mag) 12.76±0.02 12.63±0.02 13.43±0.02 11.12±0.02 10.30±0.02 12.43±0.02 12.52±0.02 13.32±0.03 12.23±0.02 14.34±0.03 12.45±0.03 13.63±0.03 W2(mag) 12.45±0.03 12.41±0.02 13.11±0.03 10.76±0.02 10.06±0.02 12.14±0.02 12.29±0.03 12.98±0.03 11.85±0.02 13.89±0.04 12.24±0.03 13.37±0.04 dphot c (pc) 27±4 44±14 (90 ± 30) 26±5 14±3 12±6 (22 ± 11) 26±6 (52 ± 13) 39±8 (80 ± 20) 40±8 29±9 59±12 21±7 (42 ± 15) 38±8 dπ(pc) L 54.6-+9.214 -+ 3769 -+ 22 34 -+ 2833 -+ 2733 L L -+ 3645 L -+ 45 1019 -+ 4368 dstat d (pc) 34.6±2.4 28.9±1.4 26.1±1.6 16.9±1.2 22.5±2.8 37.4±1.8 49.4±2.8 40.2±4.0 28.9±3.0 45.8±5.4 33.3±1.6 46.6±2.8 dkin(pc) 35-+22 -+ 2922 28. -+ 0.7 0.7 -+ 1922 -+ 23.20.60.6 -+ 38.70.90.9 -+ 52.423 -+ 4233 -+ 3033 -+ 5334 -+ 32.91.52 -+ 4522 θ (degrees) 12-+33 2.0-+33 14+-33 4-+44 1.0-+0.71.1 -+ 1.20.91.3 -+ 3.722 4-+34 -+ 323 6-+33 -+ 622 3-+23 Ubest e (km s−1) [−0.3 ± 1.3] [−8.3 ± 1.0] [0.2 ± 1.6] −13.8±2.7f [−13.3 ± 5.2] [−7.8 ± 1.3] [−7.8 ± 2.3] [−6.5 ± 5.0] [−7.4 ± 2.4] [−9.3 ± 6.7] [−14.2 ± 4.4] [−7.3 ± 1.6] Vbest e (km s−1) [−23.2 ± 2.1] [−50.9 ± 10.0] [−34.0 ± 6.2] −28.5±3.4f [−24.5 ± 5.5] [−19.4 ± 2.3] [−23.9 ± 3.4] [−23.9 ± 8.2] [−22.0 ± 13.8] [−24.7 ± 4.2] [−34.4 ± 10.6] [−25.8 ± 3.1] Wbest e (km s−1) [−11.6 ± 2.8] [−10.6 ± 1.9] [−13.2 ± 1.3] −4.4±0.5f [−2.6 ± 5.0] [−11.3 ± 1.0] [−8.5 ± 2.6] [−14.3 ± 4.4] [−18.5 ± 3.5] [−16.0 ± 7.0] [−21.8 ± 6.0] [−11.5 ± 3.0] Δ(v)UVW e (km s−1) [8.6 ± 1.7] [23.6 ± 9.9] [10.0 ± 4.1] 11.2±1.6f [12.4 ± 5.1] [8.7 ± 2.3] [6.6 ± 3.0] [4.5 ± 8.3] [7.4 ± 9.2] [4.4 ± 5.5] [12.1 ± 8.3] [2.5 ± 3.0] dXYZ e (pc) [28.5 ± 3.5] 37.9±9.2 20.1±6.1 35.4±2.0f 50.9±8.5 41.2±2.1 [46.9 ± 6.2] [46.8 ± 6.2] 42.4±4.2 [60.0 ± 11.2] 13.8±2.2 39.5±5.2 PAB Dor 19.19% 49.06% 93.25% 0.23% 36.92 0.25% 6.77%(0%) 42.76% 88.1% 0.63% 50.37% 79.04% Notes. a
The literature proper motion is taken from Gagné et al.(2015c).
b
J, H, and K are 2MASS magnitudes.
c
Properties in parentheses are calculated assuming that the object is overluminous compared with thefield sequence by 1.5 mag. This reflects the systematic uncertainty in the photometric distances for our late Mdwarf candidates.
d
The ABDor Moving Group statistical distances are determined using the BANYANII web tool.
e
The Ubest, Vbest, and Wbestpositions are determined by the RV(between −20 and +20 km s−1) that minimizes the distance between the UVW positions of our candidates and the mean UVW positions of the known
ABDor Moving Group Members with membership probabilities of at least 75% from Torres et al. (2008). The distances, Δ(v)UVWand dXYZ, are the distances between the XYZ and the best-fit UVW position of our
candidates and the mean positions of the known group members. As for all objects, except PSOJ167.1+68f, the values for Ubest, Vbest, Wbest,ΔvUVW, and dXYZ(for objects without parallaxes) are not true measurements;
we have enclosed them in brackets.
f
As PSOJ167.1+68 has an RV from Blake et al. (2010), we use this RV measurement to determine the UVW positions and the ( )D vUVW. Thus, the values are not enclosed in brackets.
4 The Astrophysical Journal, 821:120 (31pp ), 2016 April 20 Aller et al.
We obtained spectroscopic follow-up using SpeX (Rayner et al. 2003), the NIR (0.8–2.5 μm) spectrograph on the 3 m
NASA Infrared Telescope Facility(IRTF) on Mauna Kea. We used the low-resolution (LowRes15) prism mode with a 0 5 slit width (R∼130) for dwarfs with estimated spectral types from SEDfitting later than M8. For earlier Mdwarfs, we used the moderate-resolution cross-dispersed (SXD) mode (R∼750). These resolutions are sufficient to determine spectral type and assess youth using the Allers & Liu (2013)
classification methods. Note that all spectra taken after 2014 August were observed using the upgraded version of SpeX (uSpeX), which has slightly larger wavelength coverage, 0.7–2.5 μm.
We also obtained spectroscopic follow-up using GNIRS, the NIR(0.8–2.5 μm) spectrograph on the 8 m Gemini telescope on Mauna Kea. We used the moderate-resolution (R∼1700) cross-dispersed (SXD) mode with the 32 l mm−1grating with the 0 15/pixel camera and the 0 3 slit.
Our observations were obtained using a standard ABBA nod pattern for sky subtraction. We observed an A0V standard star following each candidate and then took wavelength and flat-field calibrations immediately afterward. All SpeX spectra were reduced using version 3.4(version 4.0 for uSpeX data) of the SpeXtool package(Vacca et al.2003; Cushing et al.2004). We
reduced the GNIRS spectra using a custom version of SpeXtool (Liu et al.2013b). Table2summarizes the observation details.
5. RESULTS 5.1. Spectral Analysis
We determined the NIR spectral type of our objects using both the index-based and visual methods of Allers & Liu (2013). First, the quantitative method combines the
spectral-type sensitive indices from Allers et al. (2007), Slesnick et al.
(2004), and McLean et al. (2003) to calculate the average
spectral type. All of these spectral type indices are valid across the spectral type range of our candidates except the McLean et al. (2003) H2O–D index, which is only valid for L dwarfs. We also performed a Monte Carlo simulation to propagate measurement errors of our reduced spectra into the index calculations in order to determine the spectral type uncertainties derived from each index.
Second, in addition to measuring indices to determine spectral type, we also visually compared our objects to M and Ldwarf spectroscopic standards defined in Kirkpatrick et al.
(2010). We used standard spectra taken from the IRTF Spectral
Library (Cushing et al. 2005) and the SpeX Prism Library.5
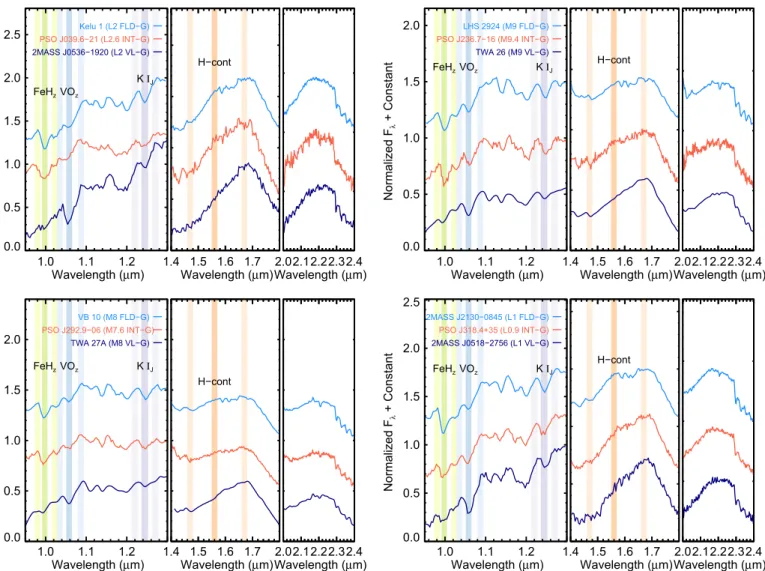
Following the visual classification methods for young and intermediate-age objects of Allers & Liu(2013), we normalize
both our candidates and the standard template in each NIR band separately (see Figure 2 for an example). However, because the H band of young/intermediate-aged brown dwarfs often has a distinctly different shape from old objects, the H band is not used for visual spectral type classification. Because selecting a standard with one subtype difference compared to our best-fitting standard produced a noticeably poorer fit, we assumed an uncertainty of one subtype for our visual classification (consistent with Allers & Liu2013).
Our final spectral type is the weighted mean of the index-based and visual spectral types as in Allers & Liu(2013). As
we use the Allers & Liu (2013) method, we also adopt a
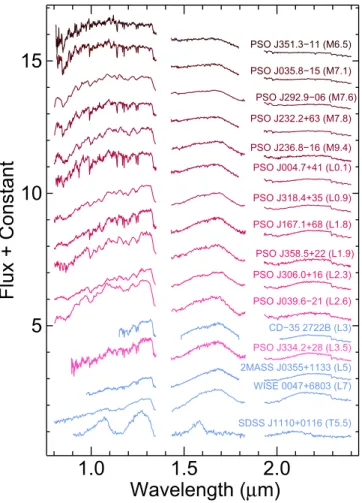
conservative spectral type uncertainty of one subtype. The spectral types for our candidates are tabulated in Table 3. In Figure3we show the spectra of our candidates in addition to the four known brown dwarf members, CD-352722B (Wahhaj et al. 2011), 2MASSJ0355+1133 (Faherty et al.
2013; Liu et al. 2013a), WISEPJ0047+6803 (Gizis
et al.2015), and SDSSJ1101+0116 (Gagné et al.2015a).
We then assessed the gravity classification of our objects using spectral indices defined in Allers & Liu (2013). Under
their classification scheme, several indices are measured in the J and Hbands and then are each assigned a score (0, 1, or 2) according to the index value and the spectral type of the object, with higher numbers indicating lower gravity. These scores are combined into afinal 4-number gravity score that represents the FeH, VO, alkali lines, and H-band continuum indices (e.g., 0110, 2110, etc.). Finally, this gravity score is used to determine the overall gravity classification for the object: field gravity(FLD-G), intermediate gravity (INT-G), or very low gravity
(VL-G). We describe the method in more detail below and also
describe some modifications we have made to account for the modest S/N of some of our spectra.
5.1.1. Gravity Index Calculations and Uncertainties
Depending on the spectral resolution, there is a specific set of gravity indices used to assess the overall gravity classification of an object. The FeHz, VOz, and KIJindices from Allers & Liu (2013) are tailored to assess gravity in low-resolution
Table 2 Spectroscopic Observations
Name R.A.(PS1) Decl.(PS1) Date Texp A0V Standard Setup Telescope Mean S/N
(J2000) (J2000) (UT) (s) ( J, H, K)
PSOJ004.7+41 00:19:07.65 +41:01:23.30 2014 Jan 17 1680 HD23594 prism IRTF 57, 61, 68 PSOJ035.8–15 02:23:28.40 −15:11:37.64 2013 Nov 23 960 HD20911 SXD IRTF 48, 56, 53 PSOJ039.6–21 02:38:32.47 −21:46:28.78 2013 Sep 22 600 HD31506 prism IRTF 33, 30, 30 PSOJ167.1+68 11:08:30.25 +68:30:14.39 2015 Jun 24 956 HD89239 SXD IRTF 65, 86, 102 PSOJ232.2+63 15:29:09.96 +63:12:54.50 2013 Aug 09 180 HD172728 SXD IRTF 167, 171, 184 PSOJ236.8–16 15:47:05.52 −16:26:32.20 2015 Jan 28 87.6 HD133569 prism IRTF 59, 53, 40 PSOJ292.9–06 19:31:44.93 −06:20:48.91 2015 Sep 25 59.8 HD190454 prism IRTF 160, 134, 124 PSOJ306.0+16 20:24:03.05 +16:47:49.09 2015 Jul 15 717.3 HD192538 prism IRTF 75, 75, 80 PSOJ318.4+35 21:13:41.83 +35:07:39.95 2013 Sep 22 180 HD209932 prism IRTF 100, 95, 85 PSOJ334.2+28 22:17:02.98 +28:56:37.98 2015 Jul 01 3000 HIP111538 SXD Gemini 30, 44, 41 PSOJ351.3–11 23:25:22.42 −11:21:05.18 2013 Dec 11 1440 HD3604 SXD IRTF 35, 32, 29 PSOJ358.5+22 23:54:12.66 +22:08:21.70 2013 Nov 23 720 HD1561 prism IRTF 46, 33, 28
5
(R∼130) spectra. In order to measure these indices from our moderate-resolution SXD spectra (R∼750), we smoothed those spectra to R=130. The H-cont index from Allers & Liu (2013) is used to assess gravity in either low- or
moderate-resolution spectra by measuring the shape of the H band, specifically how close the blue end of the H-band continuum is to a straight line. For our moderate-resolution spectra, following Allers & Liu (2013), we also used the FeHJ index and the alkali line indices in the Jband (NaI[1.138 μm],
KI[1.169 μm], KI[1.177 μm], and KI[1.253 μm]) to assess
gravity with the continuum used to compute pseudo-equivalent widths defined by a linear fit.
For each of these gravity indices, Allers & Liu (2013)
estimate the flux uncertainties from the rms scatter about a linear fit to the continuum window around each index. In the case of high-S/N spectra this uncertainty in fitting the continuum is the dominant source of error to measure pseudo-equivalent widths. However, this approach under-estimates the uncertainties for our lower-S/N spectra with S/ N∼40–100. Therefore, in our method, we determined the Figure 2. An example of visual classification of one of our candidate ABDor Moving Group members, PSOJ035.8–15 (dark orange), by comparing to the Kirkpatrick et al.(2010) spectral standard Mdwarfs (gray). The standards were taken from the IRTF Spectral Library (Cushing et al.2005) and smoothed to the resolution of our candidate spectrum(in this case, R∼750). The standards are, from top to bottom, Gl51 (M5), Gl406 (M6), Gl644C (M7), VB10 (M8), and LHS2924 (M9). The spectral type determined from visual classification for this object is M7±1 in both the J and K band.
Table 3 Spectral Type Name J SpTa K SpTa H 2O H2O–D H2O–1 H2O–2 Final SpT PSOJ004.7+41 M9±1 M9±1 L0.1-+0.40.4 L b L1.3-+1.11.1 L0.4-+0.50.5 L0.1±1.0 PSOJ035.8–15 M7±1 M7±1 M6.9-+0.40.4 L b M8.6-+1.01.1 M7.2-+0.50.5 M7.1±1.0 PSOJ039.6–21 L1±1 L3±1 L3.9-+1.00.9 L2.01.0+0.9 L4.8-+1.11.0 L0.9-+0.91.0 L2.6±1.0 PSOJ167.1+68 L2±1 L2±1 L2.1-+0.30.4 L1.1+-0.70.8 L2.5-+1.01.1 L1.6+0.50.4 L1.8±1.0 PSOJ232.2+63 M7±1 M7±1 M7.8-+0.40.3 L M8.6-+1.11.1 M7.8-+0.50.4 M7.8±1.0 PSOJ236.8–16 M9±1 L0±1 L0.1-+0.60.6 L1.1-+0.90.9 M9.8-+1.01.1 M7.8-+0.60.6 M9.4±1.0 PSOJ292.9–06 M8±1 M8±1 M7.2-+0.40.4 L M8.7-+1.11.0 M7.7-+0.50.5 M7.6±1.0 PSOJ306.0+16 L3.5±1 L2.5±1 L2.0-+0.40.4 L3.0-+0.80.8 L2.1+1.11.1 L2.1+0.50.6 L2.3±1 PSOJ318.4+35 L2±1 L1±1 L0.8-+0.40.5 L2.0-+0.70.7 L2.1-+1.01.1 L0.1-+0.50.5 L0.9±1.0 PSOJ334.2+28 L4.5±1 L3±1 L3.8-+0.40.5 L2.6-+0.70.7 L3.4-+1.11.0 L L3.5±1 PSOJ351.3–11 M6±1 M7±1 M6.8-+0.40.4 L b M6.6-+1.11.1 M6.2-+0.50.5 M6.5±1.0 PSOJ358.5+22 L1±1 L3±1 L1.2-+1.00.9 L1.8-+1.01.0 L2.6-+1.21.3 L2.1-+0.80.6 L1.9±1.0 Notes. a
This spectral type is determined by visual classification. b
The H2O–D index is undefined for this spectral type.
6
uncertainty in each index(σ) using a Monte Carlo simulation to propagate the spectrum measurement errors.
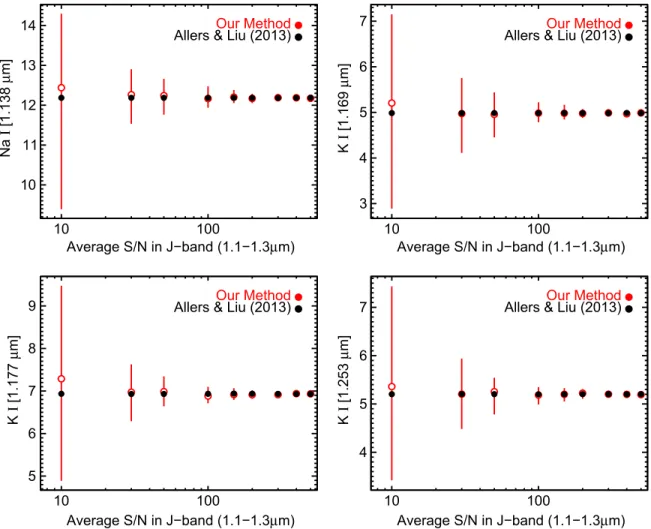
In order to examine the effects of low S/N in calculating the uncertainties for the gravity indices, we simulated spectra with a range of S/N and determined the alkali line gravity index values and uncertainties. We degraded the S/N of Gl752B, an M8 from the IRTF Spectral Library(Rayner et al.2009), from
S/N of 500 down to 10. Then we calculated the measurement errors for the alkali line gravity indices (NaI[1.138 μm],
KI[1.169 μm], KI[1.177 μm], and KI[1.253 μm]) using both
a Monte Carlo simulation to propagate the measurement errors and the original method of Allers & Liu(2013). Our simulation
shows that although both methods are consistent within uncertainties for these indices (Figure 4), the measurement
errors are the main source of error for spectra with modest S/ N(200).
5.1.2. Gravity Index Scores
After computing the index values and their uncertainties, we determine gravity scores for each of these indices, namely, 0, 1, or 2. Following Allers & Liu(2013), indices that are undefined
for an object, because of spectral type and/or resolution, are given a score of “n.” The Allers & Liu (2013) method also
gives indices with values that are within 1σ (the index
uncertainty) from the field sequence values a score of “?.” We handle such objects slightly differently and instead do not give indices a score of“?” in order to better identify borderline objects between theINT-GandFLD-Gvalues.
For objects with low-resolution spectra(R∼130), only the FeHz, VOz, KIJ, and H-cont indices are used. As an example, for PSOJ039.6–21, the FeHz, VOz, KIJ, and H-cont scores are 1021. But strictly following Allers & Liu (2013), the final
scores would instead be 102? because the H-cont index value is within 1σ of theFLD-Gvalue.
For objects with moderate-resolution spectra(R∼750), the Allers & Liu (2013) method uses a similar set of four
measurements to assess gravity: one based on FeH, VOz, the alkali lines, and H-cont. The index scores for VOzand H-cont are computed in the same manner as for the low-resolution spectra. However, unlike for the low-resolution spectra, the final FeH and alkali line scores are determined by combining the scores from multiple indices. Thefinal alkali line score is the mean(rounded up to the nearest integer) of the individual scores from the NaI[1.138 μm], KI[1.169 μm],
KI[1.177 μm], and KI[1.253 μm] indices. As an example,
for PSOJ035.8–15, the scores for NaI[1.138 μm],
KI[1.169 μm], KI[1.177 μm], and KI[1.253 μm] are 0101,
and thus the final alkali line index score is 1. The final FeH index score is the larger of the FeHz and FeHJ scores. For 2MASSJ0233–15, the scores for FeHz and FeHJare 11, and thus the final FeH score is 1. After amalgamating the indices used to compute the final FeH and alkali line scores, the four scores (FeH, VOz, alkali lines, and H-cont) of our example object, PSOJ035.8–15, are 1n12. In this example, the scores are the same when strictly following the Allers & Liu(2013)
method, since none of the index scores are“?.”
5.1.3. Gravity Classification
Following Allers & Liu(2013), after determining the scores
for the FeH, VOz, alkali lines (KIJ for the low-resolution spectra or a combination of four pseudo-equivalent widths for moderate-resolution spectra), and H-band continuum indices, we reduce these four scores into a single value to represent the overall gravity classification. This overall gravity classification value is the median of thesefinal four scores. If there was an even number of defined indices, we take the average of the two scores straddling the median. Objects with an overall gravity classification value 0.5 are classified asFLD-G. Those objects
with 0.5<gravity classification value < 1.5 are classified as
INT-G, and those with a gravity classification value 1.5 are
classified asVL-G.
Because our method uses a Monte Carlo simulation to propagate measurement uncertainties into the index values, our overall gravity classification also has uncertainties. Each Monte Carlo realization of an object’s spectrum produces an overall gravity classification value, and we report the median value from all the realizations as the final result and the 68% confidence limits as the uncertainty. For instance, 2MASSJ0223–15 has an overall gravity classification value of1.0-+0.0
1.0, which corresponds to
INT-G. For comparison, using
the original Allers & Liu (2013) method, 2MASSJ0223–15
has gravity scores of 1n12, so the overall gravity classification value would be 1, which also corresponds toINT-Gbut without
any uncertainties.
As mentioned in Section5.1.2, unlike Allers & Liu(2013),
we do not ignore indices with values straddling the Figure 3. NIR spectra of our confirmed young brown dwarf ABDor Moving
Group candidates(shades of red) in addition to the four known brown dwarf members (blue) with publicly available spectra: CD-352722B (Wahhaj et al. 2011), 2MASSJ0355+1133 (Faherty et al. 2013; Liu et al.2013a), WISEPJ0047+6803 (Gizis et al.2012,2015), and SDSSJ1110+0116 (Gagné et al.2015a). The spectra are ordered from earliest spectral type (highest mass) to latest spectral type(lowest mass).
intermediate gravity and field gravity values. As a result, we may be able to identify borderline objects that have index values that hint at intermediate gravities but are not clearly separated from the field values. Therefore, we choose to classify objects with overall gravity classification values within 1σ of INT-G as borderline intermediate gravity (INT-G?). For
example, an object with an overall gravity classification value of 0.5-+0.50.5would be classified as INT-G?.
Figures 5 and 6 compare the index values for each of our objects with theFLD-G,INT-G, andVL-Gregions. In addition, as a
visual check on the overall gravity classification, we compare our spectra to known oldfield dwarfs (FLD-G) and young dwarfs
(VL-G) in Figures 7–14. Table4 tabulates the gravity indices
and classification for our objects.
5.2. PS1 Parallaxes, Photometric Distances, and Absolute Magnitudes
PS1 has observed the field of each target repeatedly over several years, allowing us to measure the parallax and proper motions of our targets using relative astrometry techniques. We use the image calibrations calculated by the standard Pan-STARRS analysis, but we re-fit the parallax and proper motions for each object with our own re-analysis of these calibrated coordinates (E. A. Magnier et al. 2016, in preparation).
The standard astrometric analysis of the PS1 images uses a set of low-order polynomial transformations to correct for the distortion introduced by the optical system and the atmosphere, along with individual corrections for each of the 60 CCDs. The camera-level polynomials are of the formå a x yi j, i j with i +
j3. The individual chip corrections consist of a linear transformation (to account for the chip location and rotation) plus a grid offine corrections across the chip, with up to 6×6 correction cells per chip. The astrometric transformations are determined by an iterative calculation to minimize the scatter of the adopted reference stars in the database. Mean per-epoch residuals for moderately bright stars range from 10 to 25 mas depending on the Galactic latitude: regions of higher stellar density allow for a better correction.
The standard astrometry analysis alsofits each star for proper motion and parallax, but it does not currently use a sufficiently robust outlier rejection scheme. We have specifically re-fitted the proper motion and parallax for our targets with a more stringent rejection of outliers. Wefirst reject any detection with flags indicating failures in the photometry analysis, as well as any detections with insufficient coverage of unmasked pixels (psf_qf<0.85). We use 100 bootstrap resamples of the data set to measure the parallax and proper motion of the object. For each of these samples we then measure the distance of each point from the fitted path on the sky, scaled by the position Figure 4. Comparison of the pseudo-equivalent width measurement uncertainties using our method (red open circles) and the Allers & Liu (2013) method (black circles). We include measurement uncertainties, whereas Allers & Liu (2013) only consider uncertainties in measuring continuum, which would dominate for high-S/ N spectra(S/N200). For our relatively lower S/N objects (S/N≈40−100), we need to also include measurement errors when computing the uncertainties in the pseudo-equivalent widths. Although our measurement uncertainties are larger, our pseudo-equivalent widths are consistent with Allers & Liu(2013).
8
errors. Detections that are more than 5σ from the path in more than 50% of the samples are marked as outliers and excluded from thefinal fit. We also use 1000 bootstrap resample tests of the remaining points to determine the errors on the fitted parameters.
Using our custom astrometry analysis, we have determined parallaxes for eight of our objects and one of the previously
known substellar candidate ABDor members,
2MASSJ0058425–0651239 (Gagné et al. 2015b). We show
the final fits in Figures 15 and 16. In Figure17 we plot the fitted parallax motion with the data and the residuals. Our parallaxes are tabulated in Table 1 (for our new candidate
members only) and in Table5.
We also calculated photometric distances for all of our objects (Table 1). We used the average 2MASS J-band
absolute magnitudes as a function of spectral type tabulated by Dupuy & Liu (2012) to determine photometric distances
from our NIR spectral types and J apparent magnitude. While Dupuy & Liu (2012) also provide polynomial relations
between spectral type and absolute magnitude, these relations have a larger dispersion compared to their tabulated averages because the spectral type range (M6–T9) spanned by the polynomials is much larger than the range for our objects(M6– L4). Therefore, using the average absolute magnitudes as a function of spectral type is more accurate than using the polynomial relation for our purposes. We assume that the Figure 5. NIR spectral indices from all of our candidate ABDor Moving Group members. For the FeHz, VOz, and KIJindices, we smoothed the spectra to prism
resolution(R∼130) because the indices are tailored for prism-resolution spectra. We compare the indices of our numbered candidates (red circles) with the defining values for very low gravity(VL-G), intermediate gravity (INT-G), and field gravity (FLD-G) taken from Allers & Liu (2013). Our objects are numbered as follows: (1)PSOJ004.7+41, (2)PSOJ035.8–15, (3)PSOJ039.6–21, (4)PSOJ167.1+68, (5)PSOJ232.2+63, (6)PSOJ236.8–16, (7)PSOJ292.9–06, (8)PSOJ306.0 +16, (9)PSOJ318.4+35, (10)PSOJ334.2+28, (11)PSOJ351.3–11, (12)PSOJ358.5+22. The shaded regions define the gravity classification ofFLD-G(gray),INT -G(gray blue), andVL-G(dark blue) for each index. Note that some indices only can be used for overall gravity classification within a range of spectral types or resolution(i.e., FeHJis only for R500). In these cases, we do not use the index value to determine the object’s gravity score. We expect our ABDor Moving Group
photometric distance uncertainty is 20%, in accord with Dupuy & Liu(2012).
Because young late Mdwarfs can be overluminous compared with their older counterparts (e.g., Liu et al. 2013a), we allow their absolute magnitudes to be up to
1.5 mag brighter than thefield value since we do not know the ages of our objects. For our late Mdwarfs, we calculate two values for the photometric distance, one using thefield absolute magnitudes and one brighter by 1.5 mag. However, young early Ldwarfs have absolute magnitudes consistent with those of their older counterparts (e.g., Liu et al.2013a). Therefore,
for our Ldwarfs we use the field value when converting from spectral type to absolute magnitude. Thus, the uncertainty in the photometric distance for our Mdwarfs is significantly larger than for our Ldwarfs.
Figure18shows the resulting color–magnitude diagram for our objects compared to previously known young and field objects. For our objects, we synthesized MKO magnitudes in order to compare with field dwarfs because of the larger amount of MKO photometry available for young companions and the Pleiades objects. When synthesizing photometry, we
used the 2MASS(Skrutskie et al.2006)6and MKO(Tokunaga et al.2002) filter profiles and used the 2MASS photometry for
flux calibration. We then compared our candidates (Table 6)
against known Pleiades members (e.g., Lodieu et al. 2007; Bihain et al.2010), whose age (125 Myr; e.g., Basri et al.1996; Martín et al. 1998) is similar to that of the AB Dor Moving
Group. In addition, we compared our objects to field dwarfs and young substellar companions based on the compilation by Dupuy & Liu (2012). Our candidate AB Dor Moving Group
members have NIR absolute magnitudes and colors consistent with the Pleiades sequence, as expected given the similar ages of the two stellar associations. (Although by construction the NIR absolute magnitudes, for objects without parallaxes, should be consistent with their ages, the NIR colors would not necessarily be the same for our candidates as for other objects with the same age and absolute magnitude.)
Figure 6. NIR spectral indices of our candidate ABDor Moving Group members taken in the cross-dispersed mode in IRTF/SpeX. We compare the indices of our candidates with the defining values for very low gravity (VL-G), intermediate gravity (INT-G), and field gravity (FLD-G) taken from Allers & Liu (2013). The shaded regions define the gravity classification ofFLD-G(gray),INT-G(gray blue), andVL-G(dark blue) for each index. We expect our ABDor Moving Group candidates to have intermediate gravities. Our objects have the same number labels as Figure5.
6
http://www.ipac.caltech.edu/2mass/releases/second/doc/sec3_1b1.html 10
5.3. AB Dor Moving Group Membership
We assessed our candidates’ membership in the AB Dor Moving Group using the BANYAN II web tool (Malo et al. 2013; Gagné et al.2014), which calculates membership
probabilities for objects using Bayesian inference and the proper motion, sky coordinates, and parallactic (or photo-metric) distance (Section5.2). In addition, because our objects
have spectral signatures of youth, we could improve the accuracy of the BANYAN-II membership probabilities by only using a young(<1 Gyr) field population to determine the field membership probability. Although the BANYANII web tool analysis(which uses kinematics only) is different from the full BANYANII analysis (Gagné et al. [2014] incorporate
kinematics and photometry), we have used their field contamination rate curves to approximate the membership quality of our candidates. These field contamination curves suggest that objects (with distances but no radial velocities) with BANYANII membership probabilities of 15%, ≈15%– 75%, and 75% would have field contamination rates of 50%, ≈50%–10%, and 10%, respectively. Also, we note that bonafide members (i.e., members with signatures of youth, proper motions, RVs, and parallaxes) can have BANYANII membership probabilities from 10% to 95% (Gagné et al.
2015c). Therefore, we have roughly divided our sample into
three bins based on their BANYANII web tool memberships, with a few exceptions(Section5.6): strong candidates ( 75%),
possible candidates (15%–75%), and probable young field interlopers(<15%).
The BANYANII web tool also computes statistical distances, i.e., the most probable distance if an object were a member of a given moving group (in this case, the AB Dor Moving Group). We tabulate these distances in Table 1. We compared both the statistical distance and the dkin with the parallactic (or photometric for objects without parallaxes) distances for all of our objects. The statistical distances are consistent within 2σ with the parallactic (or photometric) distances for all of our objects except PSOJ035.8–15, where the large difference(3σ) between the statistical and parallactic distances suggests that it is a probable young field interloper. For all of our objects, except PSOJ236.8–16, the dkin is consistent within 2σ with the parallactic (or photometric) distance (Figure 19). The discrepancy between the parallactic
distance and dkin for PSOJ236.8–16 is consistent with it having a low ABDor Moving Group membership probability and being a probable youngfield interloper. We also note that the statistical distances are consistent within 2σ of the dkinfor all objects.
As another way of assessing membership, we compared the θ for our objects with the θ for the known members (see Section3, Figure1). All of our objects have θ under 15°, which
is consistent with the known members.
We also compared the heliocentric kinematics (UVW) and space positions (XYZ) of our ABDor Moving Group candidates in Figures 20–31 with the YMG members from Torres et al.(2008) with membership probabilities of at least
75%. For the plotted YMG members, we used radial velocities and parallaxes with values from the literature. For our candidates, we assumed a probable RV range of −20 to +20 km s−1, consistent with the range of the bona fide YMG members from Torres et al. (2008) plotted. Eight of our
candidates’ positions are consistent within 2σ of the average positions of the known ABDor members within their uncertainties. Note that 3 km s−1is the uncertainty in the mean UVW position for the group given the uncertainties in each coordinate (≈1–2 km s−1) and that the spatial positions (XYZ) of the known members are more spread out in comparison to the UVW positions (10–50 pc encompasses the 1σ distance range). However, PSOJ004.7+41, PSOJ035.8–15, PSOJ167.1+68, and PSOJ236.8–16 have UVW positions inconsistent with ABDor membership. We tabulate the distance between the mean group UVW and XYZ positions and the closest possible positions of our candidates(within the assumed RV range) in Table1.
In total, we have three strong candidates, five possible candidates, and four probable young field interlopers. We summarize the final BANYANII web tool membership probabilities in Table 1, and the BANYANII web tool and Gagné et al. (2015b, 2015c) membership probabilities, when
available, in Table5. However, these probabilities are likely a lower limit on the actual membership probabilities because our candidates are ≈125 Myr, the age of the ABDor Moving Group, much younger than the 1 Gyr oldfield population used in the BANYANII web tool.
5.4. Physical Properties
We calculated the bolometric magnitudes, effective tem-peratures, and masses for our ABDor Moving Group candidate members, the previously known bonafide substellar members, and candidate substellar members with spectroscopically confirmed youth (Table 7). For all of these properties, we
Figure 7. NIR moderate-resolution (R∼750) J-band spectra from IRTF/SpeX of our ABDor Moving Group candidate, PSOJ004.7+41 (red), compared with afield gravity (FLD-G, light blue) and young, very low gravity (VL-G, dark blue) dwarf of similar spectral type (within half a spectral type). For our comparison spectra, we used the field spectral type standard objects from Kirkpatrick et al. (2010) if there were available SXD spectra in the SpeX Library. If not, we used the non-standardfield object taken in SXD mode with the closest spectral type to our object. Young dwarfs were taken from the list of standard young objects in Allers & Liu(2013) if there were available moderate-resolution spectra. If not, we used a non-standardVL-Gobject from Allers & Liu (2013) with a spectral type within half a spectral type of our object. Gravity-sensitive features in the J band from Allers & Liu(2013) are labeled, and the wavelength ranges used to calculate gravity indices are highlighted for NaI (blue), KI(purple), and FeHJ(yellow-green). Members of the ABDor Moving
Group have an age of≈125 Myr and thus are expected to have intermediate gravities lying between the field dwarfs (FLD-G) and young dwarfs (VL-G). Although PSOJ004.7+41 has a gravity classification ofFLD-G, the gravity indices show minor hints of intermediate gravity.
Table 4
Gravity Indices and Classification
Name FeHz FeHJ VOz KIJ H-cont Index NaI KI KI KI EW Final Overall Overall
Scoresa [1.169] [1.177] [1.253] Index Gravity Gravity Gravity
Scoresa Scoresa Valueb Class
PSOJ004.7+41 1.26-+0.010.01 1.17-+0.010.01 1.082-+0.0060.006 1.099-+0.0040.003 0.943-+0.0030.003 01001 (01001) -+ 14 11 7.2-+0.50.4 9.7-+0.40.4 7.6-+0.30.4 0000 (0000) 1001 (100?) -+ 0.5 0.00.0 FLD-Gc PSOJ035.8–15 1.079-+0.0080.008 1.06-+0.010.01 1.020-+0.0060.005 1.040-+0.0030.003 0.991-+0.0040.003 11n12 (11n12) -+ 12 11 2.2-+0.60.6 5.1-+0.50.4 2.2-+0.40.3 0101 (0101) 1n12 (1n12) -+ 1.0 0.01.0 INT-G PSOJ039.6–21 1.17-+0.020.02 1.05-+0.020.02 1.06-+0.010.01 1.068-+0.0090.008 0.91-+0.020.01 1n021 (1n02?) L L L L L 1021 (102?) -+ 1.0 0.50.0 INT-G PSOJ167.1+68 1.214-+0.0090.008 1.120-+0.0080.009 1.245+-0.0050.005 1.100-+0.0030.003 0.942-+0.0020.002 11211 (11211) -+ 8.9 0.50.5 5.6-+0.30.3 7.0+-0.30.3 4.3-+0.20.2 1111 (1111) 1211 (1211) -+ 1.0 0.00.0 INT-G PSOJ232.2+63 1.129-+0.0020.002 1.114-+0.0030.003 1.057+-0.00160.0018 0.960-+0.0010.001 1.065-+0.0010.001 11n10 (11n10) -+ 9.8 0.30.3 2.8-+0.150.15 5.0-+0.130.13 2.6-+0.120.12 1112 (1112) 1n10 (1n10) -+ 1.0 0.00.0 INT-G PSOJ236.8–16 1.156-+0.0160.017 L 1.078-+0.0130.013 1.077-+0.0110.010 0.943-+0.0080.008 1nn11 (1nn11) L L L L L (1n??)1n11 -+ 1.0 0.00.0 INT-G PSOJ292.9–06 1.104-+0.0040.005 1.013-+0.0080.008 1.042-+0.0040.004 0.984-+0.0040.004 1.068-+0.0040.004 1nn01 (1nn0?) L L L L L (1n0?)1n01 -+ 1.0 1.00.0 INT-G PSOJ306.0+16 1.324-+0.0190.02 L 1.116-+0.0110.010 0.900-+0.0060.006 1.125-+0.0080.009 0n110 (0n110) L L L L L 0101 (010?) -+ 0.5 0.00.5 INT-G? PSOJ318.4+35 1.16-+0.020.02 L 1.18-+0.010.01 1.10-+0.0060.006 0.934-+0.0050.006 1n111 (1n111) L L L L L 1111 (1111) -+ 1.0 0.00.0 INT-G PSOJ334.2+28 L 1.21-+0.060.07 1.10-+0.020.02 0.926-+0.0070.008 1.106-+0.0090.009 n1111 (n1111) 10.9±0.9 −1.5±4.5 7.5±2.5 6.6±0.7 1211 (021?) 1111 (111?) -+ 1.0 0.00.0 INT-G PSOJ351.3–11 1.05-+0.010.01 1.06-+0.010.02 1.033+-0.0080.009 1.043-+0.0040.004 0.968-+0.0060.006 21n10 (21n10) -+ 8 22 0.6-+0.80.8 3.0-+0.70.7 2.0-+0.60.6 1212 (1212) 2n20 (2n20) -+ 1.0 0.01.0 INT-G PSOJ358.5+22 1.36-+0.050.07 L 1.13-+0.020.03 1.13-+0.0140.010 0.920-+0.0150.010 0n111 (0n1??) L L L L L 0111 (01??) -+ 0.5 0.00.5 INT-G? Notes. a
Scores in parentheses are the scores determined with the Allers & Liu(2013) classification scheme. Objects with index values corresponding toINT-Gbut within 1σ of theFLD-Gvalue are classified with a score of ?.
b
The overall gravity classification value and the 68% confidence limits calculated using our modified version of the Allers & Liu (2013) classification scheme (Section5).
c
Although classified asFLD-G, the spectral indices show hints ofINT-G.
12 The Astrophysical Journal, 821:120 (31pp ), 2016 April 20 Aller et al.
used a Monte Carlo simulation to propagate measurement errors (in distance, spectral type, and age) and determine the 68% confidence limits for each calculated parameter.
We use the Liu et al.(2010) H-band bolometric corrections
to determine the absolute bolometric magnitude because the H-band corrections have the lowest dispersion and the bolometric correction changes slowly with spectral type. To use these corrections, we used our synthesized MKO H-band magnitudes.
For our objects, we determined Teff and mass from our estimated bolometric luminosities using the Chabrier et al. (2000) evolutionary models. For our analysis, we assume that
the age of the ABDor Moving Group is 125±20 Myr (Luhman et al.2005; Ortega et al.2007; Barenfeld et al.2013)
and propagate the uncertainties in age using a Monte Carlo simulation. For our young field interlopers we adopt a more conservative age of 150±100 Myr. Our late Mdwarfs PSOJ035.8–15, PSOJ236.8–16, and PSOJ351.3–11 have
masses of 50–100 MJup. Our Ldwarfs, PSOJ004.7+41, PSOJ039.6–21, PSOJ167.1+68, PSOJ318.4+35, and PSOJ358.5+22, have masses of ∼35–45 MJup.
5.5. Comparison with BASS
Eight of our new young brown dwarfs are in the very large (∼104 objects) input catalog of color-selected brown dwarfs from the Gagné et al.(2015c) BASS program, an all-sky survey
constructed by combining 2MASS and WISE. Three of our new young brown dwarf candidate members, PSOJ292.9–06, PSOJ306.0+16, and PSOJ318.4+35, are missing from the BASS input catalog because their low Galactic latitudes (b = −11°.9, −11°.7, and −9°.3, respectively) excluded them from the BASS search (∣ ∣b 15 . PSOJ334.2+28 is also) missing from the BASS input catalog, possibly due to its faint 2MASS magnitudes.
However, none of these eight candidate ABDor Moving Group members included in the BASS input catalog are in the Figure 8. NIR moderate-resolution (R∼750) spectra from IRTF/SpeX of our
ABDor Moving Group candidate, PSOJ035.8–15 (red), compared with an FLD-G(light blue) andVL-G(dark blue) dwarf of similar spectral type (within half a spectral type). We choose the comparison spectra as described in
Figure7.
Figure 9. NIR moderate-resolution (R∼750) spectra from IRTF/SpeX of one of our ABDor Moving Group candidates, PSOJ167.1+68 (red), compared with anFLD-G(light blue) andVL-G(dark blue) dwarf of similar spectral type (within half a spectral type). We choose the comparison spectra as described in Figure7.
Figure 10. NIR moderate-resolution (R∼750) spectra from IRTF/SpeX of one of our ABDor Moving Group candidates, PSOJ232.2+63 (red), compared with a FLD-G (light blue) and VL-G (dark blue) dwarf of similar spectral type(within half a spectral type). We choose the comparison spectra as described in Figure7.
Figure 11. NIR moderate-resolution (R∼750) spectra from IRTF/SpeX of one of our ABDor Moving Group candidates, PSOJ351.3–11 (red), compared with anFLD-G(light blue) andVL-G(dark blue) dwarf of similar spectral type (within half a spectral type). We choose the comparison spectra as described in Figure7.
final Gagné et al. (2015c) catalog of ∼300 high-priority
candidate YMG members. In creating this high-priority catalog, Gagné et al. (2015c) used 2MASS+WISE proper
motions and a color–magnitude diagram to select candidates that are redder than thefield sequence. However, based on our parallactic (or photometric) distances to calculate absolute magnitudes, three of ourINT-Gand one of ourFLD-Gobjects in
the BASS input catalog (PSO J035.8–15, PSO J039.6–21, PSO J236.8–16, and PSO J004.7+41) are slightly blue com-pared to other known young objects and are consistent with the field given their spectral type (Figures 32 and 33) and thus
could have been rejected from the high-priority catalog. Although our remaining four objects present in the BASS input catalog, PSOJ167.1+68, PSOJ236.8–16, PSOJ232.2 +63, and PSOJ358.5+22, may have a red enough J − K color compared with the model used in the BASS survey, our absolute magnitudes may differ from theirs because we calculate absolute magnitudes from photometric distance (from spectral type), whereas they use the statistical distance from their Bayesian analysis. Thus, the BASS survey may have placed these objects in different locations on a color– magnitude diagram and rejected them as likely young objects in their analysis. Although the 2MASS+WISE proper motion from Gagné et al. (2015c) could also have removed these
objects from their high-priority catalog, our PS1+2MASS proper motions are consistent within the uncertainties (Table 1).
Three of our objects present in the BASS input catalog, PSOJ167.1+68 (2MASS J11083081+6830169), PSOJ232.2 +63 (2MASS J15291017+6312539), and PSOJ236.8–16 (2MASS J15470557–1626303A), were independently found as candidate moving group members in Gagné et al.(2015b) as
part of their less restricted initial search (see Section 5.6 for details). Determining RVs for PSOJ236.8–16 and PSOJ232.2 +63 would be needed for any further membership assessment. We conclude that PSOJ167.1+68 is a young field interloper using the literature RV(Blake et al.2010) and our PS1 parallax
(Section 5.6).
5.6. Summary of Properties of Individual Objects We have determined properties(i.e., spectral type and mass) and assessed the group membership for our 12 objects. We summarize the results in the following paragraphs (see Sections5.1,5.3–5.5, and Table5for details).
PSOJ004.7+41 is anFLD-G, L0.1 dwarf(40-+1311MJup), with a
spectrum that shows hints of youth. However, the UVWXYZ positions are inconsistent with ABDor Moving Group membership, and the BANYANII membership is low; thus, we consider it to be a probable youngfield interloper.
PSOJ035.8–15 is an INT-G M7.1 dwarf (80-+3040 MJup).
Although the UVWXYZ positions for PSOJ035–15 are incon-sistent with ABDor Moving Group membership, it has a moderate BANYANII web tool membership probability (49%). We speculate that the membership probability may be optimistic due to the large distance uncertainty. Thus, we consider this object to be a probable youngfield interloper.
PSOJ039.6–21 is an INT-G L2 dwarf (37 ± 5 MJup) with a high membership probability. Its UVWXYZ positions are also consistent with ABDor Moving Group membership (except U, which is consistent within 2.5σ). However, it appears to be spectroscopically peculiar. When comparing to known field dwarfs, its spectrum matches very well with the blue L2dwarf 2MASSJ1431+14 (Sheppard & Cushing 2009), a candidate
subdwarf. We also note that the overall continuum is more blue than both theFLD-GandVL-Gstandards, also indicating spectral
peculiarity. Thus, as the Allers & Liu (2013) gravity indices
were not intended for use on subdwarfs, theINT-Gclassification
may be invalid. However, the kinematics and position appear to be consistent with possible membership with the ABDor Moving Group. Therefore, we conclude that although member-ship in the group is possible, it could also be a field L-type subdwarf. Thus a radial velocity is still needed to conclude its group membership, or lack thereof.
PSOJ167.1+68 is an INT-G L1.8 dwarf (52-+1614 MJup) with
Hα emission that was first discovered in Gizis et al. (2000) as
an L1 dwarf(optical spectral type). It was also independently identified as a low-probability candidate Carina member in Gagné et al. (2015b). After combining the space positions
+kinematics (UVWXYZ; Figure 23), the literature RV (Blake
et al.2010), and our PS1 parallax, we suggest that it is actually
unlikely to be a Carina member (BANYAN II web tool probability of zero). As we can completely determine the UVWXYZ positions for this object, we conclude that this object is a youngfield member.
PSOJ232.2+63 is anINT-G, M7.8 dwarf(130-+4020MJup) with
a membership probability of 37% and UVWXYZ consistent with ABDor Moving Group membership. It was also independently discovered as a candidate member by Gagné et al. (2015b).
Although they note that it has a high youngfield contamination probability, they did not have a parallactic distance. Thus, because we have a parallactic distance and the RV is still unknown, we still consider it a possible member. We note that the parallactic distance is significantly closer than the photometric distance, even if we assume that young Mdwarfs are more luminous by 1.5 mag than theirfield counterparts. The high estimated mass, suggesting a stellar rather than substellar object, is likely due to the overluminosity of this object.
PSOJ236.7–16 is anINT-GM9.4 dwarf(44-+1512 MJup) with a
very low membership probability and UVWXYZ positions inconsistent with ABDor Moving Group membership. It was also independently discovered in Gagné et al.(2015b) as a
low-Figure 12. NIR moderate-resolution (R∼1700) spectra from Gemini/GNIRS of one of our ABDor Moving Group candidates, PSOJ334.2+28 (red), compared with an FLD-G (light blue) andVL-G(dark blue) dwarf of similar spectral type(within half a spectral type). We choose the comparison spectra as described in Figure7.
14
Figure 13. NIR low-resolution (R∼130) spectra from IRTF/SpeX of our candidates with overall gravity classifications ofINT-Gcompared with anFLD-G(light blue) and a young, very low gravity(dark blue) dwarf of similar spectral type (within half a spectral type). We used field spectral standards from Kirkpatrick et al. (2010) if there was available low-resolution or moderate-resolution spectra. Young dwarfs were taken from the list of standardVL-Gobjects in Allers & Liu(2013) with publicly available spectra. All comparison spectra have been smoothed to R∼130. Gravity-sensitive features from Allers & Liu (2013) are labeled, and the wavelength ranges used to calculate the gravity indices are highlighted for FeHz(yellow-green), VOz(blue), KIJ(purple), and H-cont (orange).
Figure 14. NIR low-resolution (R∼130) spectra from IRTF/SpeX of our candidates with overall gravity classifications ofINT-G? compared with anFLD-G(light blue) and a young, very low gravity(dark blue) dwarf of similar spectral type (within half a spectral type). All comparison spectra have been chosen as described in Figure5 and smoothed to R∼130. Gravity-sensitive features from Allers & Liu (2013) are labeled, and the wavelength ranges used to calculate the gravity indices are highlighted for FeHz(yellow-green), VOz(blue), KIJ(purple), and H-cont (orange).
probability member with a high field contamination prob-ability. With the addition of our PS1 parallax to the member-ship analysis, we conclude that PSOJ236.7–16 is a likely young field interloper. We note that Gagné et al. (2015b) also
propose that the nearby object 2MASSJ15470557–1626303B is a low-gravity stellar companion with a spectral type of M5±2.
PSOJ292.9–06 is an INT-G M7.6 dwarf (≈55–110 MJup).
Although it has a low membership probability, the UVWXYZ positions are consistent with ABDor Moving Group member-ship. Thus, we consider it to be a possible member.
PSOJ306.0+16 is anINT-G? L2.3 dwarf(34-+65MJup) with a
membership probability of 36% and UVWXYZ consistent with ABDor Moving Group membership. The spectrum shows hints of youth but may still be an older field object. We consider this object as a possible candidate member, requiring parallax and RV to further assess membership.
PSOJ334.2+28 is anINT-GL3.5 dwarf(31+56 MJup) with a
low BANYANII web tool membership probability (0.79%)
but with heliocentric kinematics (UVW) and space positions (XYZ) that are consistent with ABDor Moving Group membership. One possible reason for the low BANYANII membership probability is that the distance is 59±12 pc, farther than the 1σ distance range of the bona fide members that were used to develop the BANYANII model. Thus, we still consider this object to be a possible candidate.
PSOJ351.3–11 is anINT-GM6.5 dwarf(70-+3050 MJup) with a
membership probability of 50%. As the UVWXYZ positions are also consistent with ABDor Moving Group membership, we consider it as a possible member.
PSOJ358.5+22 is anINT-G? L1.9 dwarf(36-+65MJup) with a
high membership probability (79%) and UVWXYZ positions consistent with group membership. Thus, we consider it to be a strong candidate member.
6. DISCUSSION
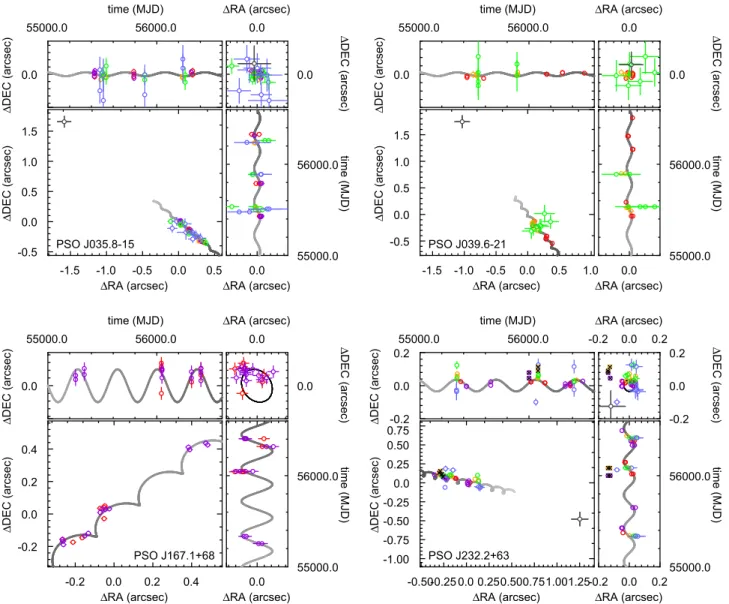
Low-gravity (i.e., young) and dusty field Ldwarfs are known to have redder WISE colors(W1 − W2) and NIR colors Figure 15. PS1 parallax motion and the motion in both R.A. and decl. for PSOJ035.8–15 (top left), PSOJ039.6–21 (top right), PSOJ167.1+68 (bottom left), and PSOJ232.3–63 (bottom right). The different color symbols correspond to the filter used to determine the astrometric position for gP1(blue), rP1(green), iP1(orange), zP1(purple), yP1(red), and 2MASS (gray). The crosses denote points rejected as outliers during the astrometric fit. The thick gray line denotes the best fit where the object is moving from the light–dark gray over time.
16
( J − K) compared with their old field counterparts of the same spectral type(e.g., Gizis et al.2012). Our work sheds light on
the colors of these objects at intermediate ages (≈125 Myr)
and intermediate gravities(INT-G). We compared the W1 − W2
and J− K colors of our candidate ABDor Moving Group members with the mean W1− W2 and mean J − K colors of Figure 16. PS1 parallax motion and the motion in both R.A. and decl. for PSOJ236.8–16 (top left), PSOJ318.4+35 (top right), PSOJ351.3–11 (middle left), PSOJ358.5+22 (middle right), and the previously identified candidate member, 2MASSJ0058–06 (bottom left). The colors and symbols are the same as in Figure15.