HAL Id: hal-02164765
https://hal.archives-ouvertes.fr/hal-02164765
Preprint submitted on 25 Jun 2019
HAL is a multi-disciplinary open access
archive for the deposit and dissemination of sci-entific research documents, whether they are pub-lished or not. The documents may come from teaching and research institutions in France or abroad, or from public or private research centers.
L’archive ouverte pluridisciplinaire HAL, est destinée au dépôt et à la diffusion de documents scientifiques de niveau recherche, publiés ou non, émanant des établissements d’enseignement et de recherche français ou étrangers, des laboratoires publics ou privés.
Olivia Massiani-Beaudoin, Rajiv L Joshi, Julia Fuchs, Alain Prochiantz
To cite this version:
Francois-Xavier Blaudin de Thé, Hocine Rekaik, Eugenie Peze-Heidsieck, Olivia Massiani-Beaudoin, Rajiv L Joshi, et al.. LINE-1 repression attenuates degeneration in adult dopaminergic neurons. 2019. �hal-02164765�
LINE-1 repression attenuates degeneration in adult dopaminergic neurons
François-Xavier Blaudin de Thé1,2, Hocine Rekaik1,2, Eugenie Peze-Heidsieck1, Olivia Massiani-Beaudoin1, Rajiv L. Joshi1, Julia Fuchs1,* & Alain Prochiantz1,*
1Centre for Interdisciplinary Research in Biology (CIRB), Collège de France, CNRS
UMR 7241/INSERM U1050, PSL Research University, 11 place Marcelin Berthelot, 75231 Paris Cedex 05, France.
Running title: L1 implication in neurodegeneration
2
These authors contributed equally to this work. *For correspondence:
Abstract
Long Interspersed Nuclear Elements (LINEs) retrotransposons are emerging as possible players in development and disease. We report here that the three main active LINE-1 families are expressed in post-mitotic dopaminergic neurons of the substantia nigra pars compacta, a class of ventral midbrain neurons that degenerate in Parkinson disease. The progressive degeneration of dopaminergic neurons in mice heterozygote for Engrailed-1 that starts at 6 weeks of age is paralleled by an increase in LINE-1 expression. Similarly, DNA damage and cell death induced by an acute oxidative stress specifically applied to these neurons is accompanied by enhanced LINE-1 expression. Following these observations, we demonstrate that LINE-1 overexpression is key to oxidative stress-induced neuronal death. Reduction of LINE-1 activity through direct transcriptional repression by Engrailed, a siRNA directed against LINE-1, the nucleoside-analogue reverse transcriptase inhibitor stavudine or viral Piwil1 expression, protects dopaminergic neurons against degeneration.
Keywords: Dopaminergic neurons / Homeoprotein / L1 retrotransposons / Neurodegeneration / Oxidative stress
Introduction
More than half of the mammalian genome derives from active or fossilized transposable elements (Lander et al. 2001; de Koning et al. 2011). Among them, non-long terminal repeat (non-LTR) retrotransposons composed of Long and Short Interspersed Nuclear Elements (LINEs and SINEs) represent 21% of the human genome (Lander et al. 2001). When active, these “jumping” elements pass through an intermediate RNA form before their retro-transcription and insertion into the genome. One estimates the number of active LINE-1 (L1) elements to be around 100 in the human (Brouha et al. 2003) and 3000 in the mouse (Goodier et al. 2001). SINEs can be seen as parasites of LINEs as their activity is dependent on L1-encoded ORF1p and ORF2p proteins. It is of note that even truncated, and thus apparently silent, mobile elements provide alternative promoters for coding genes (Mätlik, Redik, and Speek 2006), regulate DNA methylation (Grandi et al. 2015) and give rise to non-coding RNAs (McCue and Slotkin 2012). They are thus endowed with major regulatory activities in physiology (Han and Boeke 2005) and disease, for example in the context of cancer pathogenesis (Tufarelli, Cruickshanks, and Meehan 2014; Cruickshanks and Tufarelli 2009).
Until recently, L1 were thought to be primarily expressed in germ cells in conditions alleviating the strong repressive activities of PIWI proteins of the Argonaut family (Siomi et al. 2011). These conditions correspond to an endangering stress and the resulting L1-induced mutations in germ cells have been described as the last line of defense of organisms in highly unfavourable environmental conditions (Siomi et al. 2011). This view has changed with the finding that mobile elements are also active in somatic tissues. In the brain, L1 activity has been demonstrated in dividing neural stem cells (Muotri et al. 2005), but there also exists a few reports supporting L1 expression in post-mitotic neurons, primarily upon stress, during ageing (Li et al. 2013; Erwin, Marchetto, and Gage 2014) and in age-related diseases (Li et al. 2012; Tan et al. 2012; Lathe and Harris 2009)
Mesencephalic dopaminergic (mDA) neurons from the substantia nigra pars compacta (SNpc) become dysfunctional during ageing with a decrease in SNpc volume in non-human primates (Collier et al. 2007) and in humans (Alho et al. 2015). This dysfunction can be accelerated and associated with mDA neuron death in response to specific mutations or environmental stressors, such as exposure to
neurotoxins, giving rise to Parkinson disease (PD) (Kalia and Lang 2015). Various mouse models of PD exist based on toxin administration or on mutations in genes that cause familial PD. A recent murine model, with a progressive degeneration of mDA neurons along with motor and non-motor phenotypes, consists in the deletion of one allele of Engrailed-1 (En1) (Sonnier et al. 2007; Nordström et al. 2015). Engrailed-1 (En1) is a homeoprotein transcription factor specifically expressed in adult mDA neurons together with its paralogue Engrailed-2 (En2). In the absence of one En1 allele (En1-het mouse), mDA neurons die faster and, after one year, their number in the SNpc is reduced to 62% of that observed in wild-type (wt) siblings. Dopaminergic cell death is less pronounced in the ventral tegmental area (VTA), as also observed in PD (Sonnier et al. 2007).
En1 and En2 (collectively Engrailed or En1/2) are biochemically equivalent in the midbrain (Hanks et al. 1995) and, similarly to most homeoproteins, are secreted and internalized by live cells (Joliot and Prochiantz 2004). The latter property has allowed us to use En1 and En2 as therapeutic proteins in the En1-het mice and in three other mouse models of PD: 1-methyl-4-phenyl-1,2,3,6-tetrahydropyridine (MPTP) or 6-hydroxydopamine (6-OHDA) intoxication and the injection of cell-permeable mutated (A30P) α-synuclein (Sonnier et al. 2007; Alvarez-Fischer et al. 2011). More recently, we have shown that mDA neurons from En1-het mice show signs of, and are more sensitive to, oxidative stress. In particular, they present numerous DNA strand breaks (DSBs), a strong alteration of several epigenetic marks and an abnormal expression of genes primarily in the chromatin remodelling and DNA damage response (DDR) pathways (Rekaik et al. 2015). Accordingly, following the local injection of 6-OHDA, a drug that induces oxidative stress and that mDA neurons capture specifically, wt mDA neurons exhibit similar changes in their epigenetic marks and enter cell death. Subsequent Engrailed injection into the SNpc blocks cell death and restores all examined epigenetic marks in the surviving neurons (Rekaik et al. 2015).
The latter experiments suggest that Engrailed might be important to protect mDA neurons against oxidative stress associated with normal or pathological ageing and demonstrate that part of this protection is associated with heterochromatin maintenance. Following the idea that L1 expression increases with heterochromatin loss (Wang and Elgin 2011), with age (Van Meter et al. 2014), in some neurodegenerative diseases (Tan et al. 2012) and in conditions of oxidative stress
(Giorgi, Marcantonio, and Del Re 2011), we undertook to explore a possible relationship between L1 expression and Engrailed protective activity.
Results
L1 families are expressed in adult mDA neurons
Analysis of next-generation RNA sequencing (RNA-seq) data of RNA extracted from laser microdissected SNpc from 6 week-old wt Swiss OF1 mice (Rekaik et al. 2015) (GEO accession number: GSE72321), showed that the three main active L1 families (A, Tf and Gf) are highly expressed, with a number of reads for the Tf and A subfamilies in the same order than that found for tyrosine hydroxylase (Th), a strongly expressed marker of mDA neurons (Figure 1A). This was confirmed on SNpc tissue punches by RT-qPCR, using primers in the 5’UTR of L1 Tf/Gf or L1 A (Figure 1A).
Thanks to its poly(A) tail (Doucet et al. 2015), L1 mRNA was purified from adult mouse ventral midbrain tissue on oligo-dT columns to ensure the presence of the 3’UTR, digested with DNAse and reverse transcribed with oligo-dT primers. PCR was achieved with forward and reverse primers in the 5’UTR and 3’ region of ORF2, respectively (Figure 1B). All three L1 families are detectable at the expected sizes (Figure 1B) and enzyme digestion patterns were as expected and confirmed by Sanger sequencing.
Expression of full-length L1 in the adult ventral midbrain is further demonstrated by L1 mRNA translation into protein, as shown in Figure 1C where L1 ORF1p was identified by western blot. Further, L1 expression in post-mitotic mDA neurons was verified. Figure 1D illustrates by in situ hybridization and immunohistochemistry the co-localization of TH and L1 Tf RNA and Figure 1E shows, by double immunohistochemistry, that ORF1p is present in all TH-positive mDA neurons in the SNpc. The specificity of the staining was verified by the neutralizing effect of the ORF1p polypeptide used to raise the antibody (Figure 1C
and E). Figure D and F illustrate that L1 expression in the ventral midbrain is not
exclusive to mDA neurons. Other neuronal subtypes, as identified in Figure 1F by NeuN staining, also express ORF1p. However, ORF1p staining intensity is
significantly higher in TH+ neurons compared to adjacent neurons as quantified in
Figure 1F. Figure EV1 further shows, that brain L1 expression is not limited to the
ventral midbrain but is present in other brain regions. Expression is however generally higher in neural tissues than in heart or kidney and as expected, very abundant in testis.
This series of experiments demonstrates that L1 RNA is expressed in different brain regions and that full-length L1 RNA and the ORF1 protein are expressed in post-mitotic ventral midbrain neurons and most particularly in mDA SNpc neurons. Kinetic analysis of oxidative stress-induced L1 expression and DNA damage in
vivo
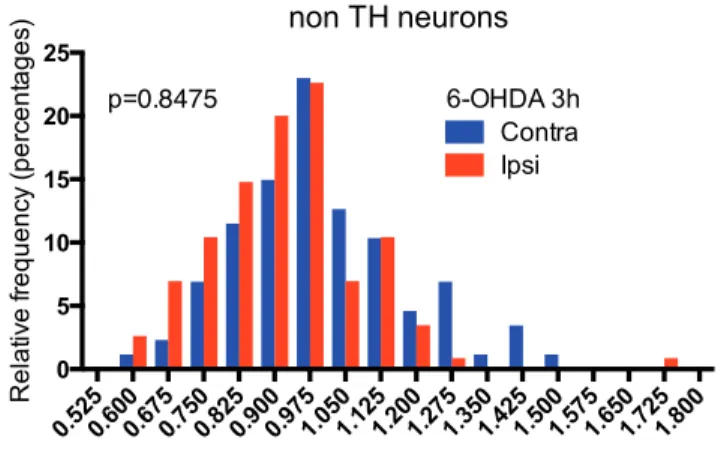
Midbrain DA neurons are particularly sensitive to oxidative stress due to sustained intrinsic activity and dopaminergic metabolism, itself a generator of oxidant molecular species (Chen et al. 2008). Following reports highlighting an induction of L1 elements upon stress in different systems (Giorgi, Marcantonio, and Del Re 2011; Rockwood, Felix, and Janz 2004), we tested whether oxidative stress modifies L1 expression in mDA neurons. 6-OHDA was injected at the level of the SNpc and immunostaining for ORF1p was quantified in mDA neurons. Figure 2A illustrates and quantifies the strong increase in L1 expression observed 3 h after stress. Figure EV2 establishes that this increase does not take place in TH-negative neurons that do not capture 6-OHDA.
To have a better idea of the kinetics we followed DNA guanine oxidation, DSB formation (γ-H2AX staining) in TH-positive cells and the increase in L1 Tf/Gf transcripts in SNpc tissue punches 15 min, 1 h and 3 h after injection of 6-OHDA.
Figure 2B demonstrates that an increase in L1 Tf/Gf expression, already observable
15 min post-stress, increases until 1 h and slightly decreases during the 2 following hours. In comparison, guanine oxidation in TH-positive cells is significantly increased 1 h post-stress and stable thereafter (Figure 2B) while DNA breaks appear after 3 h specifically on the injected side.
The expression of several stress markers was analysed in the same punch biopsies (Figure 2C). In the p53 pathway Cdkn1a expression was increased after 3 h, with no change in the expression of Puma and Trp53bp1. In the apoptosis pathway, we observed a strong and rapid (already 1 h post-stress) increase of
Gadd45b expression and a slight increase in Rel expression at 3 h, but found a small
decrease of Casp9 expression. No sign of ER-stress could be measured at any time within 3 h and Th expression was not modified confirming that no TH-cell death takes place during this frame time (Rekaik et al. 2015).
Kinetic analysis of oxidative stress-induced L1 expression and DNA damage in
vitro
In a parallel in vitro study, embryonic day 14.5 (E14.5) midbrain mouse neurons, which at this stage express engrailed but of which mDA neurons represent a small percentage, were cultured for 4 days. H2O2 was then added to the culture for
1 h, thus inducing an oxidative stress to all neurons. Because of cell death after 2 or 3 h, analysis was limited to 1 h of H2O2 exposure. We first followed L1 transcription
by FISH at different time points, and observed that L1 transcription is high already after 15 minutes of stress and stays so for at least 1 h (Figure 3A). The same result was found by RT-qPCR (Figure EV3).
As observed in vivo, DNA break formation in vitro is posterior to L1 transcription increase (Figure 3A, right panel) and the most salient increase in stress-associated genes after 1 h is that of Gadd45b (Figure 3B). Figure 3B also illustrates that Rel transcription was activated with kinetics similar to that observed in
vivo and that the main difference between the two situations is the induced
transcription of ER-stress markers in vitro.
LINE transcription is part of the H2O2-induced DNA break pathway
Following the nuclear import of the L1 ribonucleoprotein complex, the ORF2p-encoded endonuclease generates one or several nicks in the DNA and L1 RNA retrotranscription is initiated at the newly generated 3'OH terminus. The kinetics demonstrating that DSB formation is posterior to the oxidative stress-induced L1 transcriptional increase led us to envisage that part of these breaks may be a consequence of L1 overexpression.
The classical repressor pathway of L1 involves the Argonaut proteins of the Piwi family that bind piRNAs and block LINE transcription (Kuramochi-Miyagawa et al. 2008). To verify a protective effect of Piwil1 (mouse MIWI), midbrain neurons were infected with an AAV2 expressing Piwil1 and exposed to H2O2. As a negative control,
to H2O2. Figure 4A illustrates (left) and quantifies (right) the strong repression of
H2O2-induced L1 transcription (FISH analysis) and of DSB formation by AAV2-Piwil1
compared to control.
To further ascertain the ability of Piwil1 to protect midbrain neurons against oxidative stress, the protein was expressed by transfection together with GFP. This allowed us to count in the same dishes the number of γ-H2AX foci in cells expressing or not Piwil1 (based on GFP expression). As illustrated and quantified in Figure 4B, the decrease in the number of γ-H2AX foci is only seen in transfected cells. This series of experiments brings strong evidence in favour of an important implication of L1 expression in the formation of DNA breaks.
L1 expression and activity lead to oxidative stress-induced DNA damage and neuronal death
To directly evaluate if L1 activation induces DNA damage, embryonic midbrain neurons were transfected with a mouse codon-optimized L1 expression vector containing the endogenous L1 5’UTR promoter downstream of a CMV promoter (Han and Boeke 2004). As illustrated and quantified in Figure 5A, the average number of DNA breaks identified by γ-H2AX staining was increased by the expression of L1 but not by that of the same L1 expression vector carrying a double mutation abolishing ORF2p reverse transcriptase and endonuclease activities as in (Xie et al. 2011).
L1 activity requires the transcription and translation of its bi-cistronic mRNA followed by reverse transcription. To inhibit reverse transcription, we used stavudine (2′,3′-didehydro-2′,3′-dideoxythymidine, d4T), a nucleoside analog and strong reverse transcriptase inhibitor (Jones et al. 2008). We thus quantified the inhibitory activity of stavudine on DNA break formation induced either by L1 overexpression (Figure 5A) or H2O2 addition (Figure 5B). A similar inhibition of DNA break formation induced by
H2O2 was obtained by transfecting embryonic midbrain neurons with a siRNA
directed against ORF2p but not with a control siRNA (Figure 5C).
A protective effect of stavudine was also obtained in vivo in the 6-OHDA experimental paradigm. Indeed, the results of Figure 5D demonstrate that the injection of stavudine, 30 min before and at the same time as 6-OHDA, strongly protects against mDA neuron death measured 24 h later. In a similar experiment, the anti-ORF2p siRNA linked to the cell permeable peptide Penetratin was infused for 3 days at the level of the SNpc before an acute 6-OHDA injection. Figure 5E
demonstrates the protective effect of the anti-ORF2p siRNA and Appendix Figure S1 confirms, using the ORF2p antibody, the efficiency of this strategy to block L1 expression in vivo.
Engrailed is a direct repressor of L1 expression
Adult mDA neurons from En1-het mice present an enhanced rate of progressive cell death starting at 6 weeks of age (Sonnier et al. 2007). At this time all neurons are still present but abnormal nuclear phenotypes are observed, including DNA damage and the loss of heterochromatin marks (Rekaik et al. 2015). In a previous study, we reported that En2 internalization strongly protects midbrain neurons in culture and mDA neurons in vivo against H2O2- and 6-OHDA-induced stress, respectively. In
view of the data presented above, we decided to investigate if protection by Engrailed could, in part, be due to L1 repression by this transcription factor. The in
vitro experiments of Figure 6A support this idea. Indeed, the DNA breaks provoked
by L1 over-expression are not formed if the cells have been treated with recombinant En2 (Figure 6A) and L1 transcription (FISH analysis) induced by H2O2 treatment is
also strongly repressed by En2 (Figure 6B).
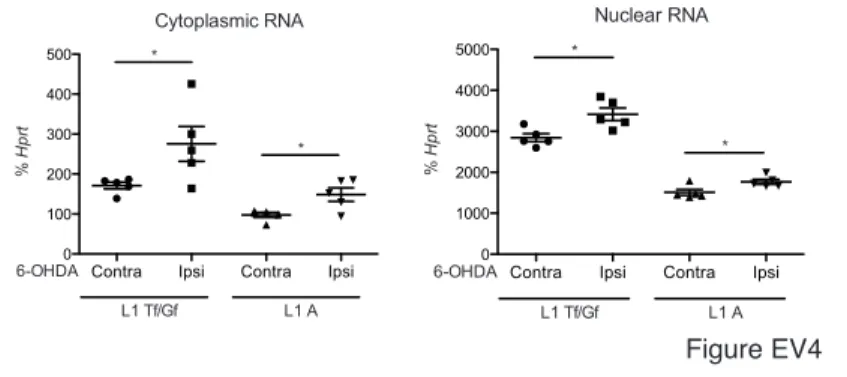
In the in vivo paradigm, Figure 6C demonstrates the repressive effect of En2 injected in the SNpc on L1 Tf and L1 A transcription after an acute oxidative stress in the SNpc. Repression takes place after 6 h in the presence of cycloheximide (CHX), a potent inhibitor of translation, and is thus probably direct, although a structural chromatin change or an RNA intermediate cannot be totally precluded. This repression erases the increase in L1 transcription observed after 6-OHDA injection (Figure EV4).
Engrailed is primarily a transcriptional repressor. To further verify a direct regulation of L1 transcription, an activator form of Engrailed (EnHD-VP64) constructed by fusing its homeodomain to a tetramerized Herpes virus activator domain (Rekaik et al. 2015) was added to midbrain neurons in culture or injected in the SNpc, in the presence of CHX. Figure 6D demonstrates that EnHD-VP64 activates L1 transcription, both in vitro and in vivo, thus behaving as an anti-Engrailed, and further supporting a direct transcriptional regulation of L1 expression by Engrailed. Accordingly, it has been previously reported that EnHD-VP64 infused in the SNpc activates the formation of DSBs and induces mDA neuron death (Rekaik et al. 2015).
Three putative Engrailed binding sites in the 5’UTR of the consensus L1 Tf (Genbank: AF016099.1) were identified by in silico analysis, allowing for the design of primers spanning two of the predicted binding sites. We used one putative Engrailed-binding domain present in the L1 5’UTR to design a gel shift experiment.
Figure 6E illustrates that En2 binds this domain and that this binding is displaced by
the addition of NP6 (a competing multimerized Engrailed binding site (Desplan, Theis, and O'Farrell 1988), thus specific. Finally, nuclei from primary midbrain neurons were incubated with En2, with poly(dI-dC) or NP6, and the chromatin was immunoprecipitated with an anti-En1/2 antibody (Di Nardo et al. 2007). Figure 6F shows that the antibody specifically pulls down DNA fragments of the 5'UTR of L1 Tf/Gf and L1 A families containing the putative En1/2 binding site.
All in all, we conclude from this series of experiments that Engrailed is a direct repressor of L1 expression in the adult midbrain, strongly suggesting that part of the protective Engrailed activity against oxidative stress-induced DNA breaks is through direct L1 repression.
Piwil1 expression decreases mDA neuron cell death in En1-het mice
The direct repression of L1 by Engrailed made it plausible that the progressive mDA neuron loss observed in En1-het mice, and starting at 6 weeks of age, involves a partial de-repression of L1 transcription in these neurons. This led us to analyze L1 expression in these mice. RNA-seq data from laser microdissected SNpc (Rekaik et al. 2015) was mapped onto a consensus L1 Tf sequence (L1spa; Genbank AF016099.1). Figure 7A demonstrates an increase in the number of reads in 6-week-old En1-het mice compared to wt siblings. Expression at 6 weeks in both genotypes was verified by RT-qPCR on laser-captured SNpc, VTA and cortex, showing a specific up-regulation of L1 Tf/Gf RNA (Figure 7B) and L1 A (Figure EV5, p=0.054) in the SNpc. ORF1p increase in En1-het mice was confirmed by immunohistochemistry as shown and quantified in Figure 7C.
To further verify if the progressive death of mDA neurons in En1-het mice is a consequence of L1 enhanced expression, an AAV8 encoding Piwil1, or mCherry as a control, was injected in the ventral midbrain of En1-het mice at 5 weeks of age and the animals were analyzed at 9 weeks. Figure 7D illustrates the expression of exogenous Piwil1 in infected mDA neurons and Figure 7E quantifies the decrease in ORF1p expression in mDA neurons overexpressing Piwil1. To verify that this
Piwil1-induced decrease in L1 expression could protect against the slow degeneration observed in En1-het mice, the number of surviving TH-positive neurons was quantified. As reported before (Sonnier et al. 2007), the number of mDA neurons at 9 weeks is reduced by more than 20% in En1-het mice compared to wt siblings, both groups being injected with an AAV8-mCherry (Figure 7F). In the same experiment, injection of En1-het mice with an AAV8 Piwil1 rescues a significant number of mDA neurons, confirming that part of mDA cell death observed in En1-het mice is triggered by L1 overexpression.
Discussion
In this study, we have observed that the three main L1 families are expressed in the central nervous system, in particular in post-mitotic nerve cells, including mDA neurons of the ventral mesencephalon. This physiological expression is increased upon oxidative stress and responsible, at large, for the DNA breaks induced by this stress. Using the En1-het mouse genetic model where mDA neurons from the SNpc degenerate progressively starting at 6 weeks of age, we find that L1 expression is increased in mutant animals compared to wt siblings. The direct repressive activity of Engrailed on L1 transcription and experiments demonstrating that L1 overexpression impinges on mDA neuron physiology and survival lead us to propose that the protective activity of Engrailed reported in earlier studies partly involves its ability to repress L1 transcription.
L1 expression in the nervous system has been reported before (Thomas, Paquola, and Muotri 2012). A striking result is their activity during development and in adult neural stem cells, providing a basis for neuronal genetic mosaicism (Singer et al. 2010). The significance of this mosaicism is not yet understood, but given the Darwinian somatic selection exerted on neuronal progenitor cells, it is possible that the survivors may have a selective advantage. What is reported here is a strong basal L1 expression in post-mitotic mammalian neurons. Indeed, not all the RNA species sequenced or amplified by RT-qPCR are necessarily full-length or present in neuronal cells, but it is clear that nerve cells do express full-length L1 RNAs and also ORF1p, as demonstrated by western blot, in situ hybridization and immunohistochemistry. It is particularly striking that mDA neurons in the ventral
midbrain are co-stained with the TH and the ORF1p antibody and show a higher intensity of ORF1p expression compared to adjacent non-dopaminergic neurons.
L1 expression must be regulated as uncontrolled expression is a thread to genome integrity. The Piwi Argonaut family plays in this context an important role (Malone et al. 2009; Malone and Hannon 2009; Pezic et al. 2014). However, other situations and factors in other cellular contexts have been shown to exert such regulation. A first level of regulation is through the modification of chromatin domains. Many genetic L1 sequences are compacted in heterochromatin regions and their expression is thus repressed. Accordingly, it is well established that L1 expression is regulated by all events that can, inside and outside of the nervous system, modify the extent of heterochromatin (Van Meter et al. 2014; Skene et al. 2010). In keeping with the nervous system, an interesting recent example is provided by a cocaine-induced change in heterochromatic H3K9me3 and the ensuing unsilencing of repetitive elements in the nucleus accumbens (Maze et al. 2011). The same correlation was reported at the level of the hippocampus (Hunter et al. 2012). Among the factors that can modify chromatin organization are ageing and oxidative stress (López-Otín et al. 2013; Oberdoerffer and Sinclair 2007; De Cecco et al. 2013). Accordingly, it was shown in the fly and in the mouse that ageing is associated with an enhanced expression of mobile elements that can contribute to the formation of DNA breaks and genome instability (Maxwell, Burhans, and Curcio 2011; Laurent, Hammell, and McCaffrey 2010; Chow and Herrup 2015). The present study adds to the concept by showing that oxidative stress increases L1 expression in vivo and in vitro and that a siRNA designed against ORF2p, but also affecting ORF1p synthesis probably because of the polycistronic nature of the L1 transcript, blocks the formation of DSBs and cell death induced by the stress. The same protection in vivo is provided by stavudine and Piwil1 overexpression.
Some factors can act on gene expression both by modifying chromatin structure and by direct regulation. Direct regulation was shown for p53 and SIRT6, two proteins involved in the regulation of ageing (Van Meter et al. 2014; Wylie et al. 2016) and it must be noted that L1 repression by SIRT6 fails with age and stress (Van Meter et al. 2014). The present study identifies the homeoprotein Engrailed as a direct regulator of L1 transcription. Indeed, we have shown earlier that Engrailed protects mDA neurons against age-related progressive oxidative stress, as well as against an acute stress provoked by the local injection of 6-OHDA at the level of the
SNpc (Rekaik et al. 2015). In the latter study, it was shown that Engrailed restores all studied heterochromatin marks, including MeCP2, H3K9me3, H3K27me3 as well as the nucleolar marker Nucleolin. It can thus be proposed that protection by Engrailed involves the repression of L1 expression in part through heterochromatin maintenance (Rekaik et al. 2015) and in part through direct transcriptional repression as clearly demonstrated by the experiments described in Figure 6. Indeed chromatin changes and direct repression are not mutually exclusive as the direct binding of Engrailed to the 5’UTR of L1 might induce heterochromatin nucleation, similarly to Pax3 and Pax6 homeoproteins that regulate chromatin states through their binding to intergenic major satellite repeats (Bulut-Karslioglu et al. 2012).
Engrailed protects mDA neurons in three pharmacological models of PD by a mechanism involving the regulation of the translation of mitochondrial complex I mRNAs (Alvarez-Fischer et al. 2011). More recently the same transcription factor was shown to save the same neurons, following an acute oxidative stress, through its ability to restore a healthy epigenetic state (Rekaik et al. 2015). The present study now demonstrates that Engrailed controls mDA cell physiology and survival through the regulation of LINE transcription, thus adding an additional facet to its curative activity. Protection mediated by L1 repression made it plausible to block 6-OHDA-induced cell death with L1 inhibitors. Indeed, this was shown with the siRNA designed against ORF2p, with the anti-L1 protein Piwil1, but also with stavudine, a reverse transcriptase inhibitor. We can only speculate on how stavudine works, but a sensible hypothesis is that blocking reverse transcription after the first nick is made allows a better access of repair enzymes at the chromatin level.
Given that, as demonstrated here, anti-L1 activity is sufficient to partially prevent oxidative-stress induced neuronal cell death, it is conceivable that L1-mediated genetic instability via the generation of DNA strand breaks is a general driver of cell death in age-related diseases and neurodegeneration. In a preceding report, we demonstrated that mDA neurons from En1-het mice are more sensitive than their wt siblings to age-associated oxidative stress, leading to a progressive death of this specific cell type (Rekaik et al. 2015). The demonstration that in vivo Piwil1 overexpression partially protects against mDA neuron death in En1-het mice not only lends weight to the idea that En1 activity is through the control of L1 expression, but also suggests that age-associated oxidative stress and neurodegeneration involves L1 expression. This is indeed possible as we observe L1
expression in non-dopaminergic ventral midbrain neurons and the presence of L1 mRNA in all tested brain regions. Thus, repressors other that Engrailed might operate to control L1 expression in different regions of the central nervous system.
The analysis of L1 expression in different structures demonstrates a basal, thus physiological, level of expression in all regions examined. It can thus be proposed that L1 expression becomes toxic only after a given threshold has been reached due to an endogenous (e.g. oxidative) or environmental (e.g. toxic agent) stress. Homeoproteins are expressed throughout the adult brain and Otx2 has a protective effect at the level of the eye (Torero Ibad et al. 2011; Bernard et al. 2014) and of the SNpc (Rekaik et al. 2015). It is thus tempting to speculate that other transcription factors of this family can repress the expression of mobile elements and thus behave like anti-ageing proteins in normal and pathological situations.
Material and methods Animals.
Mice were treated as defined by the guidelines for the care and use of laboratory animals (US National Institute of Health) and the European Directive 2010/63/UE. All experimental procedures were validated by the ethical committee (CEA 59) of the French Ministry for Research and Education. Swiss OF1 wt (Janvier) and En1-het mice (Hanks et al. 1995) were maintained under a 12 h day / night cycle with ad libitum access to food and water. A maximum of 6 mice was housed in one cage and cotton material was provided for mice to build a nest. Experimental groups consisted of 3 to 8 male mice at the indicated ages. Sample size calculations were based on previous experiments. No randomization or blinding was used.
Tissue dissection.
Where indicated, the SNpc of wt and En1-het mice was isolated by Laser Capture Microdissection (LMD7000, Leica) as in (Rekaik et al. 2015). Samples from 4 animals per group were analyzed. For punch biopsies of the SNpc, brains were put into a brain slicer, covered with Tissue Tek O.C.T. (Sakura Finetek) and frozen on dry ice. A 2 mm slice encompassing the SNpc was excised (-2 to -4 mm/-2.5 to -4.5 caudal from the Bregma) and placed on a cold cover slide with the caudal side facing up.
The stereotaxic arm holding the tissue punch was zeroed on the aqueduct and two biopsies of the SNpc were taken at -/+1.3 (M/L) and -2 (A/P).
In vivo treatments.
For injections, mice were placed in a stereotaxic instrument and a burr hole was drilled into the skull 3.3 mm caudal and 1 mm lateral to the bregma. The needle was lowered 4 mm from the surface of the skull and 6-OHDA (2 µl; 0.5 µg/µl Sigma) injections were performed over 4 min. For Engrailed rescue experiments, a solution (2 µl) of bacterial recombinant En2 (300 ng; 4 µM) and colominic acid (3 µg) 19 or vehicle (NaCl 0.9%) and colominic acid was injected 30 min after 6-OHDA injection using the same coordinates. When indicated, CHX (0.1 µg/µl, Sigma) was added. Stavudine (d4T, 10 µM, Sigma) was injected 30min before and at the same time as 6-OHDA. For Piwil1 overexpression, we used an AAV8-Piwil1 or an AAV8-mCherry virus injected using the same coordinates. SNpc tissues for RT-qPCR and Western blot analysis were obtained from punch biopsies. For siRNA experiments, osmotic mini-pumps (Alzet) with 100 µl of a solution containing cell-permeable peptide Penetratin-coupled siRNA (5 µM) and colominic acid (1.5 µg/µl) in 0,9% NaCl were implanted for three days at the following coordinates: 1 mm (medio/lateral), -3.3 mm (anterior/posterior) and -3.8 mm (dorso/ventral) from Bregma. Mice were then anaesthetized and perfused for TH immunostaining.
Cell culture.
Midbrain primary neurons were dissected from E 14.5 embryos and cultured in Neurobasal medium (Life Technologies) supplemented with glutamine (500 µM, Sigma), glutamic acid (3.3 mg/l Sigma) aspartic acid (3.7 mg/l, Sigma), anti-anti (Gibco) and B27 (Gibco). Cells were treated with H202 (100 µM) for 1 h or as
indicated and either RNA was extracted or cells were fixed for immunochemistry. Time points in the RT-qPCR time course experiment correspond to: sham = 0 and 5min; 30min = 15 min and 30 min; 1hr = 45min and 75 min. Transfections were done by preincubating plasmids (0.75 µg per transfection) with 8 µl lipofectamine “2000 (Life Technologies) for 20 min at RT in Optimem medium (Life Technologies). The mix was then added to the cells for 48 h at 37°C. The plasmids used to express mouse wt L1 (pWA-125) and mutated (pWA-126) contain a codon-optimized L1 with
its endogenous 5’UTR, an upstream CMV promoter and a retrotransposition-dependent GFP expression cassette (Xie et al. 2011). pCMV-Piwil1 was purchased from Origene (MR222484); pCMV, a void plasmid, was used as a negative control. A pEGFP plasmid was co-transfected in all cases. The AAV2 viruses (6.106 TU/well of a 24 well plate) expressing Piwil1 and GFP under the control of the Synapsin promoter were purchased from Vector BioLabs. Seven days after transduction, cells were treated for 1 h with H202 and fixed. Where indicated, midbrain primary neurons
were treated with stavudine (10 µM) for 16 h, treated with H202 in the presence of
stavudine for 1 h and fixed. Cells were treated where indicated by adding recombinant En2 diluted in culture medium to the culture wells at a concentration of 500ng/µl (15nM).
Chromatin immunoprecipitation.
Nuclei from midbrain primary neurons were incubated in a cytoplasm lysis buffer (10 mM HEPES, 40 mM KCl, 1 mM CaCl2, 0.5% NP-40) for 10 min on ice and washed
twice (same buffer without NP-40) by centrifugation for 10 min at 800g, at 4°C. Nuclei were then treated 20 min at 37°C with En2 (500 ng/ml), sham (0.9% NaCl) and poly(dI-dC) (Sigma, 50 ng/µl) or NP6 (0,4 pmol/µl). NP6 oligonucleotide is composed of six-times the En binding sequence TCAATTAAATGA. Nuclei were then fixed in 1% formaldehyde (Sigma) in PBS. The Magna ChIP kit (Millipore) was used for chromatin purification. Immunoprecipitations were performed with 1 µg of anti-En antibody (86/8, in-house rabbit polyclonal) or 1 µg of rabbit IgG (Millipore) overnight at 4°C on a rotating wheel. Immunoprecipitated DNA was analyzed by qPCR, with the same primers used for RT-qPCR.
RNA-seq data.
RPM values from the RNA-seq experiment reported previously (Rekaik et al. 2015) are deposited at GEO under the accession number GSE72321.
RNA-seq data alignment against a consensus L1 Tf sequence was performed using R software. Individual wt and En1-het reads were aligned using pairwise alignment function and plotted on a normalized coverage graph.
RT-qPCR.
Total RNA from laser microdissected tissue was extracted using the AllPrep DNA/RNA Micro Kit (Qiagen) followed by DNase I digestion using the RNeasy MinElute Cleanup protocol for on-column DNAse I treatment, followed by RT-qPCR. Total RNA from SNpc biopsies was extracted using the RNeasy Lipid Tissue kit (Qiagen) followed by DNase I (Thermo) digestion. For in vitro RNA analysis RNA was extracted using the RNeasy kit (Qiagen). RNA (200 ng) was reverse transcribed using the QuantiTect Reverse Transcription kit (Qiagen). RT-qPCR was performed using SYBR-Green (Roche Applied Science) on the light cycler 480 (Roche Applied Science). The primers used for RT-qPCR are indicated in Appendix Table S1. Data were analyzed using the ddCt method and values normalized to Hypoxanthine-guanine phosphoribosyltransferase (Hprt) and/or Glyceraldehyde 3-phosphate dehydrogenase (Gapdh).
RT-PCR and sequencing.
RNA from adult ventral midbrain tissue was extracted using the AllPrep DNA/RNA/Protein Extraction Kit (Qiagen). RNA (1 µg) was incubated with DNAse I (Thermo) for 30 min at 37°C and inactivated by EDTA for 10 min at 65°C. RNA was then passed on poly(A)+ columns (Qiagen) to purify poly(A)+ RNA and reverse transcribed using Superscript II (Invitrogen) and oligo(dT) primer. PCR was then performed using the Phusion Taq polymerase (NEB) and GC-buffer using the primers indicated in Appendix Table S1. PCR conditions were as follows: 98°C 30s, then 40 cycles of 98°C 10s, 63°C 30s, 72°C for 2.4 min, followed by a final extension at 72°C for 10 min. The L1 A amplicons were verified by enzymatic digestion (BamHI, NcoI, PstI). All PCR products were excised, purified and analyzed by sequencing (MWG-Biotech).
Immunostaining.
Immunostainings were done as described earlier (Alvarez-Fischer et al. 2011). The following primary antibodies used: are described in Appendix Table S1 mouse anti-γ-H2AX, 1:200 (Millipore), chicken anti-TH, 1:500 (Abcam), guinea-pig ORF1p (09), 1:200 (in-house), rabbit MIWI (=Piwil1), 1:300 (Cell Signaling) NeuN (Millipore), 1:300. Secondary antibodies were: 488 chicken, 647 chicken, 488 anti-mouse, 546 anti-mouse Alexa Fluor (Life Technologies). Labeled sections were
imaged by confocal microscopy (SP5, Leica). Visible TH immunohistochemistry was done as described earlier (Rekaik et al. 2015). Images were taken on a Nikon Eclipse 90i microscope.
Cell counting and stereology.
Serial sections (30 µm) of mouse ventral midbrains encompassing the SNpc were cut on a freezing microtome and TH immunostaining (Immunostar, monoclonal mouse; 1:1,000) was done as described above. Unbiased stereological TH cell counting was done after Piwil1/mCherry overexpression in En1-het mice and wildtype littermates (En1-het + AAV8-EF1a-mCherry (n=8) or AAV8-EF1a-mPiwil1 (n=7) and wt littermates with AAV8-EF1a-mCherry (n=6)). Eight to ten sections per animal were analysed (every third section of serial sections encompassing the entire SNpc). Counting was done blinded. Parameters used (Stereo Investigator Software (Micro Bright Field) on a Nikon E800 microscope) were as follows: The counting frame area was 8100 µm2, the sampling grid area was 20445 µm2. The mean of total markers counted was 353±63. The mean number of sampling sites was 174±29. The disector height was 22 µm and guard zone distance was 1.5 µm. The mean coefficient of error (Gunderson m=1) was 0.06±0.01. Standard deviation errors (±) are reported. TH cell counting in conditions comparing ipsi- (treated) and contralateral (non-treated) sides were done as follows: For every brain, a minimum of 4 serial sections was stained and the number of TH cells was counted in the SNpc of both, ipsi- and contralateral sides. An ipsi/contra ratio was calculated for each section, and the resulting mean of 4 sections was used to quantify the difference between the TH cell number of the ipsi- and contralateral side of the same animal.
ORF1p antibody production.
ORF1p polyclonal antibodies (rabbit and guinea pig) were produced using the speed 28-day protocol (Eurogentec) after injection of the recombinant full-length ORF1 protein (Eurogenix). The final bleeds were then subjected to a protein-A purification step. The rabbit antibody was used for the detection of the ORF1p protein in Western blots and the guinea pig was used in immunostainings.
Western blots were performed as described earlier (Rekaik et al. 2015). ORF1p rabbit antibody was used at a concentration of 1:500. Blots were quantified using ImageJ with actin (actin-HRP, 1:20000, Sigma) as a reference. To determine specificity, the antibody was blocked with the ORF1p peptide (2 molecules of peptide per molecule of antibody) for 3h on a rotating wheel at room temperature and diluted for western blot or immunofluorescence experiments.
Image quantification.
Quantifications of immunofluorescence were performed using a 63X or 40X magnification and 1 or 5 µm-thick successive focal planes, for γ-H2AX and ORF1p staining, respectively. For each experiment, image acquisition of all slices was performed during a single session with the same parameter set-up of the confocal microscope to allow for comparison between experimental conditions. Images were taken and analysed by the same experimenter using ImageJ software with the same automated workflow for all experimental conditions. For γ-H2AX staining, individual foci were quantified for each neuron. After background subtraction, ORF1p staining in wt, En1-het and 6-OHDA injected mice was quantified by measuring fluorescence intensity in TH+ or TH- cells, and by plotting values in a relative frequency distribution histogram.
In situ hybridization.
Mice were anaesthetized, perfused with PBS in RNAse-free conditions and frozen in isopentane (embedded in TissueTek O.C.T). Brain slices (20 µm) were fixed in 4% PFA in PBS for 10 min at RT then permeabilized twice for 10 min in RIPA buffer (150 mM NaCl, 1% NP-40, 0.5% Na deoxycholate, 0,1% SDS, 1 mM EDTA, 50 mM Tris-HCl pH 8). Brain sections were fixed again for 5 min, demasked for 10 min with TEA buffer (Triethanolamine 100 mM, 0.8% acetic acid pH 8) containing 0.25% acetic anhydride, permeabilized for 30 min in PBS with 1% triton X-100 and blocked for 1 h in hybridization buffer (50% formamide, 5x SSC, 5x Denhardt (1% Ficoll, 1% SSC, 1% tween 20), 500 µg/ml Salmon sperm DNA, 250 µg/ml yeast tRNA). Slides were incubated overnight with a total 10 nM mix of six digoxygenin (DIG) labeled oligonucleotide probes in hybridization buffer at 37°C (DIG Oligonucleotide 3'-End Labeling Kit, 2nd generation, Roche). Probes sequences are indicated in Appendix
Table S1. Sections were rinsed with FAM/SSC (50% formamide, 2x SSC, 0.1% tween 20) twice 30 min at 37°C, then twice in 0.2X SCC at 42°C, blocked in B1 buffer (100 mM maleic acid pH 7.5, 150 mM NaCl) with 10% fetal bovine serum (FBS) for 1 h and incubated overnight at 4°C in B1 buffer with an anti-DIG antibody coupled to alkaline phosphatase (Roche, 1:2,000). After three washes in B1 buffer and one wash in B3 buffer (100 mM Tris-HCl pH9, 50 mM MgCl2, 100 mM NaCl, 0.1% Tween
20), slides were stained using the NBT/BCIP kit (Vector lab), rinsed with PBS and immunostained for TH. In situ hybridization in primary neurons was done using an adaptation of the same protocol. The same buffers were used, but probes were detected with an anti-DIG antibody coupled to horseradish peroxidase (Roche, 1:1,000). RNA staining was revealed using the TSA-cyanine 3 system (Perkin Elmer) according to the manufacturer’s protocol.
In silico analysis.
En1/2 binding sites in the consensus L1Tf 5’UTR sequence (Genbank: AF016099.1) were analyzed in silico using Allgen-Promo 3.0 with a 15% maximum matrix dissimilarity rate. Binding sites for En1 were found at position 1,877-1,883 -> CTTTGT, 2,965-2,971->ACAAGA and 3,091-3,097->ACAATC.
EMSA.
Biotinylated oligonucleotide probes (100 pmol/µl) were annealed in a 1:1 molar ratio in boiling water for 5 min and slowly cooled down to room temperature. Biotin-labeled double-stranded DNA fragments (200 fmol) with the predicted En binding site were incubated with 400 nM recombinant En2 protein in a final volume of 20 µl with the Light Shift Chemiluminescent EMSA kit (Thermo Scientific) in the presence of 1 µg poly(dI-dC), 5 mM MgCl2, 2.5% glycerol and 1 µg BSA. After incubation for 20 min on ice, DNA-protein complexes were analyzed by gel electrophoresis on 6% polyacrylamide gels in 0.5x TBE buffer and transferred to a positively charged nylon membrane (Roche). Transferred DNA was cross-linked by UV-light at 120 mJ/cm2 for
1 min and detected by chemiluminescence. For competition experiments, a 200-fold molar excess of double-stranded unlabeled NP6 was added. The sequences of oligonucleotide probes are indicated in Appendix Table S1.
The definition of replicates is stated in each figure legend. Unless otherwise stated, the graphs represent the mean of the replicates. Error bars, values of n and confidence intervals are as stated in the figure legends. Results were considered as statistically different if the p-value was inferior to 0.05; in other cases, the exact p value is given. An experimental unit consisted, if not otherwise indicated, of a single animal or a single culture well. Parametric tests assume a normal distribution, which we tested by using a Kolmogorov-Smirnov test for normality and Fisher’s tests were used for comparing variances. All statistical analyses were done with the software Prism.
References
Alho, Ana Tereza Lorenzo, Claudia Kimie Suemoto, Lívia Polichiso, Edilaine Tampellini, Kátia Cristina Oliveira, Mariana Molina, Glaucia Aparecida Bento Santos, et al. 2015. “Three-Dimensional and Stereological Characterization of the Human Substantia Nigra During Aging.” Brain Structure and Function 221 (7). Springer Berlin Heidelberg: 3393–3403. doi:10.1007/s00429-015-1108-6. Alvarez-Fischer, Daniel, Julia Fuchs, François Castagner, Olivier Stettler, Olivia
Massiani-Beaudoin, Kenneth L Moya, Colette Bouillot, et al. 2011. “Engrailed Protects Mouse Midbrain Dopaminergic Neurons Against Mitochondrial Complex I Insults.” Nature Neuroscience 14 (10): 1260–66. doi:10.1038/nn.2916.
Bernard, C, H T Kim, R Torero Ibad, E J Lee, M Simonutti, S Picaud, D Acampora, et al. 2014. “Graded Otx2 Activities Demonstrate Dose-Sensitive Eye and Retina Phenotypes.” Human Molecular Genetics 23 (7): 1742–53.
doi:10.1093/hmg/ddt562.
Brouha, Brook, Joshua Schustak, Richard M Badge, Sheila Lutz-Prigge, Alexander H Farley, John V Moran, and Haig H Kazazian. 2003. “Hot L1s Account for the Bulk of Retrotransposition in the Human Population..” Proceedings of the National
Academy of Sciences of the United States of America 100 (9): 5280–85.
doi:10.1073/pnas.0831042100.
Bulut-Karslioglu, Aydan, Valentina Perrera, Manuela Scaranaro, Inti Alberto de la Rosa-Velazquez, Suzanne van de Nobelen, Nicholas Shukeir, Johannes Popow, et al. 2012. “A Transcription Factor-Based Mechanism for Mouse
Heterochromatin Formation..” Nature Structural & Molecular Biology 19 (10): 1023–30. doi:10.1038/nsmb.2382.
Chen, Linan, Yunmin Ding, Barbara Cagniard, Amber D Van Laar, Amanda Mortimer, Wanhao Chi, Teresa G Hastings, Un Jung Kang, and Xiaoxi Zhuang. 2008.
“Unregulated Cytosolic Dopamine Causes Neurodegeneration Associated with Oxidative Stress in Mice..” Journal of Neuroscience 28 (2): 425–33.
doi:10.1523/JNEUROSCI.3602-07.2008.
Chow, Hei-man, and Karl Herrup. 2015. “Genomic Integrity and the Ageing Brain..”
Nature Reviews Neuroscience 16 (11): 672–84. doi:10.1038/nrn4020.
Collier, Timothy J, Jack Lipton, Brian F Daley, Stephane Palfi, Yaping Chu, Caryl Sortwell, Roy A E Bakay, John R Sladek Jr., and Jeffrey H Kordower. 2007. “Aging-Related Changes in the Nigrostriatal Dopamine System and the Response to MPTP in Nonhuman Primates: Diminished Compensatory
Mechanisms as a Prelude to Parkinsonism.” Neurobiology of Disease 26 (1): 56– 65. doi:10.1016/j.nbd.2006.11.013.
Cruickshanks, Hazel A, and Cristina Tufarelli. 2009. “Isolation of Cancer-Specific Chimeric Transcripts Induced by Hypomethylation of the LINE-1 Antisense Promoter.” Genomics 94 (6). Elsevier Inc.: 397–406.
doi:10.1016/j.ygeno.2009.08.013.
De Cecco, Marco, Steven W Criscione, Abigail L Peterson, Nicola Neretti, John M Sedivy, and Jill A Kreiling. 2013. “Transposable Elements Become Active and Mobile in the Genomes of Aging Mammalian Somatic Tissues..” Aging 5 (12): 867–83. doi:10.18632/aging.100621.
de Koning, A P Jason, Wanjun Gu, Todd A Castoe, Mark A Batzer, and David D Pollock. 2011. “Repetitive Elements May Comprise Over Two-Thirds of the Human Genome..” PLoS Genetics 7 (12): e1002384.
doi:10.1371/journal.pgen.1002384.
Desplan, C, J Theis, and P H O'Farrell. 1988. “The Sequence Specificity of Homeodomain-DNA Interaction..” Cell 54 (7): 1081–90.
Di Nardo, Ariel A, Stéphane Nedelec, Alain Trembleau, Michel Volovitch, Alain Prochiantz, and Maria Luz Montesinos. 2007. “Dendritic Localization and Activity-Dependent Translation of Engrailed1 Transcription Factor..” Molecular and
Cellular Neurosciences 35 (2): 230–36. doi:10.1016/j.mcn.2007.02.015.
Doucet, Aurélien J, Jeremy E Wilusz, Tomoichiro Miyoshi, Ying Liu, and John V Moran. 2015. “Poly(a) Tract Is Required for LINE-1 Retrotransposition.” Molecular
Cell, November. Elsevier Inc., 1–15. doi:10.1016/j.molcel.2015.10.012.
Erwin, Jennifer A, Maria C Marchetto, and Fred H Gage. 2014. “Mobile DNA Elements in the Generation of Diversity and Complexity in the Brain..” Nature
Reviews Neuroscience 15 (8): 497–506. doi:10.1038/nrn3730.
Giorgi, Gianfranco, Pamela Marcantonio, and Brunella Del Re. 2011. “LINE-1 Retrotransposition in Human Neuroblastoma Cells Is Affected by Oxidative Stress..” Cell and Tissue Research 346 (3): 383–91. doi:10.1007/s00441-011-1289-0.
Goodier, J L, E M Ostertag, K Du, and H H Kazazian. 2001. “A Novel Active L1 Retrotransposon Subfamily in the Mouse..” Genome Research 11 (10): 1677–85. doi:10.1101/gr.198301.
Grandi, Fiorella C, James M Rosser, Simon J Newkirk, Jun Yin, Xiaoling Jiang, Zhuo Xing, Leanne Whitmore, et al. 2015. “Retrotransposition Creates Sloping Shores: a Graded Influence of Hypomethylated CpG Islands on Flanking CpG Sites..”
Genome Research 25 (8): 1135–46. doi:10.1101/gr.185132.114.
Han, Jeffrey S, and Jef D Boeke. 2004. “A Highly Active Synthetic Mammalian Retrotransposon..” Nature 429 (6989): 314–18. doi:10.1038/nature02535. Han, Jeffrey S, and Jef D Boeke. 2005. “LINE-1 Retrotransposons: Modulators of
Quantity and Quality of Mammalian Gene Expression?.” BioEssays : News and
Reviews in Molecular, Cellular and Developmental Biology 27 (8): 775–84.
doi:10.1002/bies.20257.
Hanks, M, W Wurst, L Anson-Cartwright, A B Auerbach, and A L Joyner. 1995. “Rescue of the en-1 Mutant Phenotype by Replacement of en-1 with en-2..”
Science (New York, N.Y.) 269 (5224): 679–82.
Hunter, Richard G, Gen Murakami, Scott Dewell, Ma'ayan Seligsohn, Miriam E R Baker, Nicole A Datson, Bruce S McEwen, and Donald W Pfaff. 2012. “Acute Stress and Hippocampal Histone H3 Lysine 9 Trimethylation, a Retrotransposon Silencing Response..” Proceedings of the National Academy of Sciences of the
United States of America 109 (43): 17657–62. doi:10.1073/pnas.1215810109.
Joliot, Alain, and Alain Prochiantz. 2004. “Transduction Peptides: From Technology to Physiology..” Nature Cell Biology 6 (3): 189–96. doi:10.1038/ncb0304-189. Jones, R Brad, Keith E Garrison, Jessica C Wong, Erick H Duan, Douglas F Nixon,
and Mario A Ostrowski. 2008. “Nucleoside Analogue Reverse Transcriptase Inhibitors Differentially Inhibit Human LINE-1 Retrotransposition..” PloS One 3 (2): e1547. doi:10.1371/journal.pone.0001547.
Kalia, Lorraine V, and Anthony E Lang. 2015. “Parkinson's Disease..” Lancet, April. doi:10.1016/S0140-6736(14)61393-3.
Kuramochi-Miyagawa, Satomi S, Toshiaki T Watanabe, Kengo K Gotoh, Yasushi Y Totoki, Atsushi A Toyoda, Masahito M Ikawa, Noriko N Asada, et al. 2008. “DNA Methylation of Retrotransposon Genes Is Regulated by Piwi Family Members MILI and MIWI2 in Murine Fetal Testes..” Genes & Development 22 (7): 908–17. doi:10.1101/gad.1640708.
Lander, E S, L M Linton, B Birren, C Nusbaum, M C Zody, J Baldwin, K Devon, et al. 2001. “Initial Sequencing and Analysis of the Human Genome..” Nature 409 (6822): 860–921. doi:10.1038/35057062.
Lathe, Richard, and Alyson Harris. 2009. “Differential Display Detects Host Nucleic Acid Motifs Altered in Scrapie-Infected Brain.” Journal of Molecular Biology 392 (3). Elsevier Ltd: 813–22. doi:10.1016/j.jmb.2009.07.045.
Laurent, Georges St, III, Neil Hammell, and Timothy A McCaffrey. 2010. “Mechanisms of Ageing and Development.” Mechanisms of Ageing and
Development 131 (5). Elsevier Ireland Ltd: 299–305.
doi:10.1016/j.mad.2010.03.008.
Li, Wanhe, Lisa Prazak, Nabanita Chatterjee, Servan Grüninger, Lisa Krug, Delphine Theodorou, and Josh Dubnau. 2013. “Activation of Transposable Elements During Aging and Neuronal Decline in Drosophila..” Nature Neuroscience, April. doi:10.1038/nn.3368.
Li, Wanhe, Ying Jin, Lisa Prazak, Molly Hammell, and Josh Dubnau. 2012.
“Transposable Elements in TDP-43-Mediated Neurodegenerative Disorders..”
PloS One 7 (9): e44099. doi:10.1371/journal.pone.0044099.
López-Otín, Carlos, Maria A Blasco, Linda Partridge, Manuel Serrano, and Guido Kroemer. 2013. “The Hallmarks of Aging..” Cell 153 (6): 1194–1217.
doi:10.1016/j.cell.2013.05.039.
Malone, Colin D, and Gregory J Hannon. 2009. “Small RNAs as Guardians of the Genome.” Cell 136 (4). Elsevier Inc.: 656–68. doi:10.1016/j.cell.2009.01.045. Malone, Colin D, Julius Brennecke, Monica Dus, Alexander Stark, W Richard
McCombie, Ravi Sachidanandam, and Gregory J Hannon. 2009. “Specialized piRNA PathwaysAct in Germline and Somatic Tissuesof the Drosophila Ovary.”
Cell 137 (3). Elsevier Ltd: 522–35. doi:10.1016/j.cell.2009.03.040.
Maxwell, Patrick H, William C Burhans, and M Joan Curcio. 2011. “Retrotransposition Is Associated with Genome Instability During Chronological Aging..” Proceedings
of the National Academy of Sciences 108 (51): 20376–81.
doi:10.1073/pnas.1100271108.
Maze, Ian, Jian Feng, Matthew B Wilkinson, Haosheng Sun, Li Shen, and Eric J Nestler. 2011. “Cocaine Dynamically Regulates Heterochromatin and Repetitive Element Unsilencing in Nucleus Accumbens..” Proceedings of the National
Academy of Sciences 108 (7): 3035–40. doi:10.1073/pnas.1015483108.
Mätlik, Kert, Kaja Redik, and Mart Speek. 2006. “L1 Antisense Promoter Drives Tissue-Specific Transcription of Human Genes..” Journal of Biomedicine &
Biotechnology 2006 (1): 71753. doi:10.1155/JBB/2006/71753.
McCue, Andrea D, and R Keith Slotkin. 2012. “Transposable Element Small RNAs Asregulators of Gene Expression.” Trends in Genetics : TIG 28 (12). Elsevier Ltd: 616–23. doi:10.1016/j.tig.2012.09.001.
Muotri, Alysson R, Vi T Chu, Maria C N Marchetto, Wei Deng, John V Moran, and Fred H Gage. 2005. “Somatic Mosaicism in Neuronal Precursor Cells Mediated by L1 Retrotransposition..” Nature 435 (7044): 903–10. doi:10.1038/nature03663. Nordström, Ulrika, Geneviève Beauvais, Anamitra Ghosh, Baby Chakrapani
Pulikkaparambil Sasidharan, Martin Lundblad, Julia Fuchs, Rajiv L Joshi, et al. 2015. “Progressive Nigrostriatal Terminal Dysfunction and Degeneration in the Engrailed1 Heterozygous Mouse Model of Parkinson's Disease..” Neurobiology of
Disease 73 (January): 70–82. doi:10.1016/j.nbd.2014.09.012.
Oberdoerffer, Philipp, and David A Sinclair. 2007. “The Role of Nuclear Architecture in Genomic Instability and Ageing..” Nature Reviews. Molecular Cell Biology 8 (9): 692–702. doi:10.1038/nrm2238.
Pezic, D, S A Manakov, R Sachidanandam, and A A Aravin. 2014. “piRNA Pathway Targets Active LINE1 Elements to Establish the Repressive H3K9me3 Mark in Germ Cells.” Genes & Development 28 (13): 1410–28.
doi:10.1101/gad.240895.114.
Rekaik, Hocine, François-Xavier Blaudin de Thé, Julia Fuchs, Olivia Massiani-Beaudoin, Alain Prochiantz, and Rajiv L Joshi. 2015. “Engrailed Homeoprotein Protects Mesencephalic Dopaminergic Neurons From Oxidative Stress..” Cell
Reports, September. doi:10.1016/j.celrep.2015.08.076.
Rockwood, Lynne D, Klaus Felix, and Siegfried Janz. 2004. “Elevated Presence of Retrotransposons at Sites of DNA Double Strand Break Repair in Mouse Models of Metabolic Oxidative Stress and MYC-Induced Lymphoma..” Mutation Research 548 (1-2): 117–25. doi:10.1016/j.mrfmmm.2004.01.005.
Singer, Tatjana, Michael J McConnell, Maria C N Marchetto, Nicole G Coufal, and Fred H Gage. 2010. “LINE-1 Retrotransposons: Mediators of Somatic Variation in Neuronal Genomes?.” Trends in Neurosciences 33 (8): 345–54.
doi:10.1016/j.tins.2010.04.001.
Siomi, Mikiko C, Kaoru Sato, Dubravka Pezic, and Alexei A Aravin. 2011. “PIWI-Interacting Small RNAs: the Vanguard of Genome Defence..” Nature Reviews.
Molecular Cell Biology 12 (4): 246–58. doi:10.1038/nrm3089.
Skene, Peter J, Robert S Illingworth, Shaun Webb, Alastair R W Kerr, Keith D James, Daniel J Turner, Rob Andrews, and Adrian P Bird. 2010. “Neuronal MeCP2 Is Expressed at Near Histone-Octamer Levels and Globally Alters the Chromatin State..” Molecular Cell 37 (4): 457–68.
doi:10.1016/j.molcel.2010.01.030.
Sonnier, L, G Le Pen, A Hartmann, J C Bizot, F Trovero, M O Krebs, and A Prochiantz. 2007. “Progressive Loss of Dopaminergic Neurons in the Ventral Midbrain of Adult Mice Heterozygote for Engrailed1.” Journal of Neuroscience 27 (5): 1063–71. doi:10.1523/JNEUROSCI.4583-06.2007.
Tan, Huiping, Abrar Qurashi, Mickael Poidevin, David L Nelson, He Li, and Peng Jin. 2012. “Retrotransposon Activation Contributes to Fragile X Premutation rCGG-Mediated Neurodegeneration..” Human Molecular Genetics 21 (1): 57–65. doi:10.1093/hmg/ddr437.
Thomas, Charles A, Apuã C M Paquola, and Alysson R Muotri. 2012. “LINE-1 Retrotransposition in the Nervous System..” Annual Review of Cell and
Torero Ibad, Raoul, Jinguen Rheey, Sarah Mrejen, Valérie Forster, Serge Picaud, Alain Prochiantz, and Kenneth L Moya. 2011. “Otx2 Promotes the Survival of Damaged Adult Retinal Ganglion Cells and Protects Against Excitotoxic Loss of Visual Acuity in Vivo..” Journal of Neuroscience 31 (14): 5495–5503.
doi:10.1523/JNEUROSCI.0187-11.2011.
Tufarelli, Cristina, Hazel A Cruickshanks, and Richard R Meehan. 2014. “LINE-1 Activation and Epigenetic Silencing of Suppressor Genes in Cancer.” Mobile
Genetic Elements 3 (5): e26832. doi:10.4161/mge.26832.
Van Meter, Michael, Mehr Kashyap, Sarallah Rezazadeh, Anthony J Geneva, Timothy D Morello, Andrei Seluanov, and Vera Gorbunova. 2014. “SIRT6 Represses LINE1 Retrotransposons by Ribosylating KAP1 but This Repression Fails with Stress and Age.” Nature Communications 5 (September). Nature Publishing Group: 1–10. doi:10.1038/ncomms6011.
Wang, Sidney H, and Sarah C R Elgin. 2011. “Drosophila Piwi Functions
Downstream of piRNA Production Mediating a Chromatin-Based Transposon Silencing Mechanism in Female Germ Line..” Proceedings of the National
Academy of Sciences 108 (52): 21164–69. doi:10.1073/pnas.1107892109.
Wylie, Annika, Amanda E Jones, Alejandro D'Brot, Wan-Jin Lu, Paula Kurtz, John V Moran, Dinesh Rakheja, et al. 2016. “P53 Genes Function to Restrain Mobile Elements.” Genes & Development 30 (1): 64–77. doi:10.1101/gad.266098.115. Xie, Y, J M Rosser, T L Thompson, J D Boeke, and W An. 2011. “Characterization of
L1 Retrotransposition with High-Throughput Dual-Luciferase Assays.” Nucleic
Acids Research 39 (3): e16–e16. doi:10.1093/nar/gkq1076.
Acknowledgements
The study was supported by ERC Advanced Grant HOMEOSIGN n°339379, ANR– 11-BLAN-069467 BrainEver, Région Ile de France, Fondation Bettencourt Schueller and GRL program N°2009-00424. None of the authors has a financial interest in this study. We thank Wenfeng An and Jef D. Boeke for providing the wt and mutated L1 plasmids, Alain Joliot for the En2 protein, Michel Volovitch for the help in producing ORF1p and Sandy Martin for the initial aliquot of anti-ORF1p antibody used to initiate the study. We thank Thomas Tcheudjio for helping with stereological cell counting and the CIRB imaging and animal facilities for their helpful contributions.
Author contributions
AP conceived the project with JF and RLJ. AP, JF and FXBT wrote the manuscript with the help of RLJ and HR. FXBT, HR, JF, EPH and OMB conducted all experiments.
Competing interests
Figure 1. Full-length L1 elements are expressed in the adult mouse ventral midbrain and in TH+ neurons of the SNpc
(A) RNA from the three main L1 families (A, Tf and Gf), Hypoxanthine-guanine phosphoribosyltransferase (Hprt) and Tyrosine hydroxylase (Th) was measured in RNA-seq data on laser microdissected SNpc (GEO accession number GSE72321 (Rekaik et al. 2015)) and by RT-qPCR in SNpc tissue punches. RPM: reads per million, Ct: qPCR cycle threshold.
(B) Poly(A)+ RNA was purified from manually microdissected ventral midbrain, digested with DNase I and reverse-transcribed with oligo(dT) primers. A 3598 bp sequence was amplified by PCR between the 5’UTR and ORF2 (the position of the primers is indicated by two bars) and sequenced. The experiment was done using the RT buffer but not the enzyme (RT-) to measure genomic DNA contamination. (C) ORF1p from ventral midbrain was measured using western blot analysis (left panel). The same experiment was made but this time blocking the antibody with the ORF1p peptide before incubation (right panel).
(D) Midbrain slices were analyzed by in situ hybridization with L1 Tf 5’UTR oligonucleotide antisense probes in TH+ neurons of the SNpc (labeled by immunofluorescence). Scrambled probes were used as a negative control (top panel). The bottom panels show an enlargement of the region delineated by a square. Scale bars represent 100 µm and 20 µm (top and bottom panels, respectively).
(E) Midbrain slices were analyzed by immunofluorescence against ORF1p in TH+ neurons. The same experiment was made blocking the antibody with the ORF1p peptide. Scale bars represent 20 µm and 10 µm (top and bottom panels, respectively).
(F) Midbrain slices were analyzed by immunofluorescence against ORF1p in TH+, NeuN+ or TH- NeuN+ neurons and ORF1p fluorescent intensity distribution was measured (bottom). Scale bar represents 30 µm. ****p<0.0001; n=284 NeuN+ TH- neurons and n=160 NeuN+ TH+ neurons were quantified from 3 different mice; two-sample Kolmogorov-Smirnov test.
Figure 2. LINEs activation induced by oxidative stress in vivo precedes DNA damage
(A) Midbrain sections were stained for ORF1p, 3 h after 6-OHDA injection and analyzed by confocal microscopy (top) and ORF1p fluorescent intensity distribution was measured (bottom). Scale bar represents 50 µm; ***p<0.001; 370 (ipsilateral; injected) and 326 (contralateral; non-injected) neurons were quantified from 3 different mice; two-sample Kolmogorov-Smirnov test.
(B) Midbrain sections were stained at several time points after 6-OHDA injection for 8-oxoguanine (top panel left axis) and γ-H2AX (top panel right axis) and analyzed by confocal microscopy. L1 transcription was measured by RT-qPCR at the same time points in SNpc punches (bottom panel Ctrl at 100%). **p<0.01; ***p<0.001; n=4 for γH2AX, n=6 for 8-oxoguanine, n= 5 for RT-qPCR - mice per group; one-way ANOVA with Bonferroni's Multiple Comparison Test; error bars represent SEM.
(C) The RNA from the same SNpc punches as in (B) was analyzed by RT-qPCR for other stress markers. *p<0.05; **p<0.01; ***p<0.001 n=5 mice per group; one-way ANOVA with Bonferroni's Multiple Comparison Test; error bars represent SEM.
Figure 3. L1 activation induced by oxidative stress in vitro precedes DNA damage
(A) Midbrain primary neurons were treated with H2O2, active L1 transcription sites
were analyzed by fluorescent in situ hybridization (FISH) (left panel and axis) and DNA damage was measured by γ-H2AX immunofluorescence (right panel and axis) at different time points. 150 neurons were counted per condition, scale bars represent 5 µm. *p<0,05; **p<0,01; ***p<0.001; n=4 wells per condition (12 for FISH L1 Sham, 4 treated with 0.9% NaCl alongside each H2O2 treatment); one-way
ANOVA with Bonferroni's Multiple Comparison Test; error bars represent SEM.
(B) Midbrain primary neurons were treated with H2O2, the activation of different
stress pathways was analyzed by qPCR at different time points. *p<0,05; **p<0,01; ***p<0.001; n=8 wells per condition (n=7 for 1h); one-way ANOVA with Bonferroni's Multiple Comparison Test; error bars represent SEM.
Figure 4. Piwil1 overexpression protects in vitro against oxidative stress induced DNA damage
(A) Midbrain primary neurons were infected with an AAV2-PiwiL1 or AAV2-GFP for one week. Neurons were then treated with H2O2 for 1 h, L1 transcription was
measured by FISH (top panel) and DNA damage was measured by γ-H2AX immunofluorescence (bottom panel). Scale bars represent 5 µm. ***p<0.001; n=4 for FISH and n=6 for γ-H2AX wells per condition, 300-400 neurons were quantified per condition; one-way ANOVA with Bonferroni's Multiple Comparison Test; error bars represent SEM.
(B) Midbrain primary neurons were transfected with pCMV-GFP and pCMV-Piwil1 or pCMV-GFP and a void pCMV plasmid for 48 h; after which neurons were treated with H2O2 for 1 h, DNA damage was then measured by γ-H2AX immunofluorescence in
either transfected (GFP+) or untransfected (GFP-) neurons. Scale bar represents 5 µm. ***p<0.001; n=6 wells per condition, 200 neurons were quantified per condition; for transfected neurons one-way ANOVA with Bonferroni's Multiple Comparison Test; for untransfected neurons Student’s t test; error bars represent SEM.