Publisher’s version / Version de l'éditeur:
Vous avez des questions? Nous pouvons vous aider. Pour communiquer directement avec un auteur, consultez la première page de la revue dans laquelle son article a été publié afin de trouver ses coordonnées. Si vous n’arrivez pas à les repérer, communiquez avec nous à PublicationsArchive-ArchivesPublications@nrc-cnrc.gc.ca.
Questions? Contact the NRC Publications Archive team at
PublicationsArchive-ArchivesPublications@nrc-cnrc.gc.ca. If you wish to email the authors directly, please see the first page of the publication for their contact information.
https://publications-cnrc.canada.ca/fra/droits
L’accès à ce site Web et l’utilisation de son contenu sont assujettis aux conditions présentées dans le site LISEZ CES CONDITIONS ATTENTIVEMENT AVANT D’UTILISER CE SITE WEB.
Canadian Acoustics, 19, 2, pp. 3-10, 1991
READ THESE TERMS AND CONDITIONS CAREFULLY BEFORE USING THIS WEBSITE. https://nrc-publications.canada.ca/eng/copyright
NRC Publications Archive Record / Notice des Archives des publications du CNRC : https://nrc-publications.canada.ca/eng/view/object/?id=8e1e15fd-d4d1-4e76-b126-c49e2c4f052b https://publications-cnrc.canada.ca/fra/voir/objet/?id=8e1e15fd-d4d1-4e76-b126-c49e2c4f052b
NRC Publications Archive
Archives des publications du CNRC
This publication could be one of several versions: author’s original, accepted manuscript or the publisher’s version. / La version de cette publication peut être l’une des suivantes : la version prépublication de l’auteur, la version acceptée du manuscrit ou la version de l’éditeur.
Access and use of this website and the material on it are subject to the Terms and Conditions set forth at
Comparison of a multi-purpose hall with three well known concert halls
R e f
Ser
T H 1
~ational
Research
Conseil national
'
I*
1
Council Canada
l o
1 7 1 3
de recherches Canada
1 9 9 1
Institute for
lnstitut de
B t D G o
~ - -
Research in
recherche en
Construction
construction
Comparison of a Multi=Purpose
Hall with Three Well=Knowrr
Concert Halls
by J.S. Bradley
Reprinted by
Canadian Acoustics
Vol. 19. No.
2pp. 3-10
(IRC Paper No. 1713)
ANALYZED
Canadian Acoustics / Acoustique Canadienne 19(2) 3-10 (1991) Research article 1 Article de recherche
COMPARISON OF A MULTI-PURPOSE HALL WITH THREE WELL-KNOWN
CONCERT HALLS
J.S. Bradley
Institute for Research in Construction National Research Council
Ottawa KIA OR6
ABSTRACT
The results of detailed measurements are used to compare acoustical conditions in a multi-purpose hall with those in three famous concert halls. The values of five modem acoustical measures are presented for each hall. Significant differences are expected and found between the multi-purpose hall and the dedicated concert halls. The paper is intended to demonstrate the value of using extensive modern measurements to more reliably evaluate acoustical conditions in auditoria.
SOMMAIRE
Les resultats de mesures exhaustives sont utilises pour cornparer les conditions acoustiques d'une salle
A
usages multiples avec celles de trois salles de concert dlebres. Les valeurs de cinq mesures acoustiques de pointe sont prksenees pour chaque salle. L'on prevoyait des ecarts importants et on trouvait les differences entre la salle B usages multiples et les salles de concert. La presente communication viseA
demontrer queles mesures exhaustives de pointe permettent d't5valuer avec plus d'efficacite les conditions acoustiques des auditoriums.
1.
INTRODUCTION
The assessment of acoustical conditions in
an
auditorium is The volume and number of seats in each hall are given in frequently based on the personal impressions of a single Table 1.consultant with very limited objective measurement data. The purpose of b s paper is to demonstrate the value of comprehensive modem objective measurements to more reliably assess acoustical conditions in large halls. To do this, extensive measurements in the Salle Wilfrid Pelletier, Place des Arts. Montreal, are compared with similar measurements in three famous classical concert halls: Boston Symphony Hall, the Amsterdam Concertgebouw, and the Vienna Musikvereinssaal.
While most would agree that the three classical halls are acoustically excellent concert halls, Salle Wilfrid Pelletier, SWP, is intended to be a multi-purpose hall. Thus. one might wish to compare it with other good multi-purpose halls. However, it is difficult to define or get agreement as
to what constitutes a "good multi-purpose hall, and it was
2.
NEW AUDITORIUM ACOUSTICS
thought to be a more interesting exercise to consider onlyMEASURES
the performance of SWP as a concert hall. Thus, the paper
may be thought of as an exercise to determine why SWP is The study of concert hall acoustics has made considerable not a famous concert hall. Of course. it must always be progress over the past 20 years; a small number of newer remembered that preferred acoustical conditions in a multi- auditorium acoustics measures are widely accepted as purpose hall will not be the same as for a concert hall. explaining almost all of the variance in subjective
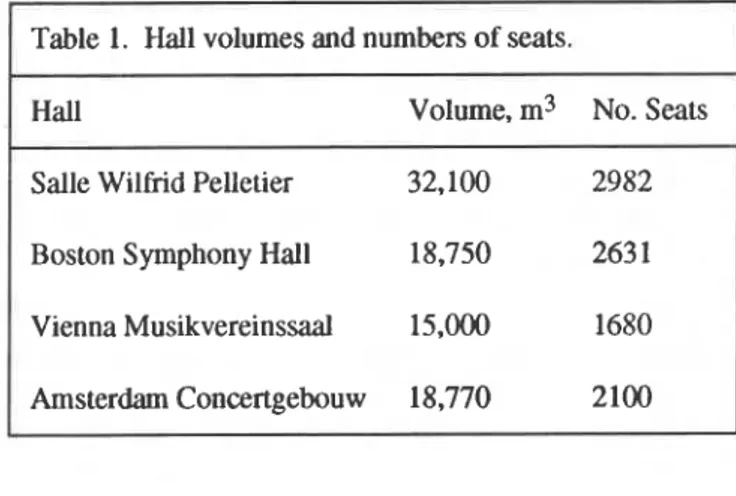
Table 1. Hall volumes and numbers of seats.
Hall Volume, m3 No. Seats
Salle Wilfrid Pelletier 32,100 2982
Boston Symphony Hall 18,750 263 1
Vienna Musikvereinssaal 15,000 1680 Amsterdam Concertgebouw 18,770 2100
assessments of acoustical conditions in halls1. There is not complete agreement on which subset of the newer measures should be used, but the quantities that are mentioned in this paper are widely accepted and provide a comprehensive picture of conditions in a concert hall.
Measurements in all four halls were made with our RAMSoft2 measurement system using a specially modified and calibrated blank pistol as the impulsive sound source. The measurement system consists of a program running on an IBM PC-compatible portable computer interfaced to a Norwegian Electronics type 830 two-channel real-time analyser. The values of 12 different parameters in each of six octave bands are obtained in situ at each position in the hall.
The 0.38 calibre blank pistol was modified so that it was a good approximation to an ideal omni-directional source3; black powder blanks are used to ensure that there is adequate energy in all the octave bands from 125
Hz
to at least 4000 Hz.The real-time analyser is used to capture, ensemble average. and filter the pulse responses which are then transferred digitally to the computer. Decay times are calculated from least squares fits to portions of the decay curves obtained by the Schroeder backwards integration technique4. Both the classical reverberation time, RT, measured over the decay from -5 dB to -35 dB, and the early decay time. EDT, measured over the first 10 dB of the decay are measured. Earlyllate arriving sound energy ratios, C36, C50, and C80 with 36, 50 and 80 ms early time intervals are calculated. C80 values are determined as follows:
where p(t) is the measured pulse response in the auditorium. The other earlynate ratios are calculated in a similar manner, but with different early time limits.
The overall strength, G, is calculated as the ratio of the total measured energy in the pulse response to the energy from the same source at a distance of 10 m in a free field as given in the following equation:
by a figure-of-eight pattern microphone to the energy measured by an omni-directional microphone over the first 80ms of the pulse response. The sensitive lobes of the figure-of-eight microphone are pointed at the side walls so that the null in the directional sensitivity is directed towards a centre stage source position. LF values are calculated as follows:
where pL(t) is the lateral response from the figure-of-eight microphone. The first integration
is
sometimes started from 0.005 seconds rather than 0.0 seconds. Both variations of LF are calculated but the differences are very small (typically 0.01 or less in the 500 Hz octave band), because the directionality of the microphone eliminates the direct sound energy arriving in the fust 5 ms. Only LF values corresponding to equation (3) are included in this paper. Values of the background noise levels, the centre time: and usefuVdeuimental sound ratios6 are also obtained but are not discussed in this paper.In this paper, octave band values of only five parameters are presented because others are either less commonly used or are usually highly correlated with one of these five parameters. These are: RT, EDT, G. C80, and LF. While RT is related to other physical properties of spaces, EDT values are related to subjective judgments of reverberance. G values relate to how loud a given sound source will be in a particular space and hence to the dynamic range that is possible during musical performances. C80 values relate to perceived clarity or the balance between clarity and reverberance, and LF values are related to the subjective sense of spatial impression or envelopment. In this paper, some further parameters are calculated from these five basic parameters to explore in more detail the strength of the sound arriving in the early and late parts of the impulse responses.
In each hall, measurements were made at all the combinations of three source positions and between 10 and 14 receiver positions distributed over all audience seating areas. Each measurement was calculated from an ensemble average of four pulse responses, and all measurements were for unoccupied conditions.
3.
HALL MEAN VALUES
where pA2(t) is the response of the source at a distance of
3.1
Reverberation
Times,
RT
10 m in a free field.Results are first examined in terms of overall mean values. The program calculates two versions of the lateral energy These means are averages over the results obtained from fraction, LF, which is the ratio of the lateral energy received
,...
H...,.,.,*, HVIENNA
b....
"..
-
I I I t I IVIENNA
,,.~...I..., -...a....
AMSTERDAM
\
...
'...
..
.BOSTON
SWP-
I I 1 I I I'
1
2
5
250
500
1000 2000 4000
'
1
2
5
250
500
1000 2000 4000
FREQUENCY,
Hz
FREQUENCY, Hz
Figure 1 . Comparison of hall-average RT values versus octave Figure 2. Comparison of hall-average EDT values versus octave
band frequency. band frequency.
between 30 and 42 combinations of source and receiver position in each hall. Figure 1 compares hall-average RT values for SWP and the other three halls. There are
differences among the hall-mean RT values; SWP has the lowest RT values in all but the lowest octave band. At
1000 Hz, SWP is almost 1 second less reverberant than the
average RT of the other three halls. This is a large difference, and SWP is less reverberant than is norn~ally considered optimum for orchestral music. (A mid- frequency RT of approximately 2 seconds is usually considered optimum for orchestral music).
These measurements were for unoccupied conditions; it would clearly be desirable to have similar results for the occupied halls. Unfortunately, reliable RT values for occupied conditions are not available and the effect of an audience can not be calculated very accurately. Since all of the halls were unoccupied during measurements, one might assume that comparisons are completely valid. This is not strictly true because the three classical concert halls all have seats that are not very absorptive, and SWP has quite absorptive seats typical of most modem halls. Thus, the effect of an audience on RT values would be greater for the classical halls than for SWP, and one would expect that occupied RT values for SWP would be a little closer to those in the other halls. Precise corrections for the effect of an audience would have to consider tlle different absorptive properties of the seats. Because this information is not available, estimates of acoustical parameters for occupied conditions, which would at best be approximations, are not included in this paper.
3.2
Early Decay Times, EDT
The hall-average EDT values are shown in Figure2. Comparison of Figures 1 and 2 shows that in these halls, mean EDT values are very similar to mean RT values. Thus, in all of these halls the perceived reverberance, as indicated by EDT values, would be very similar to that indicated by the conventional reverberation time. This is not always m e and in some halls decays are markedly non- exponential, leading to differences between RT and EDT values.
The variation with frequency d EDT and centretime values has been related to perceived timbre7. The mean EDT values of Figure 2 show relatively lower high-frequency EDT values in SWP. However, the effects of an audience would be expected to decrease EDT values in the other three halls more at higher frequencies because of their less absorptive seats. Thus, timbre differences cannot be precisely determined from this data.
3.3
Overall Strength,
G
Figure 3 compares hall average G values. Mean G values in SWP are distinctly lower than in tl~e other halls. Mid- and low-frequency G values in SWP are approximately equal to
0 dB while in the two European halls they are close to 6 dB. Thus, the same sound source: would be as much as 6 dB louder in the European halls than in SWP. ~ a r r o n ~ has found that subjects respond to level differences of only a few decibels. Six decibels corresponds to a fourfold
t
VIENNA
\,
6 - - - - a...
...
...
'a.-
-
---
-
-
->,...
...
f
.--
. - 0 - --
&..
4 , AMSTERDAM
--
-
rn
2
.---.-
- 0 ---
- - " * e xBOSTON
FREQUENCY,
Hz
/
BOSTON
,
A
.**
AMSTERDAM
VIENNA
FREQUENCY, Hz
Figure 3. Comparison of hall-average G values versus octave band Figure 4. Comparison of hall-average C80 values versus octave
frequency. band frequency.
increase in sound energy and so it can be thought of as the
same
as
having an orchestra four timesas
large. Such adifference is very significant and would enable a much greater dynamic range in the music performed in the two European halls.
The Boston hall-mean G values are intermediate to those of
the other halls and they vary more with frequency. Since the Boston Symphony Hall is considered one of the world's
best concert halls, this may indicate that this range of G
values represents what is acceptable in a good concert hall.
It is also possible that G values in the Boston hall are less
than optimum but other factors compensate to make this hall famous for its fine acoustics.
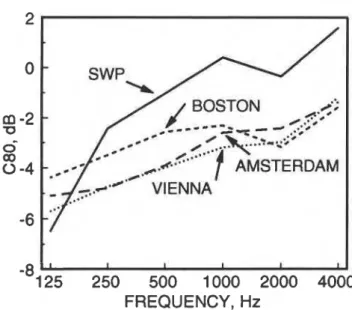
3.4
EarlyILate Ratios, C8O
The hall average C80 values in Figure4 also show
interesting differences between SWP and the other halls. In
all but the lowest octave band, C80 values are largest in
SWP. Thus, the sound in SWP will have more clarity than the famous concert halls. This higher clarity in SWP is probably more than is optimum for orchestral music, but perhaps is more appropriate for a multi-purpose hall.
Mean C80 values also vary with frequency more in SWP
than in the other halls. The SWP mean C80 values are
characterized by a prominent minimum in the 125 Hz
octave band. This is due to the grazing incidence
attenuation of low-frequency sound by audience seating. Although this phenomenon was discovered some time ago8s9, its dependence on the details of an auditorium are
not well understood. New results10 suggest that the seat dip attenuation is less in halls with strong ceiling reflections. SWP has a very high reflective ceiling that is bchind an acoustically transparent ceiling and various duct work. Thus, strong ceiling reflections do not occur at most seats in SWP and the low frequency seat dip attenuation is particularly pronounced.
3.5
Lateral Energy Fractions, LF
The hall-average LF values in Figure 5 show that these
values are lowest in SWP. The values of this ratio in the other halls are approximately double the SWP values. Thus, the fraction of the early energy that arrives at listeners from the side is much less in SWP. Consequently, spatial impression or the sense of being immersed or surrounded by the music will be much less in this hall. Spatial impression is known to be a very important attribute of a good concert hall. The narrow rectangular shapes of the classical concerl halls naturally produce relatively strong early side wall reflections. The wide fan-shaped plan of SWP makes it almost impossible to provide strong early reflections to all members of the audience. However, this plan does make it possible to seat more audience members closer to the stage, which again may be more important in a multi-purpose hall.
3.6
Early and Late Energy Levels, G80,
GEL, and G(late)
The mean overall G values in Figure 3 indicated substantial differences between SWP and the other halls. It is therefore of interest to consider these differences further by
0.3
2
...
.
VIENNA\
0-
-
,...
...
0
-
...
- - - - /.
0.2
/;..--
LL 1'...
6
-4
-*,*-'SWP
....
0.1
SWP
-6
-
-8
-
'125
2i0
500
6 0 0 2000 4000
-1°1;5
250
5d0
IOOO
2doo 4000
FREQUENCY,
Hz
FREQUENCY, Hz
Figure 5 . Comparison of hall-average LF values versus octave Figure 6. Comparison of hall-average G8O values versus octave hand frequency. band frequency.
examining the separate temporal components of the sound energy in each hall. Thus, the early, the late, or the early lateral energy are considered separately in terms of G values. G80 is the G value of the sound energy arriving
within tl~e first 80 ms after the direct sound. G(1ate) is the G
value of the sound energy arriving more than 80 ms after the direct sound, and GEL is the G value of the early lateral
energy arriving within tl~e first 80 ms after the direct sound,
Figure 6 compares hall-average G80 values for all four halls. These early sound levels are lowest for SWP and approximately 4 dB lower than in the two European halls at mid-frequencies and even more different at lower frequencies.
Hall average GEL values in Figure 7 show that the early lateral energy is considerably smaller in SWP than in tl~e
other halls. At mid-frequencies, tl~e mean GEL values for
SWP are approximately 5 dB lower than those in the other
halls. This lack of early lateral energy is a major cause of
the lower LF values in this hall. GEL values were
particularly low at 125 Hz where they are more than 8 dB less Ihan in the two European halls.
Spatial impression depends on having an adequate portion
of the early energy arriving from the side and also on having relatively high sound levels. Low-frequency lateral energy is particularly important for a good sense of spatial impression. Having low GEL values is evidence of a lower portion of early lateral energy, as well as having lower levels of this sound. Given that Ihis is particularly true at lower frequencies, it is clear that Lhe sense of spatial
impression will be much less in SWP than in tl~e other halls.
...
...
...
-8
0 ,.LC,
'
.*...
-1 0
2-
--
'' x
AMSTERDAM
FREQUENCY,
Hz
Figure 7. Comparison of hall-average GEL values versus octave band frequency.
The mean G(1ate) values are compared in Figure 8. These
values are quite similar to the overall G values in Figure 3.
indicating that the late arriving energy makes up most of the overall G values. The mean mid-frequency late energy is
approximately 7 dB lower in SWP than in the two European
halls. One might therefore expect a much smaller sense of
reverberance in SWP than in the two European halls. It is
unlikely that the added effect of audience absorption would greatly diminish this difference. Again, the Boston hall results are intermediate to the others, suggesting that lower
-6
-8
125
250
500
1000 2000 4000
10
20
30
40
FREQUENCY, Hz
DISTANCE, m
- /VIENNA
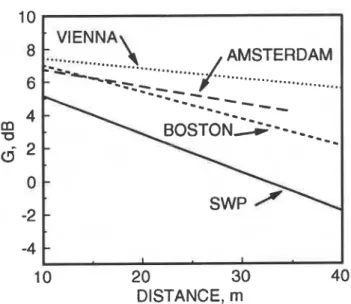
Figure 8. Comparison of hall-average G(1ate) values versus octave Figure 9. Linear regression lines for 1 kHz G values versus
band frequency. source-receiver distance.
-
late energy levels are, at least in some combinations of conditions, acceptable.
""*...-.-
...,,,,.,~~,.,.,.,.
...-m'...
..,,,m+,,,-
--
---
-
-
- -
...
/
* * - - - - - - %-
AMSTERDAM
4-
";;;..
.;:'
.--.
..
.
.---
BOSTON
4.
VARIATION OF LEVELS WITH
DISTANCE
SWP
/
I 1 1 1 I I
It is of interest to examine the variation of nleasured values from position to position within each hall. Some halls have larger seat-to-seat variation which is assumed to be less desirable than uniformly good conditions. In all of these halls, the within-hall variation of RT, EDT, and C80 values were a l l quite small. LF values tend to vary more from seat- to-seat than the other parameters and these four halls were no exception. The within hall variation of the overall sound levels was examined further by plotting G values versus source-receiver distance.
Figure 9 compares 1
kHz
G values versus distance in allfour halls. Only the best fit linear regression lines to the measured data have been included to simplify the comparison. In all cases, the data were well represented by the regression lines with associated standard errors of between 0.6 and 0.8 dB. As observed earlier, G values were lowest for SWP. They also decrease more rapidly with distance in SWP. The regression lines indicate that, on average, 1
kHz
G values decrease at 2.3 dB110 m in SWP,while in the Vienna hall, 1 kHz G values decrease at only 0.6 dB110 m. These two values are close to the two extremes of decay rates that we have measured in halls. Closer seats in SWP may have G values that are 2 to 3 dB lower than the other halls, but the farthest seats have G values that are 5 to 6 dB lower. Thus, the weaker sound in SWP would be most noticeable at rear seats.
The observed decreases of overali G values with distance are in contradiction with simple diffuse field theory. In an ideal diffuse field, sound levels are essentially constant with distance in the reverberant field where the contribution of the direct sound is not significant. Although such diffuse conditions rarely occur in real rooms, diffuse field G values can be predicted by the following equation:
G = 10 log { Ql(4m2)
+
4RT/(0.16 1 V) )+
3 1, dB (9)where:
V is the room volume, m3;
Q is the directivity factor of the source and is 1 for an omni-directional source;
r is the source-receiver distance, m.
Barron and Lee11 have developed an improved technique for predicting sound levels in concert halls that better correlates with measurements. Their procedure sums separate estimates of the contributions of the direct, early, and late arriving sound energy. All three components vary with source-receiver distance, causing predicted G values to decrease with increasing source-receiver disrance. Figure 10 plots measured 1 kHz G values versus source- receiver distance in the Vienna hall. For comparison, the predictions of simple diffuse field theory and Barron and Lee's revised theory are also included. While the diffuse field theory does not agree well with measurements, Barron
...
O@ JDIFFUSE
FIELD ;..
' - * a ..p"..,. ...
*.".."...
..
...
8 *--
--.
-*.'-4
% o 0BARRON
-
C-
I I DIFFUSE FIELD-
8
o0 0 8-
BARRON DISTANCE, mDISTANCE, m
-
I IFigure 10. Comparison of measured 1 W z G values with Figure 11. Comparison of measured 1 kHz G values with
predictions of diffuse field theory and Barmn's revised theory for predictions of diffuse field theory and Barron's revised theory for
the Vienna Hall. SWP.
I
and Lee's predictions do agree well with these reverberance is less in SWP. EDT and RT values are measurements. Similar improved agreement has been generally lower, and late arriving sound levels are as much obtained with measurements in other halls. as 7 dB lower than in some of the other halls.
Figure 11 shows similar comparisons for the SWP. Again, the diffuse field predictions are not acceptable, but the measured values do not agree as well with Barron and Lee's predictions for this hall. For seats closer to the stage, measured values exceed predictions by approximately 2 dB. At the farthest seats from the stage measured, values are less than predicted by about 1 dB. Conditions in SWP are less diffuse than found in many auditoria and show more variation with distance than predicted by Barron and Lee's revised theory.
5.
CONCLUSIONS
In comparison with the three famous concert halls, SWP is seen to be lacking as a concert hall. The sound in SWP is first of all weaker; G values are lower by up to 6 dB. Thus, the same sound source in SWP would be weaker than in the other halls, and ll~e dynamic range available to musicians would be less. Secondly, the sound in SWP is lacking in spatial impression compared to tl~e other three halls. The sense of being immersed in, or surrounded by the music, which is essential to a fine concert hall, is much diminished in SWP. This was identified by lower LF and GEL values. The clarity of the sound in SWP is higher than in the other halls and there is stronger evidence of the attenuation of low-frequency early energy due to grazing incidence propagation over audience seating. Conversely, the sense of
The geometry and materials of SWP are largely the cause of these differences. The much larger volume would relate to lower G values. The wide fan-shaped plan naturally leads to weaker early lateral reflections. The lack of strong ceiling reflections would lead to the greater decrease of sound levels with distance and to the stronger attenuation of early low frequency sounds in SWP.
These differences probably explain the major acoustical reasons why SWP is not generally considered to be a famous concert hall. However, while the other three halls are single purpose concert halls, SWP is a multi-purpose hall. The acoustical requirements for a multi-purpose hall must be a compromise between the needs of the various types of performances. Thus, at least some of these differences make the hall more suitable for other types of performances. For example, less reverberant conditions would be preferred for amplified performances and smng side wall reflections would not be needed. Seating the audience closer to the stage, for visual reasons, would then be more of a priority than lateral reflections. Although higher G values might be preferred for almost all types of performances, the smaller hall volume that this would require would again conflict with the needs of other types of performances.
A
multi-purpose hall must be a balance between the needs of the various intended uses. Itcan
be more or less acceptable as a concert hall depending on how important this particular type of use is seen to be. An optimum compromise (which is perhaps a contradiction)can
only be decided in terms of the priorities of the owners and users. The results in this paper consider only the major differences between SWP and the three classical halls. It is possible to go into much more detail in examining the within-hall variation of these properties. Thiscan
lead to a better understanding of acoustical conditions in each hall but is beyond the scope of this paper. It is also possible to evaluate the influence of particular aspects of the hall such as the removable orchestra shell. Measurements for this purpose were made and will be reported in a future paper. Of course, the results of this paper relate only to unoccupied conditions. The addition of an audience would change conditions in these halls and the changes would be larger in the three classical concert halls because of their less absorptive seats.The quite obvious differences that were found very clearly demonstrate the value of using thorough modem measurements to evaluate acoustical conditions in auditoria. The differences are unambiguously described in terms of objective quantities. This systematic objective assessment leads to
a
better overall understanding of acoustical conditions in each hall. The alternative, of largely unsubstantiated individual opinions, is simply not reliable and not acceptable.REFERENCES
1. Bradley, J.S., "The Evolution of Newer Auditorium Acoust~cs Measures", Canadian Acoustics. Vo1. 18, NO. 4. 13-23.(1990).
Bradley, J.S., and Halliwell, R.E., "New Room Acoustics Measurement Software", J. Acoust. Soc. Am., Vol. 80, S39, (1986).
Lamothe, M.J.R. and Bradley, J.S., "Acoustical Characteristics of Guns as Impulse Sources", Canadian Acoustics, Vol. 13, 16-24, (1985).
Schroeder, M.R., "New Method of Measuring Reverberation T i e " , J. Acoust. Soc. Am., Vol. 37,409- 412, (1965).
Cremer, L. and Miiller, H.A., "Principles and Applications of Room Acoustics", Applied Science Publishers, London, (1982).
Bradley, J.S., and Halliwell, R.E., "Making Auditorium Acoustics More Quantitative", Sound and Vib., Vol. 23, 16-23. (1989).
Barron, M., "Subjective Study of British Symphony Concert Halls", Acustica. Vol. 66, 1-14. (1988).
Schultz, T.J.. and Watters, B.G., "Propagation of Sound Across Audience Seating", J. Acoust. Soc. Am., Vol. 36, 885-896, (1964).
Sessler, G.M., West, J.E.. "Sound Transmission Over Theatre Seats", J. Acoust. Soc. Am., Vol. 36, 1725-1732, (1964).
Bradley. J.S., "Some Further Investigations of the Seat Dip Effect", Submitted for publication to J. Acoust. Soc. Am.
Barron, M. and Lee, L-J., "Energy Relations in Concert Auditorla. I", J. Acoust. Soc. Am., Vol. 84. 618-628. (1988).